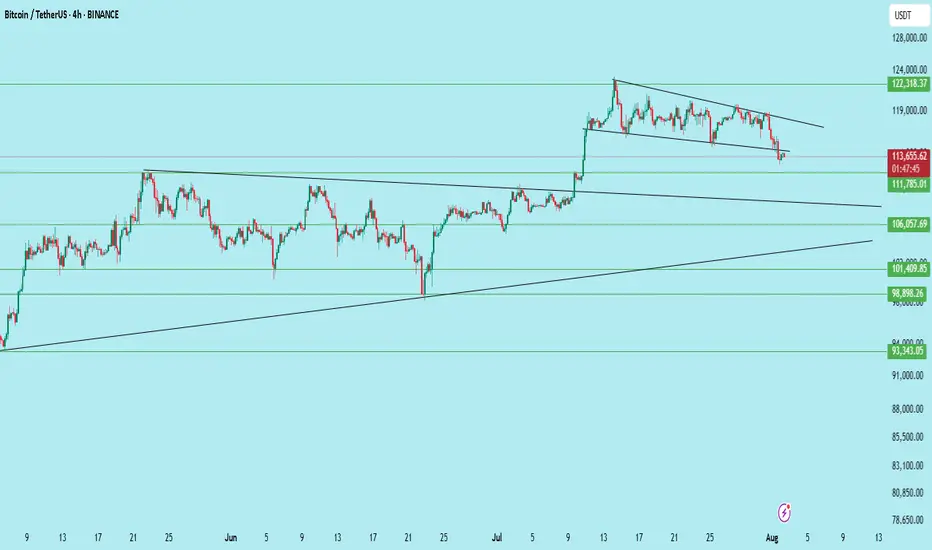
$BTC /USDT – Breakdown from Channel, Bears Gaining ControlBitcoin has broken down from its descending channel on the 4H chart after repeated rejection from the upper trendline. Price is now hovering near key support at $111,785.
Key Technicals:
Rejection from the descending trendline resistance
Breakdown of the mini-channel structure
Current price: $113,637
Support levels:
$111,785 (Immediate)
$106,057
$101,409
$98,398
Bearish continuation is likely if $111,785 breaks with volume
If the $111.7k zone fails to hold, BTC could see further downside toward $106k and even $98k in the coming sessions.
Invalidation: Bullish only on reclaim of $117K+ with strength.
DYOR | Not Financial Advice
Btctradingidea
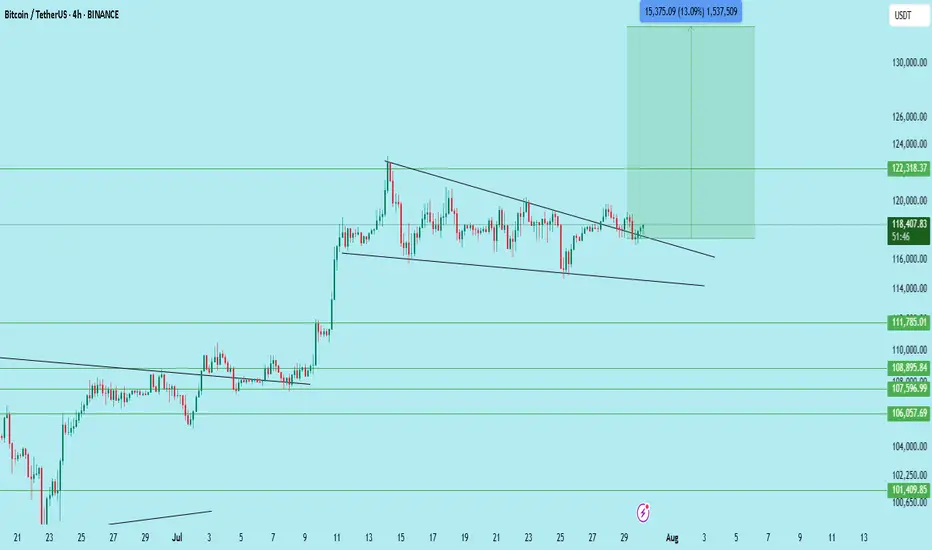
$BTC/USDT – Bull Flag Breakout on 4H | Targeting $133,700Bitcoin has just broken out of a well-defined bull flag structure on the 4H chart, signaling a potential continuation of the previous uptrend.
This breakout comes after a strong impulsive move upward, followed by a textbook flag consolidation with lower highs and lows forming a descending channel. The breakout above the flag resistance suggests a bullish continuation pattern is in play.
Technical Breakdown:
Pattern: Bull Flag (Continuation)
Flagpole base: ~106,700
Breakout zone: ~117,600
Retest Support: 116,000
Immediate Resistance: 122,300
Expected Target: 133,700 (based on flagpole projection)
Invalidation: Breakdown below 115,500
Expected Move:
Measured Move Target: ~13% upside from breakout
Confluence: Target aligns with past supply zone near 133K–135K
Price has also reclaimed the 50 EMA on the 4H chart, and the volume on the breakout shows bullish interest. Watching closely for a clean retest of the breakout zone for confirmation.
Conclusion:
BTC is showing bullish continuation after breaking out of a flag. A successful retest of 117.6K–116K range could offer further upside. Traders should manage risk accordingly.
DYOR | Not Financial Advice
Caught the Short? CPI Ahead, and This Pullback Isn’t Over YetIf you’ve been following the recent updates, I believe you were well-prepared for this move.
For the past few days, I repeatedly emphasized that we may not break through the supply zone in one go—and now, those who entered short positions likely enjoyed some solid profits.
Currently, we’re seeing a strong rebound from the second support zone.
This is the first real, sharp correction we’ve seen since the strong bullish trend began from the 74K–83K region, and that alone should remind us to proceed with caution going forward.
To maintain the broader uptrend, the market needs to do one of two things:
Either preserve the local low formed during the latest drop and climb from there (ideal scenario),
Or, if it dips lower once more, form a sideways base before recovering again.
This structure would confirm that the trend remains healthy and intact.
Right now, we must assess whether this bounce leads to continuation or if it’s just a relief rally before a deeper wave down.
If we break the structure and revisit previous demand zones, we want to see price hold and reverse from those levels—that’s the key confirmation.
The previous slow grind-up ("step-by-step climb") has now been disrupted.
This shift increases the likelihood of a deeper retracement before any new highs, especially with today's CPI data potentially triggering strong volatility and head-fake moves in both directions.
If price fails to push higher from here, we may see a breakdown below the psychological 100K level.
We’re still observing a bearish structure on the lower timeframes, as the price fails to make higher highs—so please, avoid jumping into positions impulsively.
This is the correction we’ve been waiting for, and those who followed the updates likely navigated it well.
However, be aware:
When a market climbs on strong green candles, the subsequent drop can be equally harsh, especially if profit-taking meets negative macro headlines.
So, wait for confirmation—whether it’s a bounce that protects support or a break that reclaims structure. Entering after such confirmation will always get you better entries than acting out of fear.
As I’ve said many times:
You don’t need to FOMO into every pump.
Opportunities always come again. And history shows us—trading out of impatience or greed rarely ends well.
Stay focused, stay patient, and I hope your next trade brings another solid win.

Bitcoin Trading and Investment Strategy (April 2025)Bitcoin (BTC) is trading around the mid-$90,000s after rebounding ~25% in April, with market sentiment shifting to greed. BTC’s dominance is high (~64%) as capital concentrates in Bitcoin over altcoins. On-chain data shows large holders (“whales”) aggressively accumulating, even as short-term traders turn optimistic. Below is an actionable strategy.
BTC broke out of a multi-month falling wedge pattern, signaling a potential bullish reversal. On the 1H/4H charts, momentum is bullish: a textbook double-bottom formed on the daily with a neckline around $87,600 was breached, confirming upside targets near $100,600.
A bull pennant consolidation is visible on the 1H after the sharp rally, hinting at another leg up (measured move target ≈ $100,900 on breakout). Short-term EMAs (20/50) on 1H/4H have turned upward and are stacked bullishly, aligning with the daily 50 and 200 EMAs which have flipped into support. The Relative Strength Index (RSI) is in bullish territory without extreme overbought readings, leaving room for further upside. Volume has been steady to rising on upward moves, indicating buyers remain in control.
Immediate support lies at the breakout zone of GETTEX:87K –$90K (prior resistance now turned support). This area includes the daily double-bottom neckline (~$87.6K) and coincides with the top of the earlier consolidation range. Bulls want to see this zone hold on any pullback. Below that, secondary support is around $84K and roughly the 4H 200 EMA area.
Resistance is clustered at $94K–$95K (recent local high region). A 4H close above $95K with strong volume would likely trigger momentum buyers. Beyond there, $100K is a major psychological level and the short-term target from multiple patterns – importantly, a dense cluster of short seller liquidation levels sits around $100K, making it a “liquidity magnet” for market makers. Expect heavy order flow and possible volatility as BTC approaches six figures. Above $100K, minor resistance could appear near ~$102K (projected wedge target), then prior ATH ~$108K–$109K.
For longs, scale out profits in layers as BTC advances. First TP around $100K – just before the round number – to avoid slippage if a wave of selling hits there. If momentum is very strong, hold a portion for a possible extension to $102K–$105K (wedge target zone). A stretch goal for bulls would be the $108–$110K area (all-time high region), but tighten stops well before this level as profit-taking is expected near ATH.
If BTC falls back under the GETTEX:87K neckline after having broken out, it would negate the double-bottom breakout and likely accelerate downward. Thus, stop-losses for longs can be placed just below GETTEX:87K (e.g. $86K) to cap risk.
The breakout from the wedge/base was accompanied by a surge in volume, confirming institutional participation. Volume has not dried up on this rally – a positive sign that the trend could sustain. Overall, the daily chart structure sets the stage for a potential run back to five-figure territory (100K+), provided key support levels are defended.
Any dips into the high-$80Ks are buy-the-dip opportunities as long as BTC quickly reclaims $90K. Below GETTEX:87K , the next critical support is $80K–$84K. $84K was highlighted as a crucial level – failure to hold 84K during the last pullback would have signaled capitulation. It held then, so watch it on any retest.
Stop Loss:
Short-Term: 5–10% below entry ($90,000 for $92,500 entry).
Mid-Term: 10–15% below entry ($85,000 for $91,000 entry).
Long-Term: Monitor support ($80,000) but hold unless fundamentals deteriorate.
Position Sizing:
Short-Term: 1–2% of portfolio per trade.
Mid-Term: 5% of portfolio.
Long-Term: Up to 10% of portfolio.
Risk/Reward: Target 2R for short-term, 3R for mid-term, and let long-term investments ride based on fundamentals.
Not a financial advice. DYOR.

$BTC: Last 2 months pump before the bear market starts.On the chart, you can clearly see the similarities between the last cycle and the current one.
First, this cycle is already longer, so I don’t expect another top in 2026, as some are suggesting.
Based on my analysis, we are currently in the equivalent stage of the last cycle where two strong monthly candles appeared before the market dropped into a bear phase.
Why is this happening?
We are resetting the weekly MACD — it's at the bottom and needs to push into overbought territory before it can turn down alongside the monthly MACD.
As shown in the chart, the monthly MACD is close to turning bearish. If the weekly MACD also flips bearish, that could mark the end of the bull market.
Additionally, volume is dropping, and the RSI supports this scenario. It looks like we’re setting up for one last pump, just like last time — likely followed by a rejection in 2 months.
📊 Check the chart — I’ve laid it out as clearly as possible.
💬 If you agree or disagree, let’s discuss in the comments!
🧠 DYOR — Do Your Own Research!
#Bitcoin #CryptoAnalysis #MACD #RSI #CryptoCycle #BullMarket #BearMarket #BTC #CryptoTrading #TechnicalAnalysis #DYOR #Altcoins #MarketUpdate #CryptoCommunity #Cryptocurrency

BTCUSD NEXT MOVE BRIEF ANALYSIS IS HERE!Bitcoin (BTCUSD) is currently trading near a strong demand zone, indicating a potential bullish reversal setup.
🔹 Key Levels & Zones:
Strong Demand Zone: BTC has entered a high-liquidity support area around $84,900 - $86,000, which has previously acted as a reversal zone.
Potential Upside Target: The first key resistance level is at $89,300, while a breakout could push BTC towards the $92,400 - $92,500 range.
Stop-Loss Consideration: Below the demand zone low to minimize downside risk.
🔹 Trade Plan & Expectations:
Bullish Reversal Setup: The current price action suggests that Bitcoin is forming a higher low within a demand zone, which may result in an upward move.
Breakout Confirmation: If price holds above $87,000, a push toward $89,000 - $92,500 is likely.
Bearish Invalidations: If price breaks below $84,900, the bullish setup may get invalidated, signaling further downside.
📈 Bullish Bias: A strong entry point is forming in the demand zone with a high reward-to-risk setup targeting key resistance levels.

BTC trade idea for long so there is unmitigated demand zone near 95700ish level i have marked that area with green box
wait for the price and check if the level is being respected and price is trying to form bullish condition or any green candlestick pattern
because news or anything else external can affect the technical analysis for its failure
and stop loss could be 93600-650 with target of 100,830 that comes around 2.5 risk to reward go easy with the size of trade
will update the idea further as price action forms nearby our level

BTCUSDT URGENT LOOK 4H. IS THE TOP IN?Let's get some major point clea r:
1. AMEX:BTC is still overbought. Bulls or "moonboiz" must not leave in denial anymore.
2. PA shows a decrease of -1.7% in the last 24-hours
3. The 100k psychological level has been difficult to maintain for Bitcoin.
The channel shows a weakening run, which is expected at this point. The complete correction is yet to happen, only flashes of volatility. If BTC breaks out and down off the lower channel, that will signal the start of the needed correction. 200 EMA will be in play (92k - 90k)
On the bright side, 4h TF is looking too juicy already and same for many Altcoins , I expect AMEX:BTC to pump anytime soon , while the alts will follow. For this bitcoin must catch the 98k price level and hold it .
AMEX:BTC must overcome the resistance price level and reclaim 98k - 99k . Mondays are usual bloodbath due to Market fresh actions.
Small traders are driving the volatility at the moment, while large investors are holding strong. Monthly looks good for bitcoin as well, which makes me not cancelling 120k - 140k bitcoin price in this run.
I'll be neutral for now, update to follow soon.
Like and follow. Comment if you disagree.

Degrees of BTC Know Your EnvironmentWhile crypto is an emerging technology sector as a whole, it is important to remember that BTC is a maturing 13-year-old asset.
Using a logarithmic chart of Bitcoin going back to the beginning, it is not hard to see the perfect curvature of price action as it searches for its fair market value.
Simple line tool measurements of the time vs. price increase of each bitcoin bull run show a stunning relationship of exactly 15 degrees of momentum loss from each exact bottom to the next exact high.
This is a monthly Bitcoin all-time history bar chart. Using the line tool and magnet, simply draw a line from each low to the next high. Use the line tool options to display the stats on-screen with the angle. If you zoom in or out, the angles will change degrees but will always remain near exactly 15 degrees apart. We have adjusted this chart for the first bull run angle to 75% to make it easy to see the successive 15-degree change each run.
Thankfully in this sequence there is one more 15 degree increment left meaning another run is most likely under way already. Looking at the logrithmic progression of the lows marked on the chart by the perfect red curve it would not be out of line to come down and tap it but breaking below it will happen some day and probably spell very bad news.

In Short Term BTC is BullishIn our daily chart, you can see in the orange circle wave 4 in blue and wave 2 in black which are edging buy area. The green Fibonacci Retracement 38.2% area shows the end of wave 4 which is a buy area once BTC(Bitcoin) is bullish in short term. Wave 2 is an edging buy area and we need to wait for some weeks to happen. Don't sell BTC(Bitcoin) in all time frames now . Next week, we'll update this chart again.
