BTC:LIVE TRADEHello friends🙌
📉Given the decline we had, we now had a good price rebound in the specified support area, which shows the power of buyers. Now, with capital and risk management, we can buy at the specified points in a stepwise manner and move to the specified targets.
🔥Follow us for more signals🔥
*Trade safely with us*
Btctrend

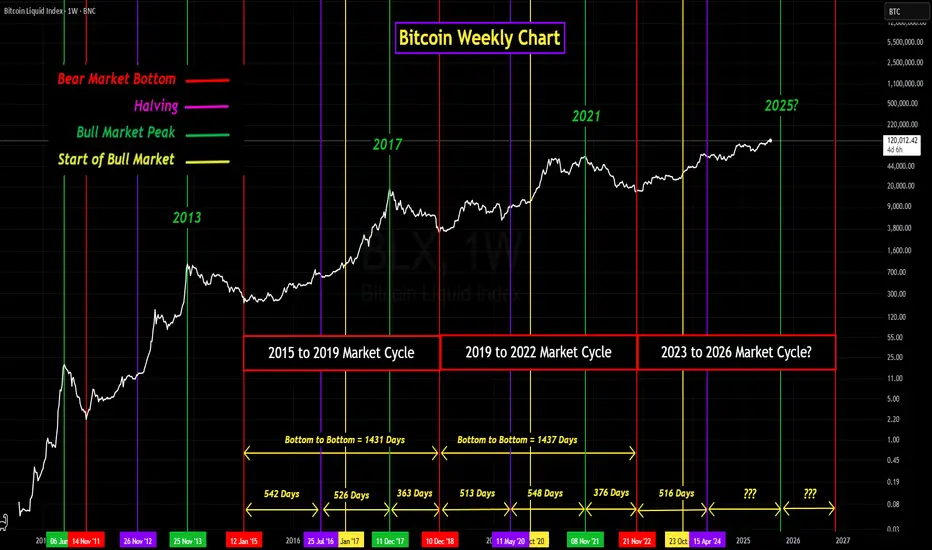
GROK's Analysis of Bitcoin's 4-Year Market CyclesIn the past I have published my own analysis of Bitcoin's 4-year market cycles, (cycles 2 and 3).
My purpose for analyzing the market cycles was to determine how similar in elapsed times the last two market cycles were to each other. Not only in the length of the overall market cycle but also between the major events, (bear market low to the halving, halving to the market cycle peak, and market cycle peak to the next bear market low).
The results of my analysis shocked me. Not only were the last two cycles very close in overall length but they were also (in my opinion) very close in the elapsed times between the major events. I was shocked because an open market, whether it is the stock market, crypto market, or any other openly traded market can be influenced by so many different factors both inside and outside of the market.
Internal factors that can influence an openly traded market could include, Supply and demand dynamics, market sentiment (investor psychology) and speculation, and market structure. External factors can include Macroeconomic conditions, Geopolitical events, Regulatory environment, Global events and crises, Interplay and volatility, and Monetary policy and liquidity. Then add into all of these influential factors that the Bitcoin market is traded globally, 24 hours a day, 7 days a week, and 365 days a year, it never closes.
Taking all of these influential factors into consideration, it boggles my mind how there could be so much consistency between the market cycles. Anyway, my reason for publishing this topic again is because my analysis was basic. So I asked GROK to analyze the last three market cycles including the current cycle and compile all the results into a report.
Can you analyze the last two Bitcoin 4-year cycles, (Jan. 14, 2015, to Dec. 15, 2018) and (Dec. 15, 2018, to Nov. 21, 2022), and compare them against each other?
Then analyze the current market cycle which started on Nov. 21, 2022, and note any similarities with the previous two market cycles. Also, if possible, try to predict when this market cycle peak might occur. Please also include any analysis that you can do on Global liquidity including United States M1 and M2 money supply trends, U.S. money printing, and any relationship / correlation to U.S. interest rates.
Please analyze the following along with any other pertinent data and make a comparison between the two cycles:
• The duration from bear market low (beginning of the market cycle) to the halving.
• The duration from halving to the market cycle peak price.
• The duration from the market cycle peaks to the next bear market lows.
• The duration of the overall market cycle (bear market low to the next bear market low).
• Percentage gain from the bear market low to the market cycle peak.
• Percentage loss from the market cycle peak to the next bear market low.
• Please include the dates of the bear market lows, market cycle peaks, and halvings.
• If possible, list the price corrections from each market cycle that exceed 20%. Also I want you to add any other pertinent data that you find in your analysis.
Note: For this report the current price for Bitcoin on July 22, 2025 at 9:40 Eastern Standard time is $119,556.82
Below is a detailed analysis of the last two Bitcoin 4-year cycles (2015–2018 and 2018–2022), a comparison of their key metrics, an examination of the current cycle (starting November 21, 2022), and an exploration of global liquidity, U.S. M1 and M2 money supply trends, U.S. money printing, and their correlation with U.S. interest rates. I’ve included the requested metrics (durations, percentage gains/losses, key dates, and price corrections exceeding 20%) and additional pertinent data such as macroeconomic factors and on-chain metrics. Finally, I provide a speculative prediction for the current cycle’s peak based on historical patterns and current trends.
Analysis of Bitcoin 4-Year Cycles
Cycle 1: January 14, 2015 – December 15, 2018
Bear Market Low: January 14, 2015, $176.90
Halving Date: July 9, 2016 (block reward reduced from 25 to 12.5 BTC)
Market Cycle Peak: December 4, 2017, $19,666
Next Bear Market Low: December 15, 2018, $3,122
Durations
Bear Market Low to Halving: 542 days (January 14, 2015 – July 9, 2016)
Halving to Market Cycle Peak: 513 days (July 9, 2016 – December 4, 2017)
Market Cycle Peak to Next Bear Market Low: 376 days (December 4, 2017 – December 15, 2018)
Overall Market Cycle (Bear Market Low to Next Bear Market Low): 1,431 days (~3.92 years)
Price Movements
Percentage Gain (Bear Market Low to Peak): ($19,666 - $176.90) / $176.90 = 11,018.09%
Percentage Loss (Peak to Next Bear Market Low): ($19,666 - $3,122) / $19,666 = -84.12%
Price Corrections Exceeding 20%
May 2017: ~30% correction (from ~$2,700 to ~$1,900)
June–July 2017: ~40% correction (from ~$3,000 to ~$1,800)
September 2017: ~35% correction (from ~$5,000 to ~$3,250)
December 2017 – February 2018: ~65% correction (from $19,666 to ~$6,900)
April–May 2018: ~35% correction (from ~$9,700 to ~$6,300)
November–December 2018: ~50% correction (from ~$6,300 to $3,122)
Key Observations
The 2015–2018 cycle was characterized by a prolonged accumulation phase post-2015 low, with the halving in July 2016 acting as a catalyst for a bull run.
The market peak occurred ~17 months after the halving, driven by retail investor enthusiasm and the ICO bubble.
The bear market was severe, with an 84.12% drawdown, exacerbated by the ICO bubble collapse and regulatory concerns.
Cycle 2: December 15, 2018 – November 21, 2022
Bear Market Low: December 15, 2018, $3,122
Halving Date: May 11, 2020 (block reward reduced from 12.5 to 6.25 BTC)
Market Cycle Peak: November 8, 2021, $67,589
Next Bear Market Low: November 21, 2022, $15,476
Durations
Bear Market Low to Halving: 513 days (December 15, 2018 – May 11, 2020)
Halving to Market Cycle Peak: 546 days (May 11, 2020 – November 8, 2021)
Market Cycle Peak to Next Bear Market Low: 378 days (November 8, 2021 – November 21, 2022)
Overall Market Cycle (Bear Market Low to Next Bear Market Low): 1,437 days (~3.94 years)
Price Movements
Percentage Gain (Bear Market Low to Peak): ($67,589 - $3,122) / $3,122 = 2,064.22%
Percentage Loss (Peak to Next Bear Market Low): ($67,589 - $15,476) / $67,589 = -77.10%
Price Corrections Exceeding 20%
March 2020 (COVID-19 Crash): ~50% correction (from ~$10,000 to ~$5,000)
May–July 2021: ~50% correction (from ~$64,000 to ~$29,000)
November 2021 – January 2022: ~40% correction (from $67,589 to ~$40,000)
May–June 2022 (Terra/Luna Collapse): ~45% correction (from ~$40,000 to ~$18,000)
November 2022: ~25% correction (from ~$20,000 to $15,476)
Key Observations
The 2018–2022 cycle saw a shorter accumulation phase before the halving, partly due to the COVID-19-induced liquidity injection in 2020.
The bull run post-halving was fueled by institutional adoption (e.g., Tesla, MicroStrategy) and retail FOMO, amplified by global stimulus.
The bear market was less severe than the previous cycle (77.10% vs. 84.12%), but events like the Terra/Luna collapse and FTX bankruptcy triggered significant corrections.
Key Similarities
Cycle Duration: Both cycles lasted approximately 4 years (~1,431–1,437 days), reinforcing the 4-year cycle tied to Bitcoin’s halving schedule.
Halving as Catalyst: In both cycles, the halving (2016 and 2020) marked the start of significant bullish momentum, with peaks occurring 513–546 days post-halving.
Bear Market Drawdowns: Both cycles experienced severe drawdowns (84.12% and 77.10%), though the 2018–2022 cycle was less extreme, possibly due to increased market maturity.
Multiple Corrections: Both cycles saw 5–6 corrections exceeding 20%, reflecting Bitcoin’s high volatility during bull and bear phases.
Key Differences
Percentage Gains: The 2015–2018 cycle had a much higher percentage gain (11,018.09% vs. 2,064.22%), likely due to Bitcoin’s lower starting price and the speculative frenzy of the ICO bubble.
External Influences: The 2018–2022 cycle was heavily influenced by macroeconomic events (COVID-19 stimulus, institutional adoption), while the 2015–2018 cycle was more driven by retail speculation and the ICO boom.
Correction Triggers: The 2015–2018 bear market was driven by regulatory fears and the ICO bubble collapse, while the 2018–2022 bear market was exacerbated by crypto-specific events (Terra/Luna, FTX).
Current Cycle: November 21, 2022 – Present (July 23, 2025)
Bear Market Low: November 21, 2022, $15,476
Halving Date: April 19, 2024 (block reward reduced from 6.25 to 3.125 BTC)
Current Price (July 22, 2025): $119,556.82
Market Cycle Peak: January 2025, ~$112,000 (based on X post sentiment, not definitive)
Durations (As of July 23, 2025)
Bear Market Low to Halving: 514 days (November 21, 2022 – April 19, 2024)
Halving to Current Date: 460 days (April 19, 2024 – July 23, 2025)
Overall Duration to Date: 974 days (November 21, 2022 – July 23, 2025)
Peak to Current Date: ~190 days (January 2025 – July 23, 2025, assuming peak at ~$112,000)
Price Movements (As of July 23, 2025)
Percentage Gain (Bear Market Low to Current Price): ($119,556.82 - $15,476) / $15,476 = 672.58%
Percentage Gain (Bear Market Low to Assumed Peak): ($112,000 - $15,476) / $15,476 = 623.83% (based on ~$112,000 ATH in January 2025)
Percentage Change (Assumed Peak to Current Price): ($119,556.82 - $112,000) / $112,000 = +6.75% (indicating no bear market low yet)
Price Corrections Exceeding 20% (November 2022 – July 2025)
June–August 2023: ~25% correction (from ~$31,000 to ~$23,000)
April–July 2024: ~30% correction (from ~$73,000 to ~$50,000, post-halving dip)
February–April 2025: ~20% correction (from ~$112,000 to ~$90,000, based on X sentiment)
Similarities with Previous Cycles
Duration to Halving: The 514-day period from the bear market low to the halving aligns closely with the 513–542 days in previous cycles.
Post-Halving Bullish Momentum: Like the 2016 and 2020 halvings, the April 2024 halving preceded a significant price increase, with Bitcoin reaching ~$112,000 by January 2025 (a ~623% gain from the low).
Multiple Corrections: The current cycle has seen at least 3 corrections exceeding 20%, consistent with the 5–6 corrections in prior cycles.
Liquidity Correlation: The current cycle’s bull run aligns with global liquidity expansion (e.g., M2 growth from $102T to $107T by February 2025), similar to the 2016–2017 and 2020–2021 bull markets.
Differences from Previous Cycles
Lower Percentage Gain: The current cycle’s gain (623.83% to assumed peak) is lower than the 2015–2018 cycle (11,018.09%) and 2018–2022 cycle (2,064.22%), reflecting Bitcoin’s maturing market and higher starting price.
Influence of ETFs: The launch of U.S. spot Bitcoin ETFs in January 2024 bolstered demand, a new factor not present in prior cycles.
Supply Shocks: The release of long-dormant coins (e.g., Mt. Gox repayments, government seizures) in 2024 caused temporary oversold conditions, unique to this cycle.
Global Liquidity and Macroeconomic Analysis
U.S. M1 and M2 Money Supply Trends
M1 Money Supply (cash, checking deposits): M1 surged during the COVID-19 stimulus in 2020, peaking at ~$20T in 2021, but has since stabilized at ~$18T by mid-2025 due to tighter monetary policy.
M2 Money Supply (M1 + savings deposits, money market accounts): Global M2 grew from $102T to $107T between January and February 2025 (3.8% increase), signaling renewed liquidity expansion. U.S. M2 specifically has shown slower growth since 2022, correlating with Bitcoin’s bear market bottom, but recent upticks align with Bitcoin’s rally to $119,556.82.
Historical Correlation: Bitcoin’s bull markets (2016–2017, 2020–2021) coincided with rapid M2 growth, while bear markets (2018, 2022) aligned with M2 contractions. The current cycle’s rally since 2023 mirrors rising M2 year-on-year growth.
U.S. Money Printing and Interest Rates
Money Printing: Quantitative easing (QE) during 2020–2021 (e.g., $4T in U.S. stimulus) fueled Bitcoin’s 2020–2021 bull run. Since 2022, the Federal Reserve shifted to quantitative tightening (QT), reducing liquidity, but recent expectations of rate cuts in 2025 have spurred M2 growth and Bitcoin’s price recovery.
U.S. Interest Rates: The Federal Reserve raised rates from 0% to ~5.5% between 2022–2023 to combat inflation, correlating with Bitcoin’s 2022 bear market. Speculation of rate cuts in mid-2025 (potentially to 3–4%) has boosted risk assets, including Bitcoin, as lower rates increase liquidity and investor risk appetite.
Correlation: Bitcoin has a ~0.94 long-term correlation with global liquidity (M2), with a 56–60 day lag between liquidity increases and price rises. Higher interest rates suppress Bitcoin’s price by reducing liquidity, while anticipated rate cuts in 2025 are driving bullish sentiment.
Stablecoin Liquidity
Stablecoin supply (e.g., USDT, USDC) is a crypto-native liquidity metric with a stronger short-term correlation to Bitcoin’s price than M2. Positive 28-day changes in stablecoin supply often signal accumulation phases, while sharp declines align with local tops. Current stablecoin supply growth supports Bitcoin’s upward trajectory in 2025.
Prediction for Current Cycle Peak
Historical patterns suggest Bitcoin peaks ~1,060–1,070 days from the bear market low (35 months), or ~12–18 months post-halving. Based on:
Cycle Low: November 21, 2022
Historical Peak Timing: 1,060–1,070 days (October–November 2025)
Post-Halving Timing: 12–18 months from April 19, 2024 (April–October 2025)
Current Trajectory: Bitcoin’s price at $119,556.82 (974 days from low) and MVRV Z-Score <1 suggest further upside potential.
Speculative Peak Prediction: Bitcoin may peak between late Q3 and early Q4 2025 (September–November 2025), potentially reaching $150,000–$320,000, based on historical MVRV ratios (peak MVRV ~8) and liquidity trends. Risks include global recession, equity market corrections, or regulatory shocks.
Additional Pertinent Data
MVRV Z-Score: Currently <1, indicating undervaluation and room for growth compared to historical peaks (MVRV >3).
Net Unrealized Profit and Loss (NUPL): The current cycle is in the “Belief” stage, transitioning toward “Euphoria,” consistent with prior bull runs.
Exchange Reserves: Declining Bitcoin reserves on exchanges (e.g., CryptoQuant data) indicate HODLing, reducing available supply and supporting price increases.
Google Search Trends: Interest in “Bitcoin” and “crypto” peaked in prior cycles (2017, 2021) during bull runs. Current search volume is rising but below 2021 levels, suggesting the cycle may not yet be at its peak.
Correlation with Risk Assets: Bitcoin’s correlation with the S&P 500 and Nasdaq reached 0.73–0.76 in April 2025, reflecting its sensitivity to broader market sentiment.
Conclusion
The 2015–2018 and 2018–2022 cycles share structural similarities (4-year duration, halving-driven bull runs, severe bear markets), but differ in scale and drivers. The current cycle (2022–present) mirrors past cycles in timing and liquidity correlation, with unique factors like ETFs and supply shocks. Global liquidity, particularly M2 and stablecoin supply, remains a key driver, amplified by anticipated U.S. rate cuts in 2025. Bitcoin’s current price ($119,556.82) and metrics suggest a peak in September–November 2025, potentially at $150,000–$320,000, though external risks could alter this trajectory. Investors should monitor MVRV, NUPL, and liquidity trends for intra-cycle positioning.
As you can see this is a much more comprehensive analysis of the Bitcoin 4-year market cycle than my previous analysis. That being said the end result, at least when it comes to elapsed time similarities was about the same. It's obvious that for whatever reason the past two market cycles are amazingly similar in elapsed time. Moving forward it will be very interesting to watch as the rest of this current market cycle plays out. The major questions yet to be answered include. When will the market cycle peak occur? What will be the peak price? What will be the price of the next bear market low?
Looking at the price chart, especially when you view a line chart it is obvious that as Bitcoin ages as an asset, price volatility diminishes. Will this continue? Only time will tell. One thing that is undeniable is this has been an exciting and at times a frustrating market cycle. However, whether it is exciting or frustrating I am very thankful to be involved in it. I realize that this is a fairly long read so if you have made it this far, thank you! I really appreciate everyone who takes the time to read my ideas. Stay safe and get ready for a wild ride over the next five to six months.
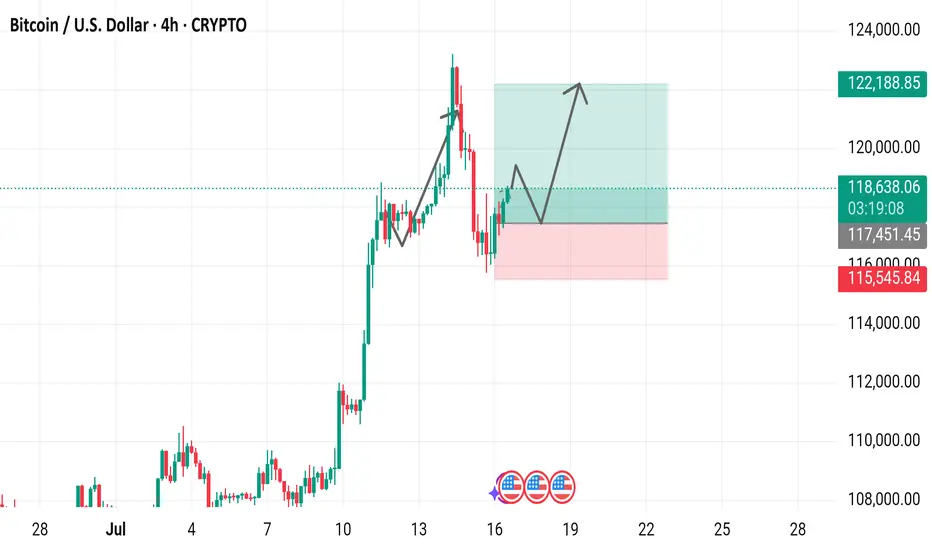
Bitcoin / U.S. Dollar 4-Hour Chart (July 2025)4-hour price movement of Bitcoin (BTC) against the U.S. Dollar (USD). The price has risen from 118,714.64 to 118,714.64 (+937.9 or +0.80%) over the period. Key levels include a support zone around 115,451.45 to 117,451.45 and a resistance zone near 120,000.00 to 122,188.85,
BTC-----Sell around 118100, target 116500 areaTechnical analysis of BTC contract on July 22:
Today, the large-cycle daily level closed with a small positive cross yesterday, and the price was below the moving average. The attached indicator was dead cross. The general trend is currently biased towards a downward trend. From the overall trend, we can see that the current trend is consistent and strong, but there is no room for rebound, and the continuous sluggish trend is also quite obvious, so the idea of selling down in the future market has become the main idea; the short-cycle hourly chart showed that the US market fell and rebounded yesterday, and the pressure continued to fall and broke down in the morning, and the correction high was near the 118000 area. The current K-line pattern is a single positive line. According to the trend rule, if the decline continues today, the rebound strength cannot be large, and the high point of the US market correction is resistance.
Today's BTC short-term contract trading strategy:
Sell at the current price of 118100, stop loss at 118500, and target 116500;

BTC-----Sell around 118300, target 116000 areaTechnical analysis of BTC contract on July 21:
Today, the large-cycle daily level closed with a small negative line yesterday, the K-line pattern continued to fall, the price was below the moving average, and the fast and slow lines of the attached indicator showed signs of a dead cross, and the overall trend has been in a sluggish state recently. The trend in the big trend also showed obvious signs of falling, so we have to pay attention to the strength and continuation of the retracement next; the short-cycle hourly chart price fell under pressure in the early morning, and the current K-line pattern continued to fall, the price was below the moving average, and the attached indicator was dead cross, so the price fell to the previous low of 115700 area. So you can sell after the pullback during the day, and pay attention to the breakout and strength and weakness trend of the European session.
Today's BTC short-term contract trading strategy:
Sell in the 118300 area, stop loss in the 118600 area, and target the 116000 area;

Bitcoin Trading Update: Consolidation, Patterns, and What's NextHey Fellow Traders! 👋
Bitcoin (BTC) has been on a wild ride after hitting its all-time high (ATH)! 📈 Since then, it’s been consolidating, generating liquidity, and setting the stage for the next big move. Meanwhile, altcoins are absolutely booming, stealing the spotlight! 💥 As we kick off the week, let’s dive into what’s happening with BTC and what to watch for.
📊 Technical Analysis Breakdown
Here’s what I’m seeing on the charts:
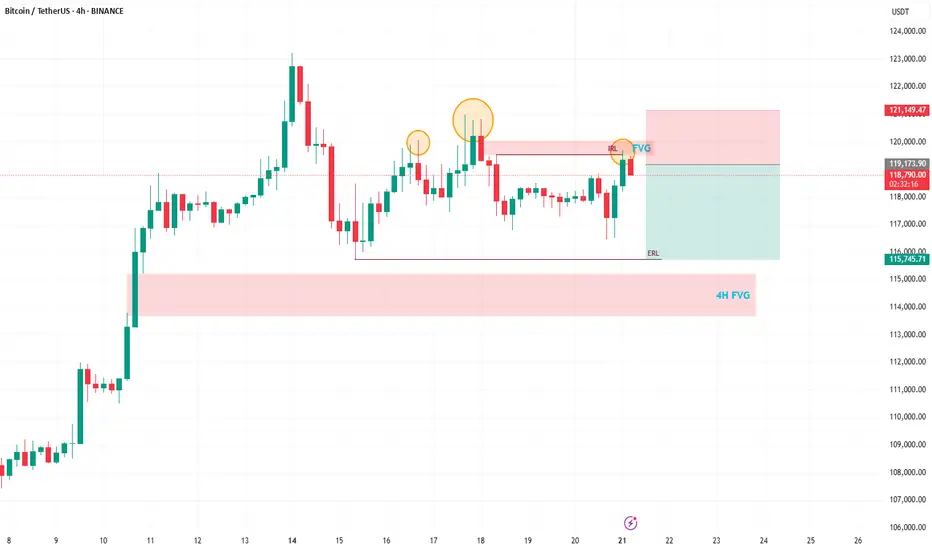
Head and Shoulders Pattern: A clear head and shoulders has formed on BTC, signaling a potential bearish move. 🐻
Daily Timeframe Order Blocks: These are in play, showing key levels of support and resistance.
Filled Fair Value Gap (FVG): A recent FVG on the daily chart has been filled, but there’s still a beautiful 4H FVG waiting to be tested below.
Liquidity Sweep: After the ATH, BTC needs to clear the liquidity from the past few days before it can push for new highs.
🔍 What’s Next for BTC?
I’m expecting a bearish reaction in the near term, with BTC targeting the sell-side liquidity around $115,800. This move should also fill the 4H FVG, setting the stage for a potential bounce and another shot at the ATH. 🚪 Keep an eye on these levels, as they’ll be critical for the next big move!
🔔 Stay in the Loop!
Let’s keep the conversation going! 💬 Follow for more updates, like if you found this helpful, and drop a comment with your thoughts or what you’re seeing in the markets. Are you trading BTC or riding the altcoin wave? Let’s hear it! 👇
Happy trading, and let’s make this week count! 💪
#Crypto #Bitcoin #Trading #TechnicalAnalysis
LAST BTC PUSH? Dear Community,
in order to expand my skills analysis, I will regularly share my analyses and ideas here on TradingView. I still consider myself a beginner in the “stock market” and “crypto” area and am therefore very much looking forward to your comments and input!
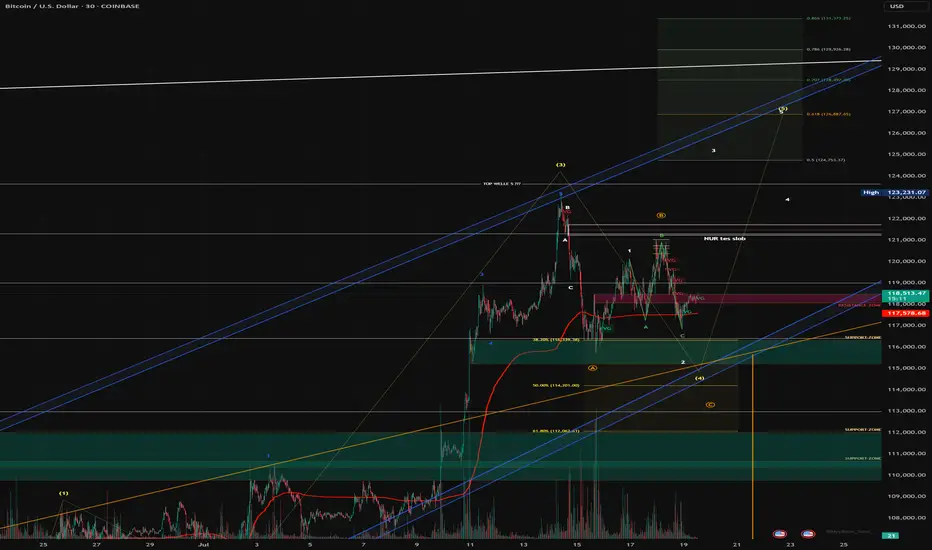
My primary assumption is that we are still in a final upward move. However, I am also pursuing alternative scenarios that could lead to significantly higher levels.
BTC analysis - 1H chart
In my analysis, wave (3) in yellow is complete and we are currently in wave (4) correction, which may not be complete yet.
My guess:
- Wave B (yellow) has been completed, wave C has extended and could still reach USD 113 679, where the Fibonacci 100 level is located. There is also an FVG in the 1H chart.
- A retest of the blue trend channel would be quite possible in order to pick up liquidity at this level before wave 5 (yellow) is completed between USD 126,887 and USD 130,000.
- My risk management is down to USD 107,326 (Fibonacci 1.866).
- We have already tested the Fibonacci 0.5 level (pullback level) and seen a positive reaction. However, we currently lack volume in the market.
- If the blue channel and the Fibonacci 100% level break, I have to assume an alternative count.
In this case, wave 4 would still have scope to reach the Fibonacci 61.8% level in the yellow box at USD 112,062.
If my current forecast does not materialize, I assume that we have already completed wave A and are in the correction to wave B, which will be followed by wave C - with a target of around USD 130,000 for the final impulse.
This scenario also fits in well with risk management up to the Fibonacci level of 1.866. There are also high liquidity areas (long) at this level, which are very attractive for market makers.
What do you think?
BTC 1H – Make or Break at SupportBitcoin has retraced into a previous demand zone after rejecting from local resistance. The 1H Stoch RSI is fully oversold, hinting at a potential bounce — but a clean break below $116K could send us down to the next base around $111K. Eyes on reaction here.

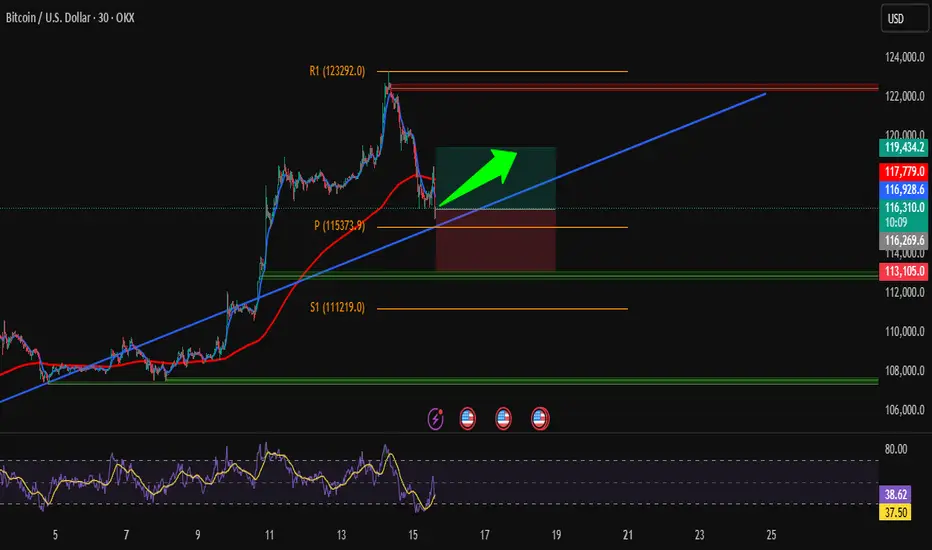
Clean BTC Trade – Bounce from Key Trendline SupportHi traders! , Analyzing BTC/USD on the 30-minute timeframe, we can observe that price is respecting the ascending channel and reacting to the dynamic trendline support (blue line). This bounce, aligned with prior structure, signals a potential bullish continuation.
🔹 Entry: 116,249
🔹 Take Profit (TP): 119,434
🔹 Stop Loss (SL): 113,105
Price remains above the 200 EMA while continuing to respect the ascending trendline, signaling sustained bullish structure. The RSI is showing a bullish divergence, which supports the idea of upward momentum. We also saw a strong reaction at the pivot point (115,373), and a bullish engulfing candle formed right near the trendline — adding further confirmation to this potential long setup.
This long setup presents a favorable risk/reward ratio within the context of the broader trend. Targeting a clean break above previous resistance and return to the R1 zone.
⚠️ DISCLAIMER: This is not financial advice. Trade at your own risk and always use proper risk management
BTC Analysis — Long-Term Buy Zone AheadI'm watching $111,000 as a major buy zone on Bitcoin.
If price retraces to that level, I’ll be ready to enter a long position.
This is not a prediction — it’s a scenario.
Smart traders don’t guess, they prepare.
Let price come to your level. No chasing.
📍Set your alerts and stay patient.

BTCUSDTWait for breaked ATH for 115K target.
BINANCE:BTCUSDT.P
Now price is in two level trading renge but come entry volume of buyers.

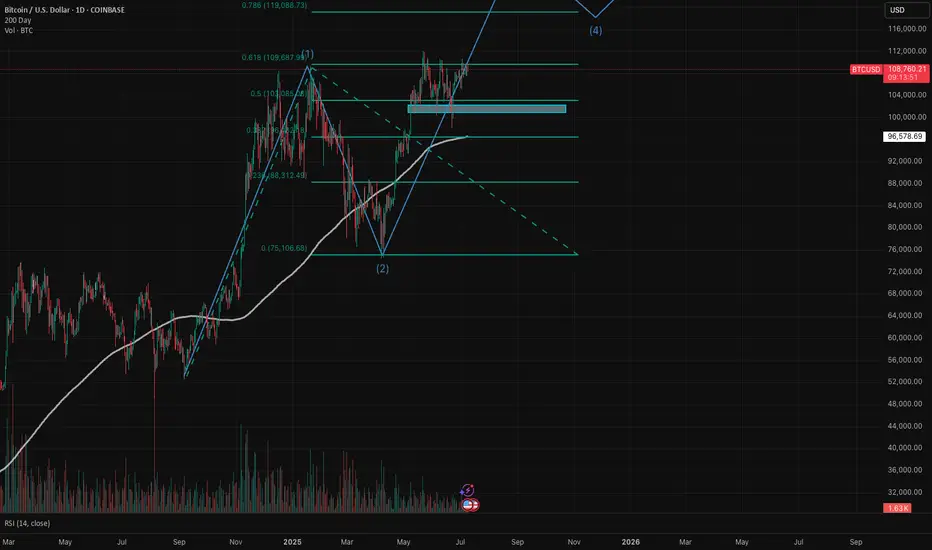
Bitcoin (BTC/USD) is currently in wave 3 of a 5 (Elliott Wave)BTC/USD experienced a halving last year on April 20, 2024. We have been seeing the typical post-halving cycle with exponential upside, followed by deep pullbacks. The price action we've seen to date follow Elliott Wave Cycle quite nicely. I believe we are in wave 3 of a bull cycle that has really been in place since Sep 2024.
- Wave 1: Sep 2024 - Jan 2025 - parabolic upside from $54K to $109K - absolutely explosive!
- Wave 2: Jan 2025 - Apr 2025 - we saw price peak and pull back all the way to the 61.8% Fibonacci level right around $75K. Remember, that in wave 2, a healthy pullback is 50% - 61.8% of the first wave.
- Wave 3: Apr 2025 - we have since rallied to around $109K as of this analysis. We are likely in subwave 3. Subwave 1 was from the low in April to the high in May (around $112K). Subwave 2 was a very nice 3-wave zig zag (reaching low of $98.3K in June). I believe we are currently in the middle of wave 3.
My next price target based on Fibonacci extension is $118K-$120K with the $78.6% level right at $119K. Note current resistance that we need to turn into support ($109.7K level) is the 61.8% Fibonacci extension level. I do expect a meaningful pullback after the peak of wave 3, which would be wave 4. The rest is TBD and I will continue to update this idea.
Remember, Elliott Wave theory is one tool in the toolbox. I do believe there is a larger post-halving cycle narrative that is dominant and most reliable, especially since BTC has largely followed this blueprint that we see every four years, but as of now EWT fits in quite nicely. I also look at the pi cycle top indicator and believe we need to use multiple indicators to understand where we are in the cycle.
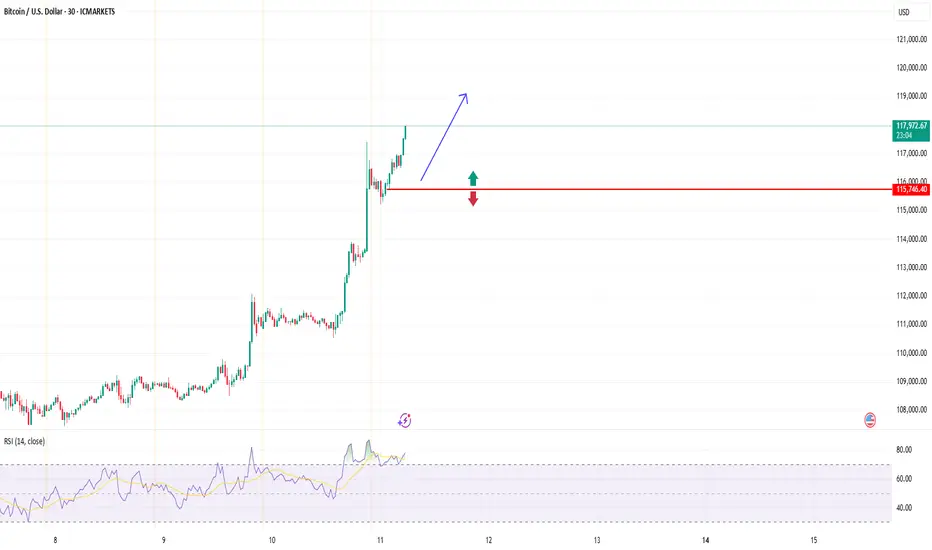
BTCUSD (Bitcoin): Forex Technical AnalysisDate: 11 July 2025
Momentum: Up
First Scenario : long positions above 115,706.14 with targets at 117,269.52, 117,904.51 and 118,513.05
Second Scenario : short positions below 115,706.14 with targets at 114,544.35, 113,774.89 and 113,053.39
Comment: RSI - Bullish.
Supports and resistances :
118,513.05 **
117,904.51 *
117,269.52
116,747.25 - Last price
114,544.35
113,774.89 *
113,053.39 **
BTC Leg2 115KBINANCE:BTCUSDT major movement from base 98K S to 106K $.BTC want to next movement to 115K $ but in middle of way 110K $ level there are sellers.
Support: 106.000 - 102.000
Resistance: 110.400 - 115.000
⚠️Control Risk Management

BTC Correction's 📉 Significant Bitcoin Correction During Uptrend
After a strong bullish rally, Bitcoin has entered a correction phase, retracing nearly 25% of its recent gains. Interestingly, this correction aligns exactly with the 200-period moving average on the 4-hour chart, marking a potential key support level.
🔍 Is Bitcoin’s Correction Over or Just Beginning?
The overlap with the 200 MA could signal the end of the correction, but if this zone fails to hold, deeper targets between the 35% and 75% retracement levels may come into play.
🛡️ Potential Support Levels for Bitcoin if the Correction Continues:
First support: 102,200 USD – 25% correction
Second support: 93,200 USD – 35% correction
Third support: 84,100 USD – 50% correction
Fourth support: 74,600 USD – 75% correction

Bitcoin on Fire: Targeting $110K in Relentless Uptrend!Hi traders! , Analyzing BTC/USD on the 30 minute timeframe, price is currently respecting an upward channel and showing consistent higher highs and higher lows. The recent bounce from dynamic support suggests bullish continuation.
🔹 Entry: 109,545
🔹 Take Profit (TP): 110,612
🔹 Stop Loss (SL): 108,438
Price is trading above both the 50 and 200 EMA, confirming bullish momentum. The RSI remains above the midline, indicating buyers are still in control. This long setup offers a favorable risk-reward ratio within the context of the broader uptrend.
A confirmed breakout from the short-term resistance, combined with trendline support and channel structure, adds confluence to this idea. Watch for potential resistance near the 110,612 zone.
⚠️ DISCLAIMER: This is not financial advice. Every trader is responsible for their own decisions and risk management.

BTCUSDT – Accumulation Confirmed? Wyckoff Blueprint Playing Out Bitcoin continues to compress inside a defined range, resting above both a rising trendline and a former resistance turned support zone. This structure fits cleanly within a Wyckoff-style Accumulation Phase (B-C).
We’re now at a critical moment where smart money may be absorbing supply, preparing for the next phase.
🔍 Key Observations:
Range-bound price action with higher lows and muted volume
Spring-like wick and recovery from the bottom of the range
Support holding at prior breakout zone and ascending trendline
Structure shows signs of stealth accumulation with a possible breakout ahead
Sideways movement with fading volatility
Gradual compression within the range
Strong support defended multiple times (might make the support weaker as well !)
A potential spring/retest event may already be in play
You’ll see fakeouts, wicks, and hesitation in this phase — designed to trap weak hands. But the underlying behavior points to preparation, not distribution.
The quiet before the markup. Let the market reveal its hand. 📈

BTC SCALP Tradeas long as BTC doesn't closes below the mentioned area on 1hr tf, it will bounce and hit the fresh sellers SL. Once we have a closing below the area it can take correction upto 98-97K area.

BTC shorting opportunity comes againBTC climbed above 108000 again, and the short-term bullish power was slightly stronger. According to the current strength, BTC still has room for growth, but it is still under pressure in the 109000-110000 area in the short term; if there is no major positive news, BTC may find it difficult to break through the resistance area in the short term under the current conditions, and may even experience stagflation and retreat again after approaching the resistance area.
Therefore, I think shorting BTC with the help of the resistance area is still the first choice for short-term trading. We can boldly short BTC in the 108500-109500 area and look towards the target area around 106000 again.

BTCUSD Trade Setup Idea on 1D Timeframe - Bullish MomentumBitcoin (BTCUSD) is currently trading at $109,348, showing strong bullish momentum on the 1H chart. The recent breakout from consolidation signals potential continuation, provided key resistance levels are breached and held.
Must Consider Analysis Timeframe : 1Day.
Strictly follow the trading rules for Entry..... only on Retracement.
SL on Previous or Close swing low.
🔍 Key Levels to Watch:
Bullish Continuation Confirmation: If price sustains above 112,150, we expect bullish momentum to accelerate.
Target 1 (TP1): 112,150 – Key breakout level that may act as support once reclaimed.
Target 2 (TP2 - Major): 121,128 – Long-term resistance and major profit-taking zone.
📊 Trade Logic:
A confirmed breakout and hold above 112,150 indicates strong buyer interest and could drive price toward 116,572 and 121,128.
The trend remains bullish as long as price holds above the breakout structure.
REMEMBER:- RESPECT THE LEVELS, LELEVLS RESPECT YOU THEN.
💡 Strategy: Monitor for retests and bullish candle confirmations above 112,150 to add or enter long positions with proper risk management.
! Disclaimer & Important Note:
This analysis is for educational and informational purposes only. It does not constitute financial advice or a recommendation to buy or sell any financial instrument. All trading involves risk. We are not responsible for any kind of loss incurred, whether financial, emotional, or otherwise. Always do your own research and consult with a licensed financial advisor before making any trading decisions.
Trading involves significant risk, and you should never invest more than you can afford to lose. Past performance is not indicative of future results.
The trade idea shared above reflects personal market interpretation and is subject to change based on new market conditions.
Posted by: THEPATELCRYPTO, 45Degree
Stay safe. Trade smart.
Follow for more ideas!
📍Posted by: THEPATELCRYPTO, 45Degree
📈 Stay safe. Trade smart.
🔔 Follow for more ideas!

Short BTC, it is about to retrace and test 100000 again!As BTC gradually fell back, the rebound did not stand above 110,000 in the short term, proving that there is strong selling pressure above, and the trend line formed by the technical high point 111,000 and the second high point 110,000 formed an important resistance area, which limited the rebound space of BTC and strengthened the demand for BTC's short-term retracement.
According to the current trend, the short-term oscillation bottom area of 106,000 may be broken at any time. Once it falls below the oscillation area, it may arouse a certain degree of profit-taking chips and stimulate BTC to accelerate its decline. I think BTC will at least test the 105,000-104,000 area again during the retracement, and may even test the 100,000 integer mark again.
Therefore, shorting BTC is still the preferred option for current short-term trading.
Consider shorting BTC in the 108,000-109,000 area, and the target area in the short term is 104,500-103,500. After breaking this area, the target can be extended to 101,000-100,000.
BINANCE:BTCUSDT BINANCE:BTCUSDT BITSTAMP:BTCUSD

BITCOIN - Price can continue grow inside flat to $107933 level#BTC
The price is moving within a descending channel on the 1-hour frame and is expected to break and continue upward.
We have a trend to stabilize above the 100 moving average once again.
We have a downtrend on the RSI indicator that supports the upward move with a breakout.
We have a support area at the lower boundary of the channel at 106500, acting as strong support from which the price can rebound.
We have a major support area in green that pushed the price upward at 106000.
Entry price: 106736
First target: 106996
Second target: 107434
Third target: 107933
To manage risk, don't forget stop loss and capital management.
When you reach the first target, save some profits and then change your stop order to an entry order.
For inquiries, please comment.
Thank you.

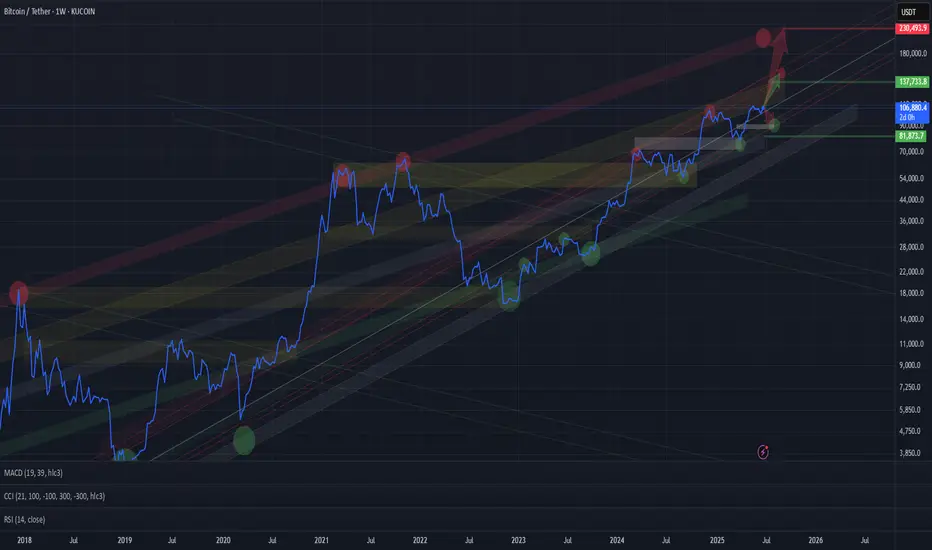
BTC BTC/USDT LONG_TERMChannels are drawn, long-term targets are clear. The upper extreme visible so far is around $200K for Bitcoin — possible within this cycle.
More realistic targets for this cycle are around $135K.
In the short term, a correction to the lower red channel zone ($88K–94K) is possible.
Watching closely.