2022 to 2026 Bitcoin Market Cycle?Obviously, I don't have a crystal ball, however, just for fun I have estimated what the timing of this current market cycle may look like. I haven't made any predictions on the chart as far as the peak price or the price of the next bottom. Although, if the trend of diminishing returns continues I would expect a peak between $80k and $90k. If that trend is broken a peak between $100k and $200k is likely.
What I have done on this chart is laid out the dates when each event may occur. I estimated the dates based off of the average elapsed times between the events from the last two market cycles. In doing this, I am making a big assumption that this market cycle will follow the timing of the last two cycles. So far this assumption appears to be correct. The estimated elapsed time from the bear market bottom on November 21st 2022 to the upcoming halving on April 18th will be 515 days. That is very close to the elapsed times from the last two cycles (542 and 513 days).
But, that doesn't mean that the elapsed times between the remaining events will closely match the past cycles. One recent event that could very possibly alter Bitcoins market cycle is the approval of 11 Bitcoin spot ETFs on January 10th 2024. Bitcoin futures ETFs have been around for seveal years but they differ from a spot ETF. A Bitcoin futures ETF holds Bitcoin futures contracts to get exposure to the price of Bitcoin. A Bitcoin spot ETF buys actual Bitcoin which is then held by a custodian in a secure digital wallet.
As we all know the amount of available Bitcoin is finite, and with the upcoming halving each block will produce half as much (3.125 per block mined). The approval of the spot Bitcoin ETFs will dramatically widen access to the world’s largest cryptocurrency for not only institutional investors but also retail investors. This additional demand for Bitcoin could very well exacerbate the already tight market supply driving up the price faster than previous cycles.
Only time will tell how this current market cycle will play out. It will be interesting to use these estimated event dates to gauge how this cycle compares to the previous cycles. If we see Bitcoin hit a new all-time high well before the estimated date it could mean that we could see a left translated cycle. However, it could also mean that the additional demand from the ETFs will drive the price of BTC to levels beyond what most analysts believe is possible.
Btctrend

BITCOIN MOVE UP OR DOWN? WHAT'S NEXTThe current Bitcoin (BTC) price stands at 51,668, and there is an attempt to surpass the resistance at 51,800. If successful, BTC is expected to climb to 52,500, with the subsequent target being 53,200. Conversely, a failure to breach the 51,800 resistance and a drop below 51,400 could trigger a sell-off. In this scenario, the first sell target is set at 50,600, followed by a potential decline to 49,000 if market conditions do not support sustained levels. It is crucial to closely observe the market for any indications of a breakout or a change in established patterns.

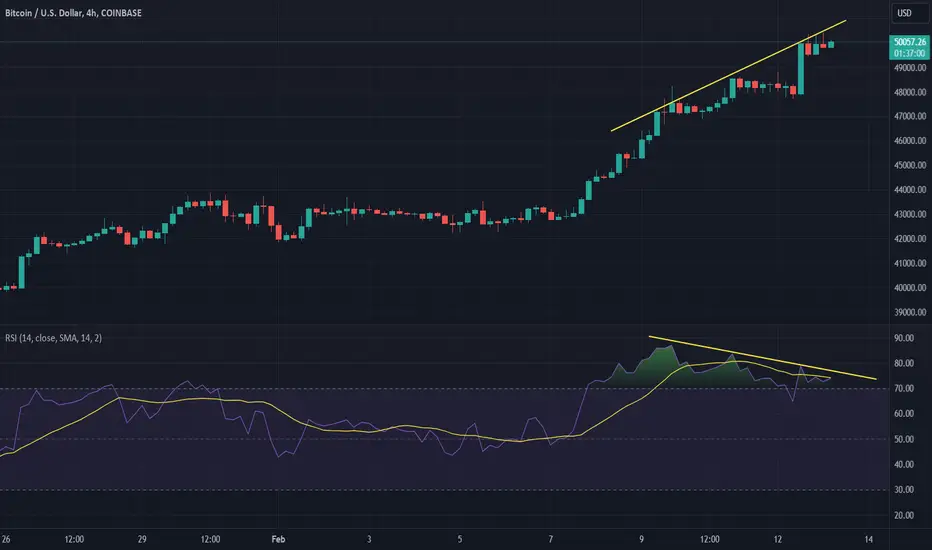
Bitcoin Weekly AnalysisAfter further analysis, this is my view.
- RSI some bearish divergence
- MACD nice and clear bounce and histogram losing steam
- OB hit with some rejection
24 hours before the close of the week, a potential Doji Candle is forming
With that said, it remains somewhat bullish IMO with the possibility of a last wave missing.

BTC / USDT Next Move CRYPTOCAP:BTC USDT Next Move ???
Bitcoin, Keep an eye on, Short term active trade.
Feeling like this kind of trigger.
GETTEX:46K to GETTEX:48K 🧲

$BTC Daily UpdateCRYPTOCAP:BTC #BTC $50,579 support in effect, last 4H close looks good, RSI on 1d and 4h also good. Could reattempt to gain $51,630 support. $52,527 test resistance test likely if pennant plays out on short term, continue watching S/R.

BTC BITCOIN Technical Analysis & Trade IdeaBitcoin (BTC) has enjoyed a robust bullish run, but recent price action on the four-hour 4H chart indicates potential weakness. Since February 13th, BTC has entered a sideways consolidation phase. I'm anticipating a sell opportunity should we observe a decisive break below the current range low, followed by a retest and failure of that level. Potential targets for this trade would align with prior swing lows.
It's imperative to emphasize that trading carries inherent risk. Before executing any trades, it's vital to conduct your own extensive research. Consider both fundamental market drivers and global macroeconomic conditions alongside your technical analysis. Always implement sound risk management practices to safeguard your investment.
Disclaimer: This analysis presents a technical viewpoint on Bitcoin. It should not be interpreted as investment advice. Base your trading decisions on your own risk profile, comprehensive market research, and a thorough assessment of all relevant variables.

Market structure Shift? OR Fakeout?!It seems like we MAY have have seen a market shift “signal” in #BTC with the W formation with a HL AND ON TO ITS SECOND “wave”
If we break this zone to the topside I will look for longs.
If we break to the downside it’s possible we’re seeing the second wave down in our identified bearish trend (short term) and validates our current short positions.
The 50 EMA is going to be a good point of interest for me to decide to close my shorts and protect profits. Only Until we see some more confluence for a probable trade, I don’t like to “gamble”
Always protect your profits fam
I’m currently still in short positions

$BTC Daily UpdateCRYPTOCAP:BTC #BTC ranging $52,527-$50,579, RSI looks good on 4h, RSI on 1d still in overbought region, last 1D closed good with bullish pin bar, given resistance $52,527 remains strong, key support at $50,579, current support range $51,185-$51,630.

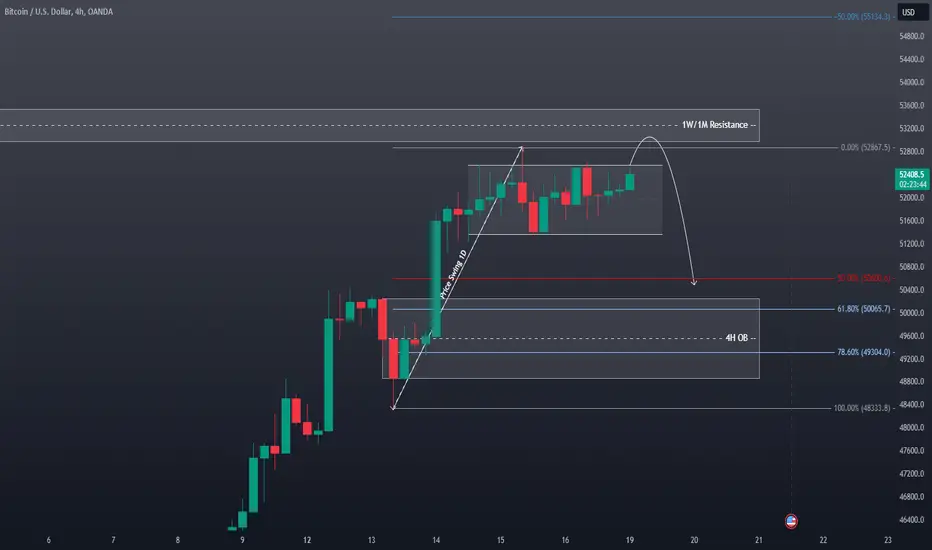
BTC BITCOIN Technical Analysis and Trade Idea (video)This is a full video explanation of my previous post. #BTC has encountered substantial resistance at both weekly and monthly (1W/1M) timeframes.
The 4-hour (4H) chart reveals sideways price action and a formation of a lower high, indicating potential bearish pressure. Expect a retracement targeting the 61.8% - 78.6% Fibonacci zone, derived from a significant daily swing low to swing high.
Trade Suggestion:
- Monitor for signs of a bearish shift in the trend on the lower time frame to confirm the retracement.
- Consider short positions upon breakdown from the current range, targeting the Fibonacci zone.
- Stop-Loss: Implement a carefully calculated stop-loss above the recent swing high to manage risk effectively.
Disclaimer:
This analysis is offered for educational purposes only and should not be interpreted as direct financial advice. Always conduct your own thorough research and implement sound risk management practices before initiating any trades.

BTC BITCOIN Technical Analysis and Trade Idea#BTC has encountered substantial resistance at both weekly and monthly (1W/1M) timeframes.
The 4-hour (4H) chart reveals sideways price action and a formation of a lower high, indicating potential bearish pressure. Expect a retracement targeting the 61.8% - 78.6% Fibonacci zone, derived from a significant daily swing low to swing high.
Trade Suggestion:
- Monitor for signs of a bearish shift in the trend on the lower time frame to confirm the retracement.
- Consider short positions upon breakdown from the current range, targeting the Fibonacci zone.
- Stop-Loss: Implement a carefully calculated stop-loss above the recent swing high to manage risk effectively.
Disclaimer:
This analysis is offered for educational purposes only and should not be interpreted as direct financial advice. Always conduct your own thorough research and implement sound risk management practices before initiating any trades.
$BTC Daily UpdateCRYPTOCAP:BTC #BTC Given key resistance area at $52,527 holding strong, $51,630-$50,579 current support range, RSI on 4H looking good, previous 1D close looks fine with RSI still in overbought region, Watch given S/R

Expired BTC.USD Weekly outlook. 2nd WK FEB 2024Expired BTC.USD Weekly outlook. 2nd WK FEB 2024
> BULLISH 📈 CORRECT
Closed Price: 47,157
Target Price: 47,893 | Strike Price: 52,648 FEB15 24'
Upper Range: 52,100
Lower Range: 43,686

Possible scenario Bitcoin BTC price movement for February 2024In February, trading in the BTCUSDT pair started at around $42,000.
This value is approximately in the middle of the trading corridor with critical limits of $39000-39500 and $44250-44750
If you look at the left corner of the chart, you will see a table that shows that statistically, February is "green" for the BTC price
Only February 2020 "subtly hinted" at how tough March 2020 will be. Those who survived this period with their deposits definitely got goosebumps at the mere mention of it...)
And yet, it was exactly 4 years ago, before the previous "BTC halving"
We have depicted the approximate possible movement of the BTCUSDT price for February on the chart. Particular attention and important trading decisions will need to be made when the Bitcoin price is near the critical limits of $39000-39500 and $44250-44750
What is your bet? Will February be green or red? Where will the BTCUSD price go to 52000 or 32000?
Write everything in the comments!

BTC BITCOIN Technical Analysis and Trade IdeaMarket Observations: BTC/Bitcoin has experienced a remarkable bullish surge. However, the monthly timeframe indicates potential overextension. Moreover, recent price action pushing into previous highs on both the monthly and weekly charts suggests a possible retracement towards the 50-61.8% Fibonacci zone. This area typically attracts increased liquidity, potentially encouraging long positions from institutional investors.
Trading Considerations:
Counter-Trend Short: Explore a short entry near the current price level, strategically placing a stop-loss above the recent highs. Maintain a 1:1 risk-reward ratio for this trade.
Fibonacci Buy: Target a potential buy opportunity close to the 61.8% Fibonacci retracement level. This aligns with the possible accumulation of long positions by larger market players. Utilize a stop-loss below the recent swing low, and define target levels as shown on the screenshot.
Disclaimer: This analysis offers my personal market interpretation for educational purposes and should not be considered direct financial advice. Always prioritize your own independent research and thorough risk assessment before making any trading decisions.

$BTC Daily UpdateCRYPTOCAP:BTC #BTC Followed thru on bullish pin bar - Given resistance came in effect at $51,630 and built support over it beautifully, same support in effect currently, $52,527 resistance testing, RSI on 1D and 4H in overbought region, next resistance areas $52,932, $53,672, $54,129, $54,772, and $55,901.

$BTC Daily updateCRYPTOCAP:BTC #BTC Called it almost 6 hours before, bearish divergence played out on 4H and given support at $48,644 came in effect, $49,734 resistance testing as of now, RSI back below overbought thanks to the correction here and managed to keep the progress nicely, Bullish pin bar on previous daily close if followed thru next S/R area expected at $50,579 / $51,630, some resistance at $52,932-$53,672.

BITCOIN $BTCUSD - Nov. 20th, 2023BUY/LONG ZONE (GREEN): $35550 - $49240
DO NOT TRADE/DNT ZONE (WHITE): $30320 - $35550
No sell/short zone shown.
The market has a clear bullish sentiment and I would not look to enter shorts here. I've drawn the levels and zones (from the daily and weekly frames) that I would look towards when entering. Price reaction to these areas would be significant in determining the trend. Recently BTC has shown strong bullish momentum in respect to the most recent level/zone break. The current test on the next level is the third one in less than two weeks. Although there is resistance to the level, there have been no large structural breakdowns and entering into the third test we see support on the 4H level combined with an ascending triangle.
This is what I would personally look at before entering trades, everything is subject to change on a daily basis and as I analyze different timeframes and ideas.
ENTERTAINMENT PURPOSES ONLY, NOT FINANCIAL ADVICE!

$BTC Bearish Divergence CRYPTOCAP:BTC #BTC Possible bearish divergence forming on 4h, If played out Key support areas from here to watch will be $48,644, $47,786, $47,232, $46,623 & $45,622. RSI on 1d looks fine so if this bearish divergence plays out it could be for short term.
$BTC Daily UpdateCRYPTOCAP:BTC #BTC look at that! Given resistance at $50,089 in effect, testing here since over 12 hours now, $49,374 current support, next S/R area $50,579 / $51,630, some resistance at $52,932-$53,672 - $53,672 was a major key support in last rally.

THE SECOND SETUP BTC IS SHORTon fibbonacci levels i see a dump maybe this happen on this level maybe on next level at orange area. i will try take this short

Are you ready to Short Bitcoin Yet? {11/02/2024}Educational Analysis says BITCOIN BTCUSD may go short selling for some time according to my technical.
Broker - Bitstamp
This is not an entry signal. I have no concerns with your profit and loss from this analysis.
Because from past week bitcoin has just pumping up to collect Sell Stop hunt from retail traders.
I think it's high time for bitcoin to go short!.
Let's see what this pair brings to the table in the future for us.
Please check the Comment section on how it turned out for this trade.
I HAVE NO CONCERNS WITH YOUR PROFIT OR LOSS,
Happy Trading, Fx Dollars.

BTC BITCOIN Technical Analysis and Trade Idea#Bitcoin Technical Analysis
⚫ Key Market Observation: Bitcoin #BTC has reached a significant resistance level on the monthly timeframe. Historical price action demonstrates consistent rejection at this level.
⚫ Anticipated Market Behavior: Given BTC's overextended state and recent strong bullish momentum, a retracement is likely.
⚫ Optimal Entry Strategy: Target a potential buy entry near the 61.8% Fibonacci retracement level.
⚫ Trade Setup: Seek a daily timeframe price swing aligning with the 61.8% Fibonacci retracement. Place a stop-loss order below the previous swing low.
⚫ Risk Management: Maintain a minimum risk-reward ratio of 1:2.
Important Disclaimer: This analysis is intended for educational purposes and does not constitute financial advice.

$BTC Daily updateCRYPTOCAP:BTC #BTC Given key resistance $47,232 testing, $47,232-$47,786 the tough spot, previous daily close looks good, RSI pumped up on 4h expect some sideways movement with support at $46,623, next key resistances $49,374 & $50,089.
