BTCUSDT – Accumulation Confirmed? Wyckoff Blueprint Playing Out Bitcoin continues to compress inside a defined range, resting above both a rising trendline and a former resistance turned support zone. This structure fits cleanly within a Wyckoff-style Accumulation Phase (B-C).
We’re now at a critical moment where smart money may be absorbing supply, preparing for the next phase.
🔍 Key Observations:
Range-bound price action with higher lows and muted volume
Spring-like wick and recovery from the bottom of the range
Support holding at prior breakout zone and ascending trendline
Structure shows signs of stealth accumulation with a possible breakout ahead
Sideways movement with fading volatility
Gradual compression within the range
Strong support defended multiple times (might make the support weaker as well !)
A potential spring/retest event may already be in play
You’ll see fakeouts, wicks, and hesitation in this phase — designed to trap weak hands. But the underlying behavior points to preparation, not distribution.
The quiet before the markup. Let the market reveal its hand. 📈
Btcudst

BTC Scalp Long / Buy SetupWait for the entry first, BTC must sweep the liquidation levels below side first then it should start pumping towards the tp, if it takes 2nd tp first then trade is not valid, if it takes first tp and then come back at entry level trade is still valid. if 4hr candle closing below the Bullish OB then close the position otherwise wick doesn't matter.

Long positions have achieved profits, BTC market outlook📰 News information:
1. Pay attention to the trend of gold and US bonds
📈 Technical Analysis:
At present, BTC has rebounded and profited, and rebounded to around 108,000 again. 109,000 is also the upper track of the Bollinger Band. There is a certain suppression in the short term. Before the suppression fails to break through effectively, BTC may still fall into a weak and volatile market. If BTC hits resistance and pressure above 108,000-109,000 during the day, you can consider shorting. In view of the current volatile market, everyone must strictly control their positions, use leverage prudently, and do a good job of risk management to cope with market uncertainties.
🎯 Trading Points:
SELL 108,000-109,000
TP 107,000-106,000-105,000
In addition to investment, life also includes poetry, distant places, and Allen. Facing the market is actually facing yourself, correcting your shortcomings, confronting your mistakes, and strictly disciplining yourself. I hope my analysis can help you🌐.
TVC:GOLD OANDA:XAUUSD FX:XAUUSD FOREXCOM:XAUUSD PEPPERSTONE:XAUUSD FXOPEN:XAUUSD

BTC 93k first or 120-124k end july, both possiblehere is my vieuw of Bitcoin for the next next 2-3 months,
i think btc can hit 93k before going to 120k+ but if market remains bullisch structure we might hit first 120-124k before going lower to 93,
its very possible we test 93k first then 120-124k and test 93k again so we print a double bottom there like i show on the chart, double bottom schould bring us slowley to 140k by begin-mid september,
people think bullrun tops in oktober-dec, all social media is expecting that but in crypto always the opposite happens what the massa think, i think cycle tops 2025 september.
we will go to 160k in q1 2026, but thats another story lets see how this play out first,
have a nice day all its just my vieuw of btc at the end is crypto and nobody knows

BITCOIN - Price can continue grow inside flat to $107933 level#BTC
The price is moving within a descending channel on the 1-hour frame and is expected to break and continue upward.
We have a trend to stabilize above the 100 moving average once again.
We have a downtrend on the RSI indicator that supports the upward move with a breakout.
We have a support area at the lower boundary of the channel at 106500, acting as strong support from which the price can rebound.
We have a major support area in green that pushed the price upward at 106000.
Entry price: 106736
First target: 106996
Second target: 107434
Third target: 107933
To manage risk, don't forget stop loss and capital management.
When you reach the first target, save some profits and then change your stop order to an entry order.
For inquiries, please comment.
Thank you.

Bitcoin Crash To $93k Incoming?!!!!I am discussing the bearish signs i am seeing right now on Bitcoin, and talking about the confirmations I want to see, that will confirm that Bitcoin is about to crash down to 93k!!!

W pattern off the handle. #Bitcoin to 168K.From my most recent post of the Cup & Handle I see a W pattern. Price broke out of the handle to retest to confirm support creating a double bottom.
This is a very good sign to confirm the C&H for this bullish near future.
If we continue upwards and break the psychological resistance zone at 111K, I expect 168K within 3-6 months.
I attached the Cup and Handle analysis to the current.

#BTC/USDT#BTC
The price is moving within a descending channel on the 1-hour frame, adhering well to it, and is heading for a strong breakout and retest.
We are experiencing a rebound from the lower boundary of the descending channel. This support is at 108883.
We have a downtrend on the RSI indicator that is about to be broken and retested, supporting the upward trend.
We are looking for stability above the 100 Moving Average.
Entry price: 109380
First target: 109948
Second target: 110800
Third target: 111670

BTCUSDT Price Analysis – Potential Drop Incoming! 🔲 Chart Zones
🟥 Resistance Zone (~111,000–112,000):
Price has touched this zone multiple times and failed to break higher – this is a strong resistance area. 🚫📈
🟪 Support Zone (~101,000–102,000):
A historically strong demand area where price previously bounced up. 💪📉
🔍 Current Price Behavior
📊 Price Level: Around 108,666.66
🔄 The chart shows lower highs forming, indicating weakening bullish momentum.
📉 Bearish projection drawn (blue zigzag line) suggests a potential double top forming below resistance.
📉 What’s Expected?
🔵 Big Drop Alert! ⬇️
If the price fails to break above and gets rejected again, the chart predicts a sharp move down toward the support zone.
🎯 Target Area: ~101,000–102,000 (Support zone)
📌 Summary
🧱 Resistance holding strong
💤 Momentum slowing down
⚠️ Bearish move likely
🏹 Targeting support zone for potential bounce
⚠️ Trading Tip 🧠
Watch for confirmation before entering trades! A break below the recent lows could trigger a short opportunity, while a bounce near support could offer a buy setup. 🛑📈

BTC CMA 92,000BTC CMA 92,000
We are currently at a temporary peak and strong, but not final, selling zone. We have a price gap reaching 92k, and a strong reversal to it is expected. Stay tuned for any new updates.

#BTC/USDT#BTC
The price is moving within a descending channel on the 1-hour frame, adhering well to it, and is on its way to breaking it strongly upwards and retesting it.
We are seeing a rebound from the lower boundary of the descending channel, this support at 106792.
We have a downtrend on the RSI indicator that is about to break and retest, supporting the upward trend.
We are looking for stability above the 100 moving average.
Entry price: 107234
First target: 108262
Second target: 109748
Third target: 111298

BTC DOMINANCEBitcoin dominance could break down at this point, potentially signaling the start of an exceptional altseason.

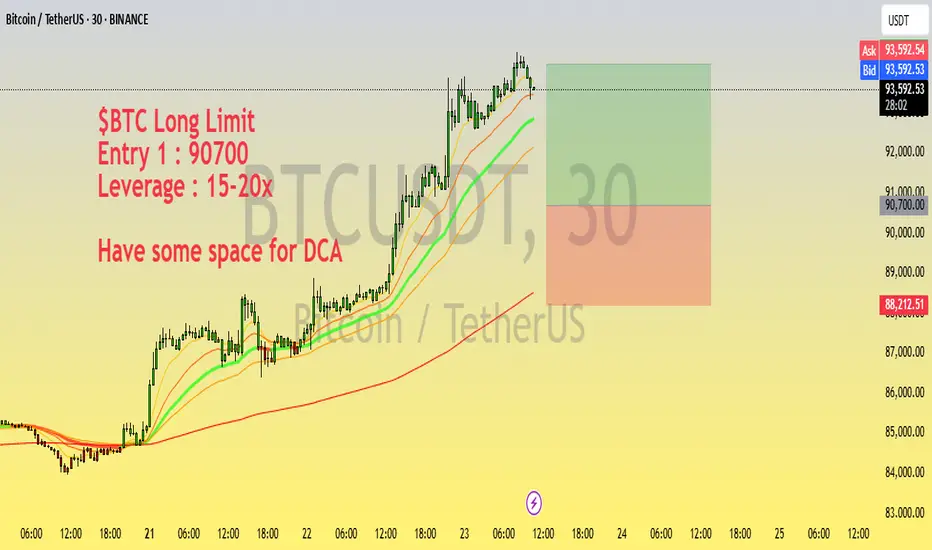
$BTC Long Setup | Entry @ 90700 | 15-20x Leverage | DCA FriendlyLooking to long BTC from the 90,700 zone with a high-conviction setup on support.
Trade Plan:
Entry 1: 90,700
Leverage: 15-20x
Setup: Price holding above key support with bullish structure forming on lower timeframes
Note: Leave room for DCA if price dips further
Monitor closely for reaction around support — tight SL recommended for capital protection.
Disclaimer: Not financial advice. DYOR and manage your risk accordingly.
#BTC/USDT#BTC
The price is moving within a descending channel on the 1-hour frame, adhering well to it, and is on its way to breaking it strongly upwards and retesting it.
We are seeing a rebound from the lower boundary of the descending channel, which is support at 82900.
We have a downtrend on the RSI indicator that is about to break and retest, which supports the upward trend.
We are looking for stability above the 100 moving average.
Entry price: 83240
First target: 85150
Second target: 86435
Third target: 87858

BTCUSDT RISING WEDGE PATTERN IN 30-MI Created This BTCUSDT Chart Analysis In 30-M Tf
Entry: SELL from 85700
Resistance zone : 86200
Target Will Be : 83200
BINANCE:BTCUSDT made Rising wedge pattern, It's Seems bearish momentum, Let me know your thought in comments section

BITCOIN Update: What We Can Expect Next???According to current price action we can expect 3 scenarios:
Scenario 1: BTC is currently at it mid range resistance. If it breaks above this resistance then we may probably see price approaching range high and even beyond.
Scenario 2: If it fails to break and rejects, then most probably we can expect reversal from range low demand zone, which aligns with cypher harmonic pattern's PRZ.
Scenario 3: In worst case, we may see BTC dumping upto 74-70K region, and from there we will most probably see trend reversal.
Most crucial level to watch in all scenarios is 95k region, if it breaks successfully above it, then we will see BTC slamming new ATH.

Bitcoin Price Analysis – Bullish Setup with Caution AheadThe short-term trend is bullish, as we observe:
- Price movement is above the short- and medium-term moving averages.
- The price is forming higher highs and higher lows.
- Support levels are steadily rising along the moving averages.
However, there is a noticeable loss of momentum in recent hours, which could signal a potential short-term correction or profit-taking phase.
Bullish Indicators
Moving Averages:
- The 10 EMA, 20 EMA, and 30 EMA are all indicating a Buy signal.
- The 200 EMA also reflects a Buy signal.
- This indicates that the price is trading above key averages, supporting the continuation of the bullish trend.
ADX = 29.49 (Buy): The strength of the current trend is still significant (above 25), which reinforces the continuation of the bullish movement.
MACD (Buy): The MACD has shown a positive crossover, which supports the bullish signal and continued upward momentum.
Bearish Indicators
Momentum = Sell (Value: 4,249.13): There is a noticeable slowdown in momentum, which may indicate the early stages of a correction or temporary weakness.
Some Long-Term Averages = Sell: The 50, 100, and 200 Simple Moving Averages are showing sell signals, suggesting the longer-term trend has not yet fully transitioned into a bullish phase. These may also act as resistance if the price continues to rise.
Stochastic RSI Fast = 90.56 (Overbought): This indicator is in the overbought zone, pointing to a potential near-term pullback.
RSI = 53.34 (Neutral to Overbought): Not yet in the overbought territory, but gradually approaching it, which should be watched closely.
2025 Performance Lagging: The latest chart shows that 2025 performance is currently at -6.46%, compared to a strong +111% in 2024. This discrepancy suggests a phase of ongoing profit-taking or broader consolidation.
Outlook
Short-Term (Hours to Days): There is a potential for further upside with key resistance levels at 88,500, 89,000, and 90,000.
The nearest support levels are at 87,500 and 86,800.
However, caution is advised due to signs of short-term exhaustion in indicators like Stochastic RSI and Momentum.
Medium-Term (Weeks): As long as the price holds above the 86,000–86,500 range, the uptrend is likely to continue. A breakout above 90,000 would be a strong bullish signal that could drive the market to new highs.
Recommendation
- For Short-Term Traders: Take advantage of the current move but remain cautious of sudden corrections.
Watch for potential buy zones near 87,000 and 86,500. Use a tight stop-loss strategy if these support levels are broken.
- For Medium/Long-Term Investors: Indicators show that the uptrend is starting to stabilize.
Consider partial entry now while closely monitoring the 90,000 level.
Avoid going all-in at current levels and keep capital aside to buy dips if the market corrects.

BTC Breaks Structure - Key Levels to Watch PLUS Trade Idea!Bitcoin has broken structure to the upside on the daily timeframe, confirming a bullish trend 📈. I’m considering a buy opportunity, but only if the key conditions discussed in the video align.
Right now, BTC is in a strong uptrend, with a well-defined higher highs and higher lows structure on the 4-hour timeframe 🔍. In this video, we break down the trend, price action, market structure, and other essential aspects of technical analysis to navigate this setup effectively.
⚠️ Not financial advice.

BTC Buy at this Level - NFP News This Week (Volatility Risk!)Short term Buy idea on Bitcoin. This is a riskier idea because:
A) BTC is showing signs of Weakness (so we are counter trend trading)
B) This idea is based on NFP news timing
I may wait until Monday to get clarity (unless you also trade on the weekend)
Overall Idea for this is:
- W1/M candles have big rejection wicks to the downside, retesting the previous Week's wick, hinting at some Buyside potential
- We see divergence with ETH.
- The LTF H4 shows a Break of Structure, momentum move to the upside.
- We've already had a retracement down after, and it validated the gap in price (blue zone), reacting off it, hinting that it will hold.
- Now I'm waiting for the next best price to enter.
Again, NFP volatility can create bigger than usual spikes, so keeping that in mind.
If NFP takes it higher without coming to a better price, so be it - the train will leave without me. Will wait for further PA.
Price will be giving the validation to enter.

BTC LOWBTC New Low month of March & April, new low is 68000 $ if its hold then going more down side .

BTC New Low 68,000 $ BTC as per my view going till 68,000 $ then its going up side , on this chart i m goiving my thought , its take bit time .

Bitcoin at Critical Support: Technical Analysis and Trade Idea📊 Bitcoin (BTC) is currently trading at a critical support zone, offering potential opportunities for both counter-trend trades and short setups! 🚀 In this video, we break down Bitcoin's price action and market structure on the daily and four-hour timeframes, focusing on key areas such as liquidity zones, bearish imbalances, and Fibonacci retracement levels. Discover how to identify higher highs, higher lows, and potential trade setups for both long and short positions. 💹 Whether you're an experienced trader or just getting started, this analysis will give you the tools to navigate Bitcoin's current market dynamics with confidence. 🔄 As always, this content is for educational purposes only—trade wisely and stay safe! 💡

Elliot Wave, Market Stru. Premium/Discount , Liquidity BTC/USDT Please respect others Analysis, Some are good some are trying to be good,
We used Elliot wave for directional shift
MS for top down analysis.
liquidity zones for precision
please review this analysis
