BtcSomeone asked me a question, I want to open a trade on Bit with three orders, the first is 20%, the second is 30%, and the third is 50% of the money that I am going to leave for Bit.
The only point is, set the damage limit based on your pain level
Btcudst

Bitcoin is having a blast this year! Are you in?I hope this idea finds you well and your Bitcoin wallets even better! We all know that Bitcoin has been on a rollercoaster ride for the past few years, but it's been nothing short of amazing this year. Yes, you heard it right! Bitcoin is having a great year, and everyone must admit it.
From January to April, Bitcoin has increased by over 100%. That's right, folks! 100%! And it's not stopping there. With the recent market trends, it's safe to say that Bitcoin is on its way to the moon.
I know some of you may be hesitant to jump on the Bitcoin trading bandwagon. But let me tell you; it's not too late to join the party. It's never too late to start trading Bitcoin. You only need knowledge, passion, and a reliable trading platform.
So, here's my call to action for all of you. If you haven't already, consider Bitcoin trading. Trust me; it's a world of fun and profit. And for those already trading, keep up the good work, and let's enjoy this Bitcoin boom together.
In conclusion, let's all raise a glass to Bitcoin's great year so far. Cheers to the future of Bitcoin trading, and may we all reap the benefits of this digital gold.

BTCUSDT liquidity warBy breaking the support of 26,700, liquidity was provided for the price to return to the top. Now guess what? Where is the next closest Liquidity? Just above the 30k range. intact and awaiting to grab.
⚠️"Daily crypto market analyses I provide are personal opinions & not financial advice. Trading carries risks, so do your own research & seek advisor's help."

Bitcoin $BTC 1 HR Bull Bitcoin on the 1 hr chart has risen above the EMA 200 trend line a good sign along with Impulse MACD crossing Signal line (bullish) but as you can see what is ahead lots of the color red (resistance) hoping it pull through :)

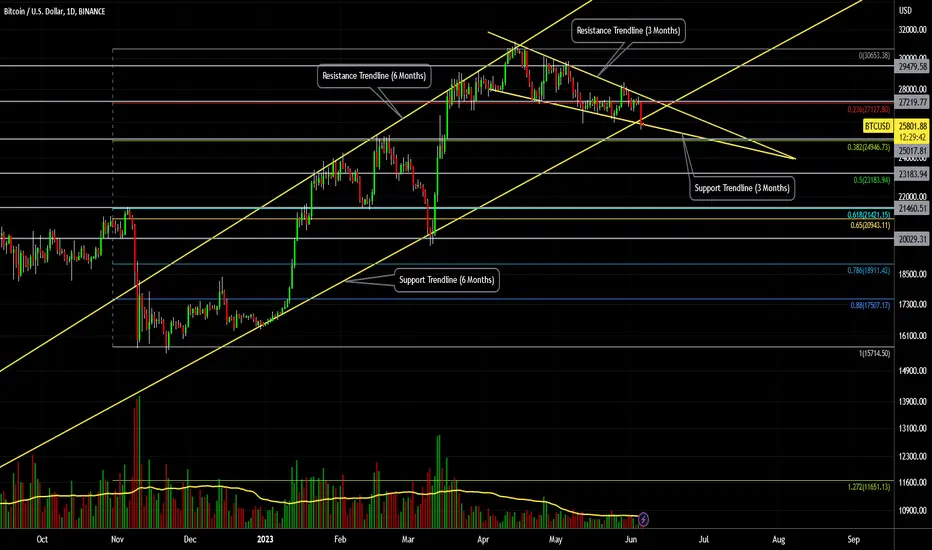
BTC/USD (Bitcoin) - 6 Month Uptrend Support Level Test - DailyBitcoin (BTC/USD) price has been downtrending inside a falling wedge pattern for the past 3 months.
Price is currently below the 6 month uptrend support trendline, and is testing the $25000 zone.
If the Bitcoin price closes and continues to fall below $25000, the 6 month uptrend could be at risk.
The next one to two months of Bitcoin price action will likely determine if the uptrend continues or not.
Support Price Levels above $25000 to $20000 must hold for the uptrend to continue in 2023.
Support Price Levels: $25000, $23000, $21000, $20000.
Resistance Price Levels: $27000, $28000, $29000, $30000.
Weekly and Monthly consolidation of Bitcoin was likely due to negative catalysts such as: SEC and CFTC lawsuits against USA crypto exchanges, crypto regulation changes, inflation, decline of metals and commodities, low consumer sentiment, regional bank crisis, recession risk, etc.
US CPI past trends and future forecasts.The cryptocurrency market has been quiet of late, with bitcoin continuing to oscillate in the $27,000 range since early June. According to The Block Research, bitcoin's annualized volatility is currently around 32%, a significant drop from its historical average of 71%, and is currently lower than even Meta and Amazon stock.
Bitcoin bull market to start by end of Q3
Arthur Hayes, co-founder of BitMEX, wrote an article on the 2nd predicting that the real bitcoin bull market will start by the end of Q3 to early Q4 of this year, giving reasons why, contrary to traditional monetary theory, a rise in interest rates will lead to a rise in the volume of money and inflation, rather than a fall, due to current debt and production output conditions.
Arthur Hayes believes that US inflation will bottom out and start to rise slowly, which means that the Fed will probably pause in June and then resume rate rises in July, with the policy rate likely to be close to 6% by the end of August, and that higher rates will increase the interest paid on RRP (reverse repo) and IORB (interest on reserves rate) balances, which in turn will increase the amount of money printed by the Fed:
All these interest payments are in effect a stimulus package for the rich. What will rich asset holders do when they have more money than they need? They will buy risky assets, gold, bitcoin, AI tech stocks, etc. will all be the beneficiaries of this 'wealth' printed by the government and paid out in the form of interest.
When the money printing machine starts working, bitcoin will boom!
Bitcoin is estimated to rise above $70,000 next year
Previously, Arthur Hayes made a specific prediction for the price of Bitcoin during his appearance on the Podcast show 'What Bitcoin Did' last week. He doesn't think Bitcoin will reach a record high of $70,000 this year, but it has a chance next year, but then it will top out in 2025 or 2026 due to the many risk factors surrounding the world:
I don't think bitcoin can hit $70,000 this year, but it can next year, and then in 2025, 2026, the price will skyrocket, and then it's Armageddon.

Quick long on BTC Bearish Bat Harmonic Pattern 2HGreat opportunity to Quick Scalp with High Leverage on a 5 to 6 Risk Reward Ratio. Stop Loss below the last low.
Tell me your thoughts. Trade Safe!

btc 25000 soonBitcoin update
Friends, the bottom of the ascending channel is marked with black lines and the price should return from there.
But according to the Dominance Tether candles and the rising channel that it has formed, the bit may come out of its rising channel...
What happens if the bit is removed from this channel? If it comes out, I will give you an update (the range is 23000 thousand and probably the last target of Dominance Tether)

BitcoinFor the first time in a long time, the price of Bitcoin has moved out of the channel range. In order for it to return to the channel, something significant and positive needs to happen in the market that would trigger a pump. Currently, we only see a potential interest rate increase, possible rise in the dollar index, and discussions about recession and ways to solve these issues. There is no talk yet about risk-on assets. These factors lead to the thought that there may be a final short squeeze before a downward movement or an immediate downward trend. If we look at previous summer months, they have often been associated with a decline. What are your thoughts on this?

BTC the most likely scenarios !BTC / USD
Recently, BTC shows very little volatility
Actually this always happens before a big move so be ready soon
From my point of view BTC is likely to bounce from one of these structures in my chart :
– Structure 1 : Triangle pattern
price till now still holding above 27-26.5k local support which can make a bounce from current levels
– Structure 2 : high TF support
Price can drop to hit 24-25k which act as strong support in high time frames (my last analysis idea)
– Structure 3 : CME gap
CME gap is around 20k Which can be filled too
Which structure do you think will happens and why
Let me know in comments section below ⬇️

BTC/USD (Bitcoin) - Daily - Bearish Pullback to Test The UptrendBitcoin (BTC/USD) has formed a head & shoulders resistance price pattern under $31,000 in May 2023.
Support Price Target(s) below are: $25000, $24000, $22000, $20000.
Bitcoin needs to establish and hold a price support level above $20,000 to maintain an Uptrend in 2023.
note: the longer-term price trend for Bitcoin could take months to establish and develop.

BITCOIN TO $25,000 THEN $35,000 Or Bearish??Bitcoin has 2 main scenarios in play...
Looking at the bigger picture there is still no reason to be bearish, price could easily go higher..
Bitcoin may pump to $35k, if it rejects I see $25.3k possible before a move up. .
Or we could go lower to around 23k

Btc short to 12295 $ ( Daily chart )Hello guys....
12k not Toch in before bullrun and The price of 12,000 dollars was touched only once in the last bull market and it is a very attractive price for whales. Note that too many untouched balances may have price reverting to them.
This time, we may see very low prices before the halving of Bitcoin miners' rewards, and after a year or two after the halving, we will see the highest prices.
Do you think the bat can catch the worm first or an eagle can have a wider choice between fish, rabbit and mouse.
So some sellers may be hunted by eagles because the price of 12,000 dollars is more attractive! Always thinking like whales will increase the probability of success. So before the rewards are halved, we see a lowest price and the whales buy their currencies from the hasty people and sellers.
I love you, be profitable and happy

Profit is still going on, join me and take you to make more mone
BTC strategy analysis:
After stepping back on the 27200 line in the short-term within 4 hours of the day, the BTC market fluctuated within a narrow range within a short period of time. The market was under pressure at night, and the BBI average pressure fell back. The third line of the KDJ indicator turned at the 20-axis golden cross. Continuous shrinkage, the short-term current market is slightly deviated, and the attached indicators show signs of rebound. The daily market K-line closed below the MA60 moving average support on May 8, and the K-line was under pressure below the MA60 moving average on May 9. Currently The market is showing a small negative K line, the K line is currently showing 4 consecutive negatives, the KDJ indicator diverges downwards, and the MACD indicator green entity kinetic energy column is heavy. From the daily line, there is a risk of further decline in the market. Pay attention to the support around 27000. The market breaks big Probability drops to support around 25500, it is recommended to focus on high altitude
BTC:
28465--28755 Empty
More than 26630--26358
ETH:
1888--1912 Empty
1788--1763 more
Profit is still going on, join me and take you to make more money

BTC is finally ropping off from uptrend lineLook at here BTC is heading to 26142 area. Signs of weakening were seen for weeks and now it's May 9th again, three consecutive years of dumping on this date.
Can we rise back from here? I'm really hoping for bounce and continuation of uptrend


BTC USD FUNDAMENTAL ANALYSISBitcoin price recently decoupled from the stock market, as a result of which even the recent banking crisis held no bearish impact on the cryptocurrency. Now as the "Sell in May" trend comes back to life, it is likely that BTC might reap the benefits of a slow-growing stock market.
"Sell in May" - Banks' collapse paves the way
In the stock market, as April comes to an end, a common saying among investors comes back to life - "Sell in May and Go Away". The axiom is used to signal the beginning of the worst six months of the year for traders and investors. Due to the relatively terrible performance of the stock market, i.e., S&P 500 Index (SPX), "Sell in May" suggests simply ignoring the next six months and coming back again in October.
While it may seem like another fad, the saying has historically been proven right. According to a report from Carson, on average, the May to October period has borne the least growth of 1.7% in comparison to other six-month combinations.
But beyond an axiom, the stock market does have a lot to worry about as another bank just collapsed. The First Republic Bank, one of Unites States' 20 biggest banks, is going to be reportedly taken over by the Federal Deposit Insurance Corporation (FDIC) on April 28. The bank will be placed under imminent receivership as the FDIC said that there was "no more time" for a private sector rescue.
Earlier this year, the Silicon Valley Bank, Silvergate Bank and Signature Bank failed as the entire US faced a banking crisis in Q1. The stock market bore the impacts of the same as within a month, SPX declined by nearly 344.63 points falling by 8.25%.
Now as May begins following First Republic Banks' crisis, the Federal Reserve is also set to conduct its Federal Open Market Committee (FOMC) meeting on May 2 - 3. In this meeting, the next interest rate hike will take place, and the Fed is likely to increase the rates by 25 basis points (bps).
The probability of the same is currently at 80%, rising from 75% that was observed a few days ago after reports of First Republic Bank being taken over by the US government first came to light.
All these instances could have a bearish impact on the stock markets, translating into a bullish impact on Bitcoin price.
Bitcoin price could rise
Bitcoin price in the past has had a rather surprising reaction to not just the stock market decline but the banking crisis as well.
While the banks collapsing in the first quarter of the year brought down the stock and crypto market collectively initially, BTC started rallying soon after and over the next ten days, the biggest cryptocurrency in the world shot up by 40%.
This is because, towards the end of 2022, Bitcoin decoupled itself from the stock market and regained its "safe haven" status and "inflation hedge" label akin to Gold. Even this week, as the initial reports of First Republic Banks's failure arrived, BTC shot up by nearly 8%.
Thus as the "Sell in May" trend takes shape and stock market performance remains sub-par, Bitcoin price will have room to welcome traders and investors from the stocks' world.
Furthermore, Bitcoin supply profitability is still pretty low at 74%. While the profitability did increase over the last four months from 45% to a 12-month high, there is still room for growth before a market top is observed.
Usually, when more than 95% of the supply becomes profitable, a market top is marked, which induces sell pressure. Until then, BTC is good to chart gains.
Conclusion
Looking at the broader market conditions, it does seem likely for Bitcoin price to observe some green candlesticks on the charts potentially. That is unless the alt season takes over and Bitcoin's dominance falls from the current 48.63% to less than 40%.
At the same time, traders and investors should also watch out for the upcoming interest rate hike, as a more than 25 bps hike could cause a price crash.

what do you think ? Bitcoin 1H on the 5 Min it is making holding a demand zone and making a HH , maybe still some bullish movement ?

Cup Handle pattern hinting bullish continuation in BTCCup and handle pattern indicating bullish continuation in BTC in H1 timeframe. 30160 is the key resistance level to be broken to continue up trend in BTC.

BTCUSD - Hourly IdeaA bearish Channel is forming on BTCUSD Hourly
This channel should provide a double top and lead the bears towards 25K
Update for BTCUSD
Posting relevant charts below


Bitcoin Consolidating For Another Sell Off.25K Imminent!*** DISCLAIMER No Financial Advice ***
Bitcoin can go as low as 25K today
it's important to note that technical analysis and patterns suggests an imminent correction before the next leg up
when we reach 25K then we decide the next level but IMHO 20K is comin slowly but surely and more lows will follow after that
Thanks for watching
Please support the channel by Boost,Follow,Comment and sharing my video

BLX - Big RunA suggestion of large bull continuation coming
The curves are exactly the same and sort of act as a cup and handle
Supporting my previous idea of a run to 700K which is what I will link below
