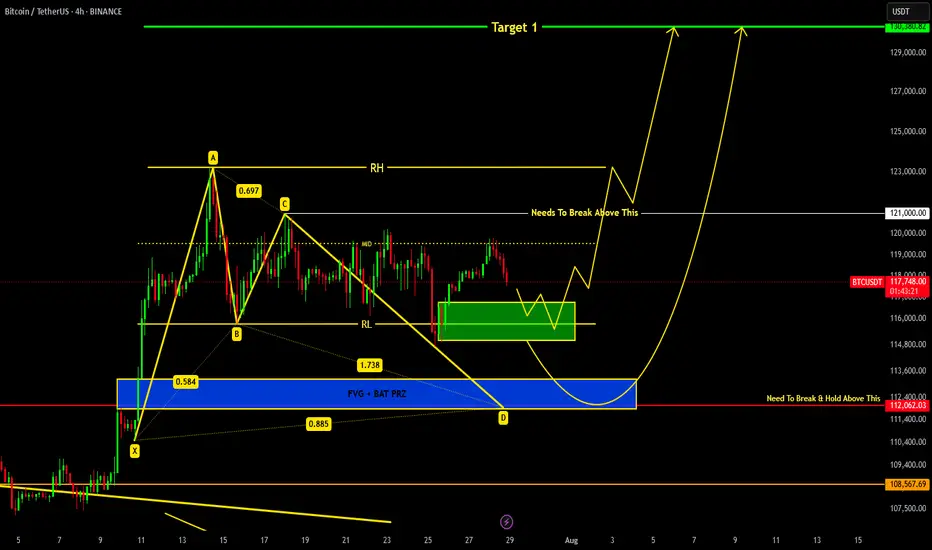
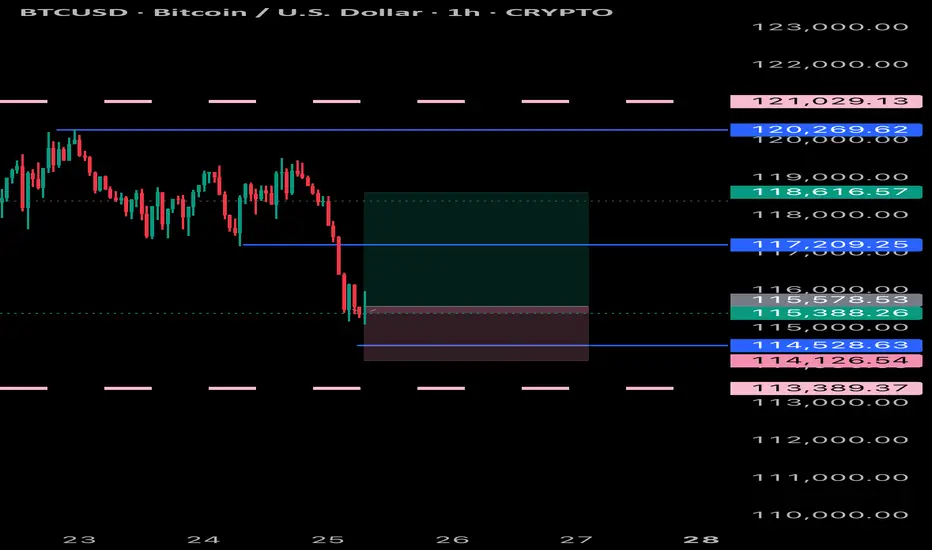
BITCOIN Current Update !!!we are heading towards support region around 116.8k-115k from where we can expect a reversal.
If price breaks down 115k level then a bat harmonic pattern is also forming which indicates it's PRZ at 113-112k region...
Remember 121k is key level which needs to be broken in order to remain bullish !!!
Btcupdate
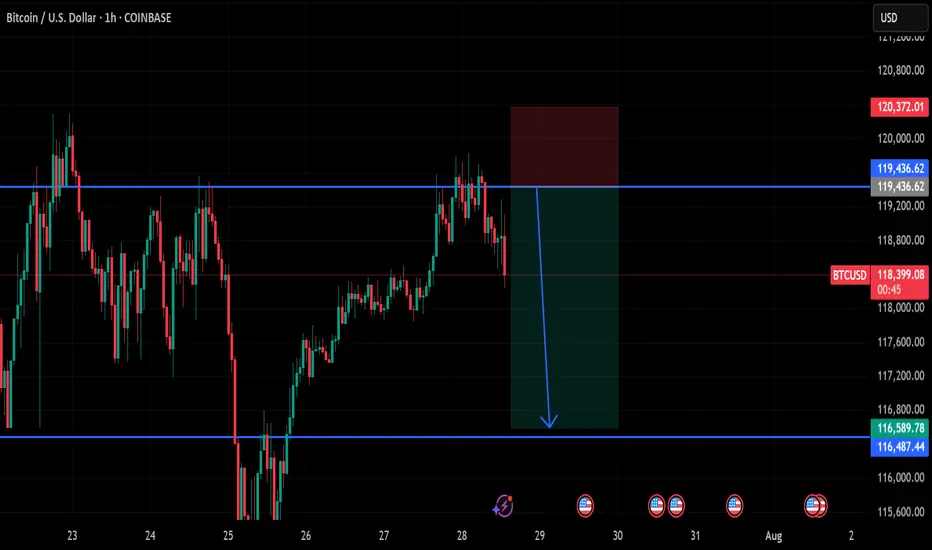
btc on selling#BTCUSD on multiple price rejection at 119k,now we await final touch before a fall below 116487-110k.
Sell at 119436, target 116487-110k, stop loss 120372.
Bullish range isn't strong
BTC May Extend Rally as ETF Flows & Policy Support Push Higher📊 Market Overview:
• Bitcoin trades around $118,660, rebounding from lows near $114,500 earlier this week after a sharp decline. Strong inflows into BTC and ETH ETFs are bolstering market sentiment
• Regulatory clarity via the Genius Act, Clarity Act, along with the U.S. Strategic Bitcoin Reserve, is fueling institutional interest
• High-profile corporate Bitcoin purchases, such as by Trump Media, underscore growing adoption and bullish sentiment in crypto treasuries ________________________________________
📉 Technical Analysis:
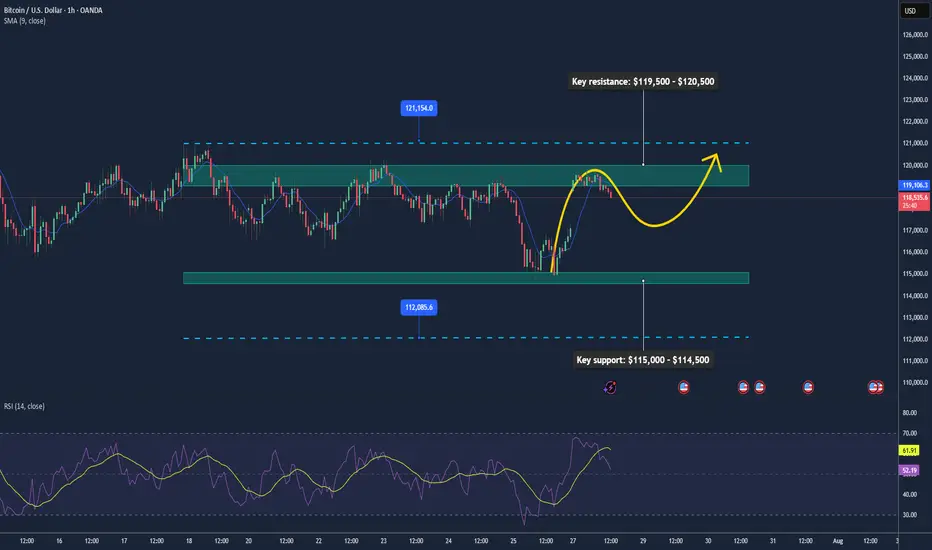
• Key resistance: $119,500 – $120,500
• Key support: $115,000 – $114,500
• EMA 09 (H1): Trading above EMA09, indicating short-term bullish bias
• Candlestick / Volume / Momentum:
• BTC is consolidating within a range of $115K–$119K, prepping for potential breakout
• Indicators like RSI and MACD show positive momentum
• At 1-hour chart, a double bottom around $118,950 signals buyer strength near dips
________________________________________
📌 Outlook:
Bitcoin is likely to continue rising in the short term, particularly on a push through $119,500–$120,500. ETF inflows and regulatory tailwinds remain supportive. However, a breakdown below $115,000 may indicate short-term bearish risk toward $112,000.
________________________________________
💡 Trade Setup
🟢 BUY BTC/USD: $115,500 – $116,500
🎯 TP: $119,200 → $120,000
❌ SL: $115,000
🔴 SELL BTC/USD: $120,500 – $121,000
🎯 TP: $119,000 → $118,000
❌ SL: $121,500
BTCUSDT NEXT Impulse !Hi fellow traders, BTCUSD will be ready to make a move higher from the blue box after it completes the expanding flat pattern in a WXY formation. Target will be 113604.87 USD. Good luck and trade safe!

#Bitcoin – What’s Really Happening? Daily Structure + Macro#Bitcoin – What’s Really Happening?
Daily Structure + Macro Setup = Big Move Loading
🔸 1D Chart: CRYPTOCAP:BTC Range-Bound Between $125K–$110K
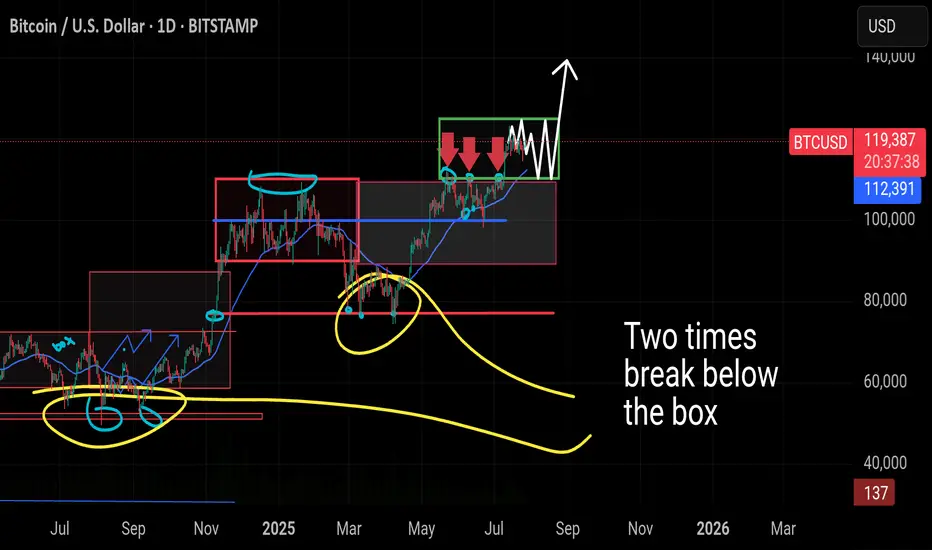
Bitcoin is currently trading inside a tight sideways range, marked by resistance near $125,000 and support around $110,000. This is now the third time we've seen price consolidate in this green zone.
🔸 In the previous two attempts, BTC briefly dipped below support before quickly reclaiming the level — classic fakeouts, not real breakdowns. The current price behavior mirrors that same structure.
🔸 What If CRYPTOCAP:BTC Drops Again?
A dip below $110K or even toward $100K should not trigger panic. Historically, these wicks below the range are liquidity grabs — not signs of weakness. As long as the 200 MA holds and price doesn’t sustain under $100K, the macro trend remains bullish.
🔸 Key Zones:
– Immediate support: $112,398
– Major support: $100K psychological level
– Structure invalidation: Sustained loss below $100K (not expected)
🔸 Macro Outlook: Still Bullish
While BTC chops sideways, the broader environment is heating up:
🔸 Trump-EU Mega Trade Deal
Markets just got a major catalyst — a massive U.S.–EU agreement that includes:
– $750B in U.S. energy exports
– $600B in EU investment
– $150B in energy purchases from U.S.
This clears out tariff fears and opens the door for stocks and crypto to run. Risk appetite is returning fast.
🔸 Whale Activity Panic = Noise
Galaxy Digital wallet movement spooked the market temporarily, pushing BTC to $114,500. But zoom out:
– ETF inflows still dominate daily sell volume
– BlackRock continues absorbing supply
– Long-term whales haven’t sold — they’re holding
This was not a breakdown. It was a shakeout. Accumulation is still happening.
🔸 The Real Fuel: M2 Money Supply
Here’s where things really align for the bulls:
– In 2020, a 25% rise in M2 → BTC 800% rally
– In 2025 so far: +2.3% increase, and we’re still in “tightening”
– Largest M2 spike: +0.63% in June
Given BTC typically lags M2 by 60–90 days, the June print is setting up for a 15–17.5% upside over the coming weeks. That puts us on a clear path toward $130,000+
🔸 Bitcoin is sideways, not weak. Range-bound price action is accumulation, not distribution. Macro signals are aligning, M2 is expanding, and whale panic was short-lived.
We’re not just holding a range — we’re coiling for the breakout.
You’re early. Stay ready.
#bitcoin
BTC:LIVE TRADEHello friends🙌
📉Given the decline we had, we now had a good price rebound in the specified support area, which shows the power of buyers. Now, with capital and risk management, we can buy at the specified points in a stepwise manner and move to the specified targets.
🔥Follow us for more signals🔥
*Trade safely with us*

TC Analysis – Watching That Trendline Closely!Hello guys!
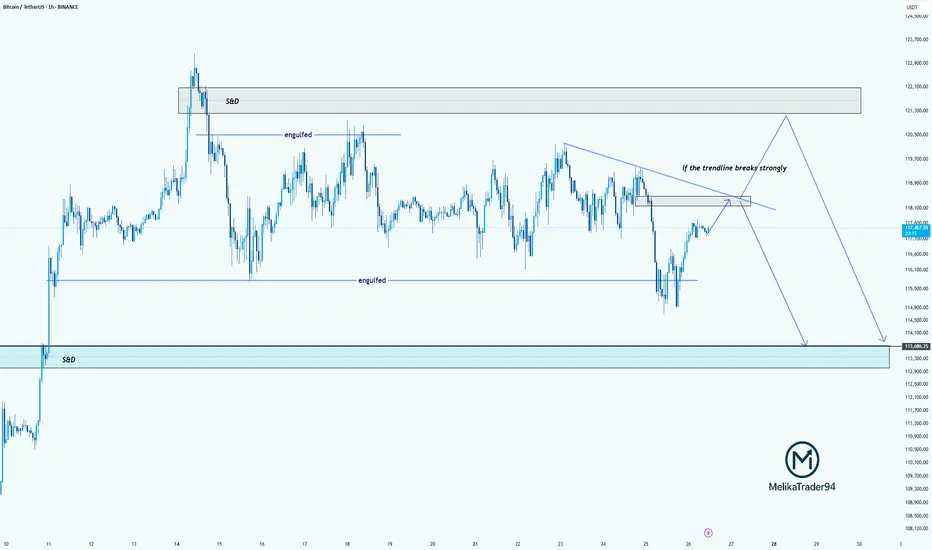
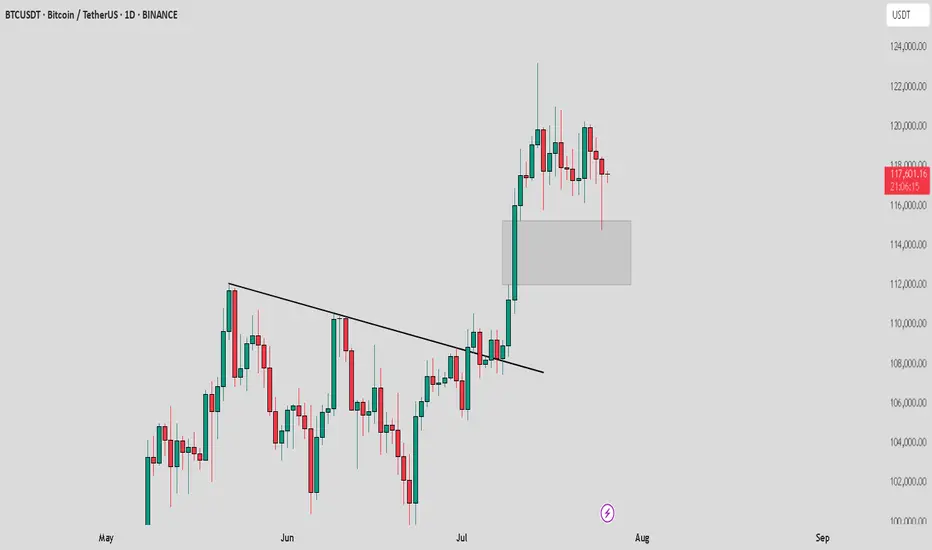
Bitcoin is currently approaching a key decision point. As highlighted on the chart, we’ve got a descending trendline acting as strong resistance. If this trendline breaks with strength, we may see price push up into the supply & demand zone around 121,000–122,000 before potentially reversing.
However, if the trendline holds, this current move could be a retest, setting up for another drop. The engulfed level at 114,000 has already been tested once, and if we break below that again, the price could slide down into the S&D demand zone around 113,000–112,000.
summry:
Trendline resistance is critical right now
Watch for a strong breakout or a fakeout & rejection
Possible bearish continuation if we fail to reclaim above 118,500
Let’s see how BTC reacts around this zone.
BTC /USDT : Getting support from FVG BTC Support from FVG - Bullish & Bearish Scenarios:
Bullish Scenario:
BTC is holding support from the FVG. As long as BTC stays above this zone, the market remains bullish. A bounce here could lead to further upside.
Bearish Scenario:
If BTC breaks below the FVG, it signals a potential downtrend. A breakdown may lead to more pain and further declines in the market.
Tips:
1. Wait for Confirmation: Look for a clear candle close above/below FVG for validation.
2. Risk Management: Set stops near the FVG to manage potential losses.
3. Monitor Volume: Strong volume during support retests increases bullish potential.
4. Stay Flexible: Be prepared for a market shift if BTC breaks the FVG support.
Why Bitcoin's Bull Run Hits a WallBitcoin's Bull Run Hits a Wall: A Deep Dive into the $115K Correction, Record Leverage, and the Battle for Market Control
A sudden and violent tremor has shaken the cryptocurrency market to its core. After a period of quiet range-bound trading, Bitcoin has decisively moved from consolidation to a sharp correction, plunging below the critical $116,000 support level and briefly touching $115,000. The abrupt downturn triggered a "bloodbath for crypto longs," liquidating hundreds of thousands of traders and wiping out nearly $600 million in leveraged positions. Yet, as the dust settles, a complex and contradictory picture emerges. While institutional sell-offs and cascading liquidations paint a grim short-term picture, record-high open interest, significant liquidity grabs, and bullish on-chain signals suggest the long-term uptrend may be far from over. This article delves into the anatomy of the crash, the forces that fueled it, and the fierce battle between bearish catalysts and bullish undercurrents that will define Bitcoin's next move.
Part 1: The Anatomy of the Correction - From Sideways to Sell-Off
For weeks, Bitcoin's price action was characterized by consolidation, a phase where an asset trades within a defined range, reflecting market indecisiveness. After a strong upward trend that pushed Bitcoin to new highs above $120,000, this period of sideways movement was seen by many as a healthy pause before the next leg up. However, this placid surface masked building pressure. The transition from this consolidation phase to a full-blown correction was swift and brutal.
A market correction is defined as a rapid price change, often a decline of at least 10% but less severe than a crash, that disrupts an asset's prevailing trend. The recent tumble below $116,000 fits this description perfectly. The sell-off was not a gradual slide but a violent dislocation, breaking through established support levels and triggering a wave of panic.
This dramatic shift was exacerbated by several key factors. On-chain data revealed that a significant institutional player, Galaxy Digital, unleashed a massive sell-off, reportedly moving billions in Bitcoin to exchanges. This sudden injection of supply into the market acted as a powerful catalyst, overwhelming buy-side pressure and initiating the downward price spiral. The market's reaction was immediate, with the price slicing through the psychological support at $116,000 and heading towards the next major liquidity zone around $115,000.
Part 2: The Cascade - A $600 Million Bloodbath for Leveraged Traders
The speed of the price drop had a devastating impact on the derivatives market, a space where traders use borrowed funds to amplify their bets on price movements. The sudden downturn resulted in one of the most significant liquidation events in recent memory, with 213,729 traders liquidated for a total of nearly $600 million over a 24-hour period.
What is a Liquidation?
In crypto futures trading, liquidation is the forced closure of a trader's position by an exchange. This happens when a trader can no longer meet the margin requirements for their leveraged position, meaning their collateral is insufficient to cover their mounting losses. For example, a trader using 20x leverage on a $1,000 position controls $20,000 worth of Bitcoin. However, a mere 5% price move against them can wipe out their entire initial capital, triggering a liquidation.
The recent event was a "bloodbath for crypto longs," meaning traders who had bet on the price of Bitcoin increasing were the primary victims. As the price fell, these long positions became unprofitable, and once they crossed their liquidation price, exchanges automatically sold the collateral on the open market to cover the losses.
This process created a deadly feedback loop known as a liquidation cascade. The first wave of forced selling from liquidated longs added more downward pressure on the price. This, in turn, pushed the price down further, triggering the liquidation of another set of long positions whose liquidation prices were slightly lower. This domino effect—where liquidations cause lower prices, which in turn cause more liquidations—is what transforms a standard price dip into a violent market crash. This automated, rapid chain reaction is a hallmark of the highly leveraged and volatile crypto markets.
Part 3: The Fuel for the Fire - Open Interest Reaches a Record $44 Billion
Underpinning this massive liquidation event was an unprecedented buildup of leverage in the market, best measured by a metric called Open Interest (OI). Open Interest represents the total number of active or unsettled futures contracts in the market. It’s a measure of the total capital and number of positions committed to the derivatives market, distinct from trading volume, which counts both opened and closed positions. An increase in OI signifies that new money and new positions are entering the market, often leading to higher volatility.
In a stunning development, as Bitcoin's price began to plunge, the total Open Interest surged to a new all-time high of $44 billion. This unusual divergence—where price falls while open interest rises—suggested that a significant number of new short positions were being opened to bet against the market, while many longs remained trapped, hoping for a reversal. This created a powder keg of leverage.
Further fueling this was a notable surge on the world's largest crypto exchange. On-chain data showed that traders added 10,000 Bitcoin worth of open interest to the BTCUSDT perpetual contract on Binance alone. This single-day surge in open interest on a key trading pair signaled a massive influx of speculative capital.
High open interest acts as fuel for volatility. With so many leveraged contracts open, any sharp price movement can trigger the kind of cascading liquidations that were just witnessed. The record-breaking $44 billion in open positions meant the market was more susceptible than ever to a violent deleveraging event.
Part 4: The Big Players - A Tale of Two Whales
The recent market turmoil cannot be fully understood without examining the actions of its largest participants: the whales and institutions. Their movements often create the initial waves that retail traders are forced to navigate.
On the bearish side, the primary catalyst for the sell-off appears to be Galaxy Digital. The digital asset financial services firm was observed moving tens of thousands of Bitcoin, worth billions of dollars, to centralized exchanges. These flows were reportedly part of a larger liquidation of holdings from a dormant "Satoshi-era" whale, with Galaxy acting as the intermediary to facilitate the sale. By strategically offloading such a massive amount, even if through over-the-counter (OTC) desks to minimize initial impact, the sheer volume of sell pressure eventually spilled into the public markets, triggering the correction. The firm's subsequent withdrawal of over a billion dollars in stablecoins from exchanges further suggests a large-scale profit-taking or strategic de-risking maneuver.
However, this institutional selling pressure is contrasted by a powerful bullish undercurrent. Even as the market reeled, other large players were making bold, long-term bets. Reports surfaced of a significant whale bet on Bitcoin reaching a staggering $200,000 by the end of the year. This dichotomy highlights the deep division in market sentiment. While some large entities are taking profits or repositioning, others view this correction as a prime accumulation opportunity, demonstrating unwavering conviction in Bitcoin's long-term trajectory.
This clash of titans—the institutional seller and the long-term bullish whale—defines the current market structure. The price is caught in a tug-of-war between immediate, heavy supply and deep-pocketed, long-term demand.
Part 5: Reading the Tea Leaves - A Healthy Reset or the Start of a Bear Market?
While the headlines scream "bloodbath" and "crash," a deeper analysis of market mechanics and on-chain data offers a more nuanced perspective. Several key indicators suggest that this brutal pullback, while painful, may be a healthy reset rather than the beginning of a sustained bear market.
Argument 1: The Pullback Remains Within Normal Volatility Range
Bitcoin is notoriously volatile, and sharp corrections are a historical feature of its bull markets. Drawdowns of 30-40% have been common pit stops during previous bull runs. While a drop from over $120,000 to $115,000 is significant, analysts point out that such moves are not out of character for the asset. Historically, major cycle-ending bear markets have seen drawdowns exceeding 75-80%. In contrast, mid-cycle corrections serve to wipe out excess leverage, shake out weak hands, and build a more sustainable foundation for future growth. This event, though severe for leveraged traders, may fall into the category of a standard, albeit sharp, bull market correction.
Argument 2: A Necessary Liquidity Grab
Sophisticated market analysis suggests the plunge below $115,000 was a textbook liquidity grab. This is a maneuver, often initiated by large players or "smart money," where the price is intentionally pushed to a level where a high concentration of stop-loss and liquidation orders are known to exist. By triggering these sell orders, large buyers can absorb the resulting liquidity to fill their own large positions at more favorable prices before reversing the market direction. The area just below a key psychological level like $115,000 is a prime location for such a maneuver. The rapid dip followed by a stabilization could indicate that this was not a panic-driven crash, but a calculated move to hunt liquidity before the next leg up.
Argument 3: Bullish Signals from Spot Markets and On-Chain Data
While the derivatives market was in turmoil, other indicators flashed bullish signals. One analyst pointed to a strong correlation between surges in Binance's spot trading volume and subsequent price upswings. Recently, Binance's share of the spot market volume surged significantly, a move that has historically preceded rallies. High spot volume indicates genuine buying and selling activity, as opposed to the paper bets of the futures market, and can signal strong underlying demand.
Furthermore, key on-chain metrics suggest the long-term bullish scenario remains intact. Analysts highlighted that Bitcoin's price found support near the "Realized Price" for short-term holders, indicating that recent buyers were not panic-selling in large numbers. Other metrics, such as those showing that major long-term holders are retaining their assets despite record prices, paint a picture of underlying market strength that contrasts with the short-term speculative chaos.
Conclusion: A Market at a Crossroads
The dramatic plunge to $115,000 was a multifaceted event, a perfect storm of institutional profit-taking, extreme leverage, and the brutal mechanics of the crypto derivatives market. For the over-leveraged trader, it was a catastrophe. For the long-term investor, it may have been a fleeting opportunity.
The market now stands at a critical juncture, defined by conflicting forces. On one hand, the specter of institutional selling, exemplified by the Galaxy Digital offload, looms large. The record-high open interest, though slightly diminished after the liquidations, still represents a significant amount of leverage that could fuel further volatility.
On the other hand, the arguments for a bullish continuation are compelling. The idea that the crash was a calculated liquidity grab, the historical precedent for sharp bull market corrections, the strength in spot market volumes, and the conviction of long-term holders all suggest that the core uptrend is resilient. The whale betting on a $200,000 price by year-end serves as a potent symbol of this underlying confidence.
The coming weeks will be crucial in determining which of these forces will prevail. The battle between the short-term pressures of deleveraging and the long-term thesis of accumulation will be fought in the charts and on the blockchain. While the bloodbath for longs served as a stark reminder of the perils of leverage, it may have also been the violent, necessary purge required to cleanse the market and pave the way for a more sustainable ascent.
BITCOIN PREDICTION - MASSIVE CANDLE INCOMING!!! (WARNING) Watch this Bitcoin Prediction video now, you will love it!
Yello, Paradisers! Big warning sign: #Bitcoin is about to liquidate more traders soon if we get these confirmations that I'm sharing with you in this video. Loads of people will get wrecked again. Be careful not to get trapped into fakeouts.
In this video, I'm describing exactly what I'm seeing on Bitcoin, what patterns I'm waiting to form, and what confirmations I want to see before being able to say with 100% accuracy guaranteed that MARKETSCOM:BITCOIN is moving in that direction.
I'm sharing with you all the important targets and also how professional trading works: how risk-reward proper ratio trading works, and how high-probability trading depends a lot on how you choose to create your trades.
Watch this Bitcoin prediction to understand what I'm seeing right now on the chart and how I'm acting and making my decisions.

BTC key zones for continueBTC needs to hold this zones for continue and there is some liquidity. Because dominance get breakout we want to see much higher prices for altcoin but maybe we will see sharp correction and continue up.
Feel free to ask for some altcoin analysis.

Bitcoin Btc usdt Daily analysis
Time frame daily
If btc can't break the green uptrend line strongly I guess it drops to 87$
But if btc can continue it's sharp way , my target is 170 $

BTCUSD BUYING can expect a bullish move from bitcoin as it has dropped a fair amount and can extract a reversal to the up side due to being oversold
BTC-----Sell around 118000, target 116500 areaTechnical analysis of BTC contract on July 25:
Today, the large-cycle daily level closed with a small negative line yesterday, and the K-line pattern continued to fall. Although the price is at a high level, the attached indicator is dead cross. The current big trend is falling. From the overall trend and the trend law, the pullback is not strong. Instead of breaking the high, the decline is strong and continuous. Then the trend is also slowly changing. The key support position below is 115700 area, which is the position to pay attention to today and next week; the short-cycle hourly chart currently has a continuous negative K-line pattern, the price is below the moving average, and the attached indicator is dead cross. The continuation of the intraday decline is a high probability trend, and whether the European session can continue to break the previous low is the key. The current short-term resistance position is in the 118000 area.
Today's BTC short-term contract trading strategy:
Sell at the 118000 area of the pullback, stop loss at the 1118500 area, and target the 116500 area;

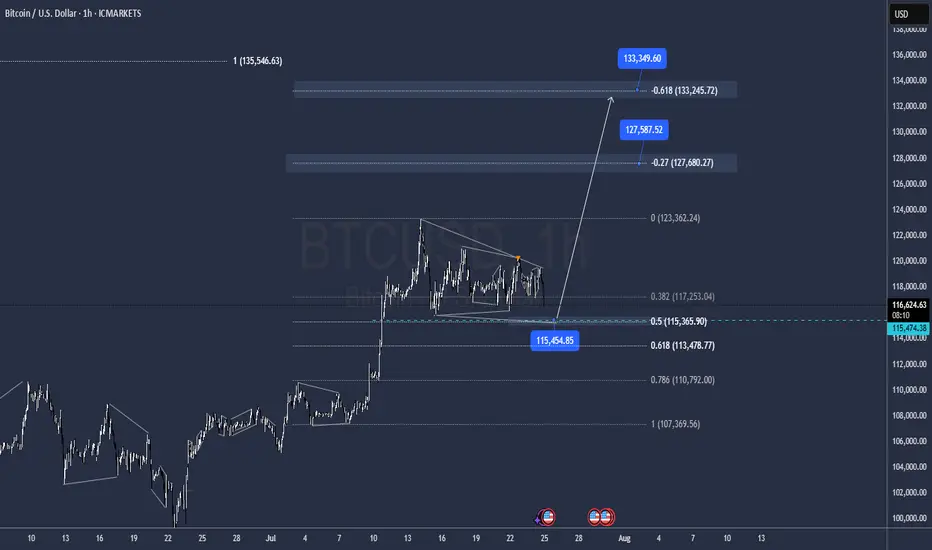
BTC Correction may be overOn a new look to the structure with the lat moves, it has the Potential to be over after tapping 115.500 and go for new Highs @ 127.500 / 133.000 as all internal impulses seeems to be matched.
Accumulate BTC over 115K💎 BTC PLAN UPDATE (July 23rd)
NOTABLE NEWS ABOUT BTC
Bitcoin (BTC) and Ripple (XRP) are approaching their all-time highs, while Ethereum (ETH) continues to grow steadily toward the important $4,000 mark. These top three cryptocurrencies by market capitalization are showing signs of a new bullish momentum, supported by strong technical structures and increasing investor interest.
TECHNICAL ANALYSIS PERSPECTIVE
1. Main Trend
The overall trend remains bullish, with a clearly rising price channel (black diagonal line).
However, BTC is currently in a short-term correction phase, consolidating sideways after the recent strong surge.
2. Key Price Levels
🔵 Strong Support Zone: 116,000 – 117,000 USDT
This zone includes the 200-day moving average (MA200), horizontal support, and a previous bottom — making it a decisive area for the short-term trend.
If this zone breaks, BTC could fall to a deeper support area around 111,000 USDT.
🔴 Resistance Zone: 122,000 – 123,000 USDT
This is a previous peak and a recently “false breakout” area — a strong psychological resistance.
If broken convincingly, BTC could surge to the 130,000 USDT zone (Fibonacci extension 1.618).
3. Possible Scenarios
✅ Bullish Scenario:
Price retests the 116,000 – 117,000 support zone and then bounces.
If it breaks through the 122K resistance, the next target is 130,000 USDT.
❌ Bearish Scenario:
If price breaks below MA200 and the 116K support zone → it could drop to the deeper zone around 111,000 USDT.
4. Technical Signals
There is a triangle accumulation pattern (with flat tops and bottoms).
The “false breakout” at the resistance zone shows that buyers are not yet strong enough and a retest of support is needed.
Follow the channel for the latest and continuous updates on XAUUSD, CURRENCIES, and BTC.

BTC correction august/septemberBTC has reached overbought territory, there is also bearisch divergence. It also didnt go above 123k anymore. i expect a correction in august/september.
dont chase FOMO, be prepared. Nothing goes in a straight line. there are always corrections.
CRYPTO:BTCUSD BINANCE:BTCUSD CME:BTC1! BINANCE:BTCUSDU2025

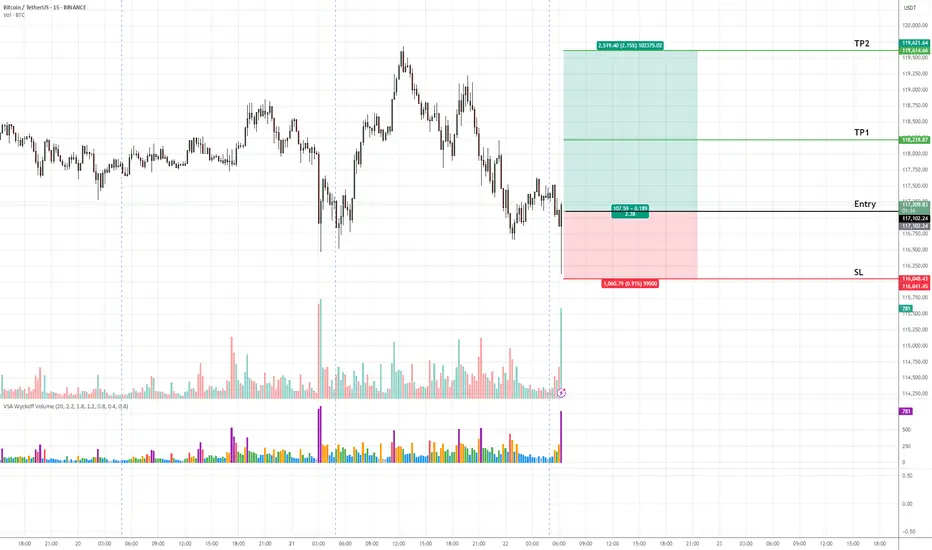
BTCUSD (Bitcoin) Buy Setup – VSA & Market Structure Analysis✅ Entry: As marked on chart
🎯 Take Profit 1 (TP1): Highlighted zone on chart
🎯 Take Profit 2 (TP2): Highlighted zone on chart
🛑 Stop Loss (SL): Defined below recent demand zone
📊 Technical Insight (VSA & Market Structure):
The recent decline into the support zone occurred on diminishing volume, indicating a lack of selling pressure.
A climactic volume spike (stopping volume) followed by a wide spread bullish candle suggests strong professional buying activity.
Subsequent bars show narrow range candles with low volume, characteristic of an absorption phase, hinting at smart money accumulation.
Price is now attempting to break above the previous minor resistance, which would confirm demand overcoming supply.
The broader market structure aligns with this setup: Bitcoin is in a higher timeframe accumulation range, and this move could initiate a markup phase as per Wyckoff/VSA principles.
📍 As long as price holds above the stop loss zone, we expect a bullish leg towards TP1 and TP2, in line with the emerging demand dominance.
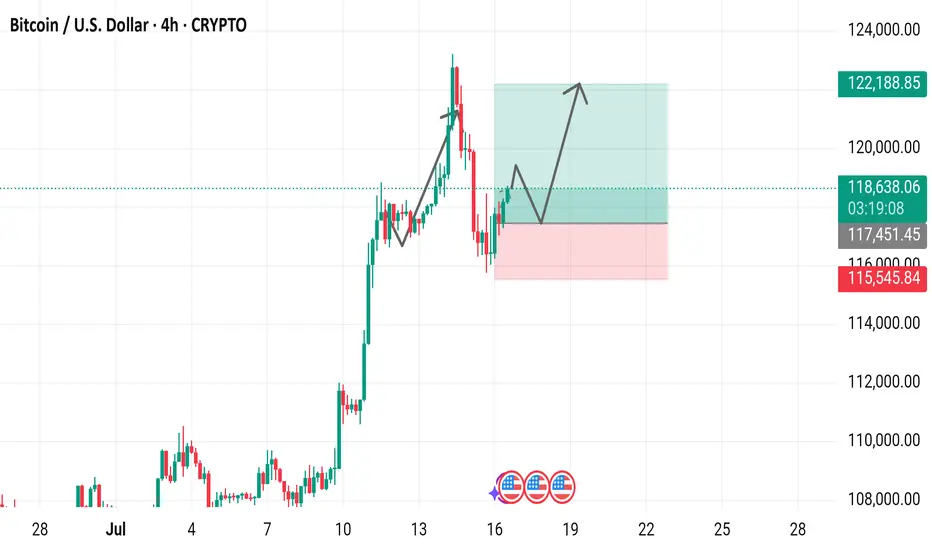
Bitcoin / U.S. Dollar 4-Hour Chart (July 2025)4-hour price movement of Bitcoin (BTC) against the U.S. Dollar (USD). The price has risen from 118,714.64 to 118,714.64 (+937.9 or +0.80%) over the period. Key levels include a support zone around 115,451.45 to 117,451.45 and a resistance zone near 120,000.00 to 122,188.85,
BTC-----Sell around 118100, target 116500 areaTechnical analysis of BTC contract on July 22:
Today, the large-cycle daily level closed with a small positive cross yesterday, and the price was below the moving average. The attached indicator was dead cross. The general trend is currently biased towards a downward trend. From the overall trend, we can see that the current trend is consistent and strong, but there is no room for rebound, and the continuous sluggish trend is also quite obvious, so the idea of selling down in the future market has become the main idea; the short-cycle hourly chart showed that the US market fell and rebounded yesterday, and the pressure continued to fall and broke down in the morning, and the correction high was near the 118000 area. The current K-line pattern is a single positive line. According to the trend rule, if the decline continues today, the rebound strength cannot be large, and the high point of the US market correction is resistance.
Today's BTC short-term contract trading strategy:
Sell at the current price of 118100, stop loss at 118500, and target 116500;

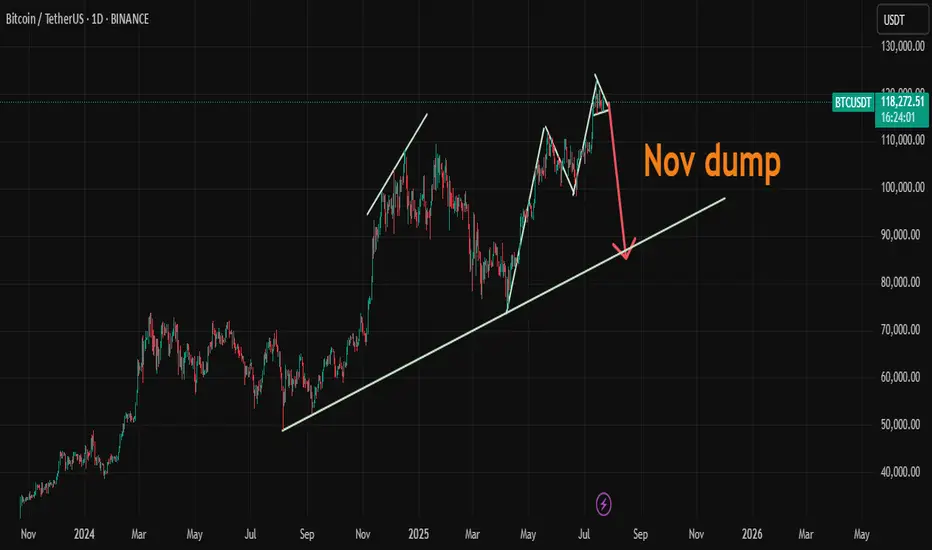
BTC/USDTHello friends, I hope you are well. We should probably expect a slight increase in Bitcoin after the big drop in the financial market, which will most likely start in November. What is your opinion?
BTCUSDT BEARISH LONG CHART ANALYSIS📉 BTCUSDT – Bearish Setup in Play (1H)
Bitcoin faces rejection near 119500 resistance and is currently trading around 117000. If price breaks below 115000, bearish momentum may extend toward the 112000 target zone.
🔸 Resistance: 119500
🔸 Support Zone: 115000
🔸 Bearish Target: 112000
Structure remains weak unless buyers reclaim 119500. Watch price action closely.
---
📌 This analysis is for educational purposes only. Trade safe and manage risk properly.

Bitcoin Trading Update: Consolidation, Patterns, and What's NextHey Fellow Traders! 👋
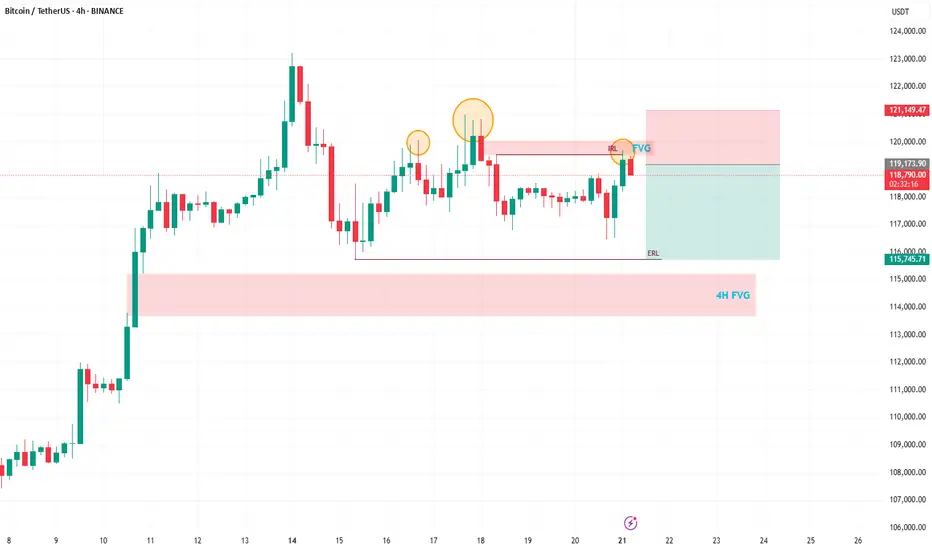
Bitcoin (BTC) has been on a wild ride after hitting its all-time high (ATH)! 📈 Since then, it’s been consolidating, generating liquidity, and setting the stage for the next big move. Meanwhile, altcoins are absolutely booming, stealing the spotlight! 💥 As we kick off the week, let’s dive into what’s happening with BTC and what to watch for.
📊 Technical Analysis Breakdown
Here’s what I’m seeing on the charts:
Head and Shoulders Pattern: A clear head and shoulders has formed on BTC, signaling a potential bearish move. 🐻
Daily Timeframe Order Blocks: These are in play, showing key levels of support and resistance.
Filled Fair Value Gap (FVG): A recent FVG on the daily chart has been filled, but there’s still a beautiful 4H FVG waiting to be tested below.
Liquidity Sweep: After the ATH, BTC needs to clear the liquidity from the past few days before it can push for new highs.
🔍 What’s Next for BTC?
I’m expecting a bearish reaction in the near term, with BTC targeting the sell-side liquidity around $115,800. This move should also fill the 4H FVG, setting the stage for a potential bounce and another shot at the ATH. 🚪 Keep an eye on these levels, as they’ll be critical for the next big move!
🔔 Stay in the Loop!
Let’s keep the conversation going! 💬 Follow for more updates, like if you found this helpful, and drop a comment with your thoughts or what you’re seeing in the markets. Are you trading BTC or riding the altcoin wave? Let’s hear it! 👇
Happy trading, and let’s make this week count! 💪
#Crypto #Bitcoin #Trading #TechnicalAnalysis