Btcupdate

#BTC Long Setup Idea – Watching Monday's LowPlan:
Will look to enter a long position if BTC sweeps Monday’s low and reclaims above with strong confirmation.
Reasoning:
• Liquidity grab below Monday’s low
• Potential bullish reversal after sweep
• Waiting for confirmation to avoid fakeouts
⚠️ Risk & Disclaimer:
• No entry without confirmation
• Use proper risk management
• Not Financial Advice – DYOR
• Trade according to your own strategy

(BTC/USD) Short Trade Setup: Key Resistance Rejection with Targe1. Entry Point: 104,855
This is where the trader plans to enter a short position (sell).
Price is slightly below this level at the moment (103,775).
2. Stop-Loss Zone: ~104,807
Highlighted in purple above the entry.
Indicates where the trader will exit if the market moves against them to limit losses.
3. Resistance Point: 103,086
This level has been tested multiple times and may act as a ceiling for prices.
If broken and held, it might invalidate the short setup.
4. Target Point: 93,159
This is the take-profit level for the short trade.
Represents a drop of approximately -10.76% from the entry point.
5. Trend Analysis:
The chart shows an uptrend leading into a potential distribution or topping pattern near the resistance zone.
A potential bearish move is anticipated, hence the short strategy.
6. Support Zones:
Highlighted in purple near the target area (around 93,159).
Historically strong buying areas.
Interpretation:
The trader expects the current resistance level to hold, prompting a downward correction toward the target zone at 93,159. If price moves above 104,807, the setup is invalidated, hence the stop-loss placement.

XAUUSD BULLISH OR BEARISH DETAILED ANALYSISXAUUSD is currently trading around 3250, consolidating within a well-defined bullish flag structure after a strong impulsive rally. This flag pattern on the 12-hour chart reflects healthy profit-taking and reaccumulation after a significant upward move. The current price action is respecting the lower boundary of the flag, and with growing volume on bullish candles, the setup suggests a high probability of a breakout to the upside, targeting the 3650 region.
From a macroeconomic perspective, gold remains in strong demand due to ongoing global uncertainties and persistent inflation concerns. The US CPI print remains sticky above 3%, keeping real yields under pressure and supporting gold's bullish bias. Furthermore, with the Fed expected to hold interest rates steady for longer, the market is starting to price in fewer rate cuts this year. This continues to undermine the USD and supports gold as a store of value. Additionally, rising central bank gold purchases and geopolitical risk premium are adding further tailwinds.
Technically, we are watching for a clean breakout above the upper flag resistance around 3280–3300. A breakout with volume confirmation would open the door toward the psychological 3400 level first, followed by a push toward the 3650 target area. Momentum indicators are turning up, and price is showing signs of basing just above previous support levels, adding confidence to the bullish continuation scenario.
Gold remains one of the strongest trending assets in 2025, and this consolidation is likely just a pause before the next leg higher. As global markets digest the impact of persistent inflation and macro volatility, precious metals like gold are likely to outperform. This flag formation provides a textbook continuation setup for traders looking to position with the broader trend.

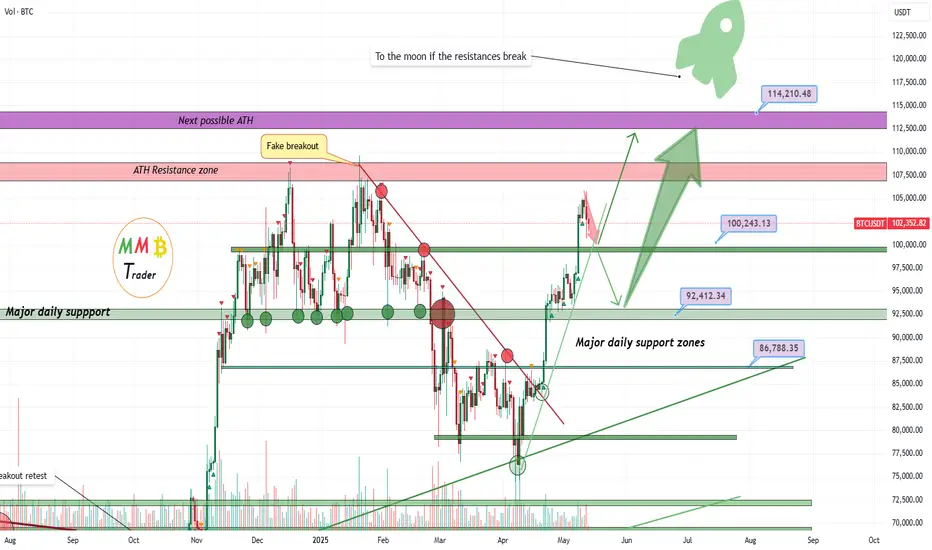
BTCUSDT major daily support zones will pump it again to new ATHAs we can see on the chart now price had a huge amount of pump from our daily low and this pump will continue to new ATH soon but for now we may have range and short-term correction first like the red arrow and then again more gain is ahead like green arrows.
DISCLAIMER: ((trade based on your own decision))
<<press like👍 if you enjoy💚
BTC Breakdown Alert: Key Support Levels in FocusDescription
#BTC If we break below the grey support zone, expect a potential move down toward the highlighted purple demand area. Watch for reaction at the grey box to determine bearish continuation or support bounce.

BTC Crossroads: Will Tariff News Trigger a Counter-Trend Move?Given the recent easing of US-China tariff tensions, Bitcoin may consolidate or experience a slight pullback as capital rotates into equities. The resulting strength in the US dollar could further contribute to a Bitcoin retracement. I'm watching for a potential counter-trend setup, specifically a short entry on a break of market structure. However, this scenario is contingent on the price action unfolding as described in the video; otherwise, the idea will be invalidated.
Not financial advice.

BTC - 180k topBTC - Local bottom was around 74k, now heading towards 180k which will be the top for this cycle.
74 – – – - – – 54 bottom.

SHARE THE IDEA ABOUT BTCUSD BEARISH PATTERNCurrent Market Overview:
Price Action: Bitcoin has rallied approximately 40% from its April lows, reaching a high near $105,525 today.
Support Levels: Key support is identified around $100,000, with additional support near $92,000.
Resistance Levels: Immediate resistance is observed around $107,000, with a potential upside target near $120,000 if bullish momentum continues.
Bearish Pattern Analysis:
While the broader trend remains bullish, certain patterns indicate possible short-term bearish movements:
Head and Shoulders Formation: Some analysts have noted a potential head and shoulders pattern forming, which could signal a reversal if confirmed.
Momentum Indicators: The Relative Strength Index (RSI) is above 70, suggesting overbought conditions that might precede a pullback.

BTC/USDTbtc is up 42% since the 74k bottom. after every pump,we have seen a 4% dip so im expecting another one here.

Bullish Tide: Are Bears Drowning as $31M Shorts VanishBullish Tide: Are Bears Drowning as FWB:31M Shorts Vanish and "Price Discovery 2" Looms?
The cryptocurrency landscape is once again electric with anticipation, and at the heart of this renewed fervor stands Bitcoin. As of May 2025, the prevailing winds appear to be firmly in the sails of the bulls. A cascade of recent market events, headlined by a dramatic $31 million liquidation of Bitcoin short positions, is sending a stark warning to pessimistic speculators. This, coupled with compelling technical analysis suggesting that Bitcoin must close the week above a crucial level to initiate 'price discovery 2', paints a picture of a market on the brink of a potentially explosive upward trajectory.
This isn't merely about fleeting price surges. Underlying these market dynamics is a growing conviction that Bitcoin doesn’t need to change; the world does. While critics often call for Bitcoin to become "faster, cheaper, greener," a powerful counter-narrative champions its existing, robust design as a solution to the inherent weaknesses of traditional systems. Adding fuel to this bullish fire is the subtle but significant trend of Bitcoin’s Quiet Coup, as wealth funds methodically build up their holdings. Furthermore, market sentiment indicators like Bitcoin funding rates remaining positive on major exchanges like Binance seem to confirm a strong, underlying uptrend. Are Bitcoin bears truly losing out, and are we witnessing the dawn of a new era for the king of cryptocurrencies?
The Cost of Doubt: $31 Million in BTC Shorts Wiped Out
The unforgiving nature of leveraged trading in the cryptocurrency markets was recently laid bare with the news that a staggering $31 million in Bitcoin short positions were liquidated. This event serves as a potent illustration of the risks involved in betting against Bitcoin's momentum, especially in the current climate.
Short selling in the crypto sphere, much like in traditional markets, involves traders borrowing Bitcoin, selling it with the expectation that its price will fall, and then planning to buy it back at a lower price to profit from the difference. However, the crypto markets are known for their high volatility and the widespread use of leverage, particularly in perpetual futures contracts. Leverage allows traders to control a much larger position than their initial capital would normally allow, amplifying potential profits but also, crucially, potential losses.
When the market moves sharply against a leveraged short position – meaning Bitcoin's price surges upwards – traders can face a margin call. If they cannot add more funds to cover their mounting losses, the exchange automatically closes their position to prevent further debt. This forced closure is a liquidation. The $31 million wipeout signifies that a substantial volume of bets on Bitcoin's price decline was overwhelmed by a potent wave of buying pressure.
This mass liquidation event has several implications. Firstly, it inflicts significant financial pain on those who were positioned for a downturn, effectively Bitcoin bears losing out on their wagers. Secondly, these forced closures inherently involve buying Bitcoin to cover the short positions, which paradoxically adds more fuel to the upward price movement. This can trigger a "short squeeze," where rising prices force more shorts to cover, leading to further liquidations and an accelerated price rally. Such events bolster bullish sentiment, demonstrating underlying market strength and deterring further aggressive short selling. It’s a clear signal that the market's undercurrent was far more robust than the bears had anticipated.
On the Cusp of a New Frontier: The Critical Weekly Close and "Price Discovery 2"
The excitement among Bitcoin proponents is palpable, with many analysts asserting that Bitcoin bulls are on the cusp of launching the market back to all-time highs and beyond. Central to this optimistic outlook is the focus on an upcoming, crucial weekly close. According to prevailing technical analysis, Bitcoin must close the week above a specific, strategically important price level to start 'price discovery 2'.
"Price discovery" is the process by which market participants determine the fair value of an asset through their buying and selling activities. When an asset like Bitcoin surpasses its previous all-time high (ATH), it enters a phase where historical resistance levels cease to exist. This is true price discovery – the market is venturing into uncharted territory, with no past price ceilings to act as psychological or technical barriers. "Price Discovery 1" can be considered Bitcoin's journey to its previous peak (around $69,000 in November 2021). The term "Price Discovery 2" thus implies a new, sustained bull run that would take Bitcoin significantly beyond that former zenith.
The significance of a "weekly close" above a key resistance level cannot be overstated in technical analysis. Weekly charts smooth out short-term noise and are often seen as better indicators of major trend shifts. A decisive weekly close above, say, the previous ATH or a major interim peak, would be a powerful confirmation for many traders and investors that the bulls are firmly in control. It would invalidate bearish scenarios that predicted a rejection at these upper levels and would likely attract a fresh wave of capital into the market.
Several potent catalysts could fuel this ascent into "Price Discovery 2." The quadrennial Bitcoin halving event, the most recent of which occurred in April 2024, historically constricts the new supply of Bitcoin, often leading to significant price appreciation in the months and years that follow as demand outstrips this reduced supply. Continued institutional adoption, evidenced by wealth funds accumulating Bitcoin, provides a steady stream of large-scale buying pressure. Furthermore, a challenging macroeconomic environment, characterized by persistent inflation in major fiat currencies or geopolitical uncertainties, can enhance Bitcoin's appeal as a non-sovereign store of value and a hedge against systemic risks. Should Bitcoin achieve this critical weekly close and embark on "Price Discovery 2," the upside could be substantial, as the market seeks to establish a new equilibrium in uncharted price territory.
The Unwavering Standard: Bitcoin Doesn’t Need to Change, The World Does
Amidst the price charts and market analyses, a more profound narrative is solidifying: Bitcoin doesn’t need to change; the world does. For years, critics have argued that Bitcoin should be faster, cheaper, greener, often comparing its transaction throughput or energy consumption to centralized payment networks or newer, less proven blockchain protocols. However, an increasing number of proponents argue that maybe the point isn’t to fix Bitcoin. Maybe it’s to fix everything else with Bitcoin.
This perspective champions Bitcoin's core attributes – often perceived as limitations by detractors – as its most vital strengths:
• Unparalleled Decentralization: Bitcoin operates on a globally distributed network with no single point of control. This makes it resistant to censorship, shutdown, or manipulation by any government or corporation. In an age of increasing financial surveillance and control, this is a feature, not a bug.
• Robust Security and Immutability: The Proof-of-Work (PoW) consensus mechanism, while energy-intensive, is what underpins Bitcoin's formidable security. The immense computational power dedicated to mining creates an economic fortress around the network, making its transaction history virtually tamper-proof. While the "greener" argument often pushes for alternatives like Proof-of-Stake (PoS), many believe PoW offers a unique level of objective security crucial for a global store of value. Moreover, the narrative around Bitcoin's energy use is evolving, with increasing adoption of renewable and stranded energy sources for mining, and a growing recognition that its energy consumption is a worthwhile trade-off for securing a truly independent financial system.
• Absolute Scarcity: Bitcoin's supply is capped at 21 million coins, a hard-coded limit that cannot be altered. This programmatic scarcity makes it a powerful antidote to the inflationary pressures inherent in fiat currencies, which can be created limitlessly by central banks. This "digital gold" characteristic is fundamental to its value proposition.
• Layered Scaling: While the Bitcoin base layer prioritizes security and decentralization over raw transaction speed, innovation is flourishing on Layer 2 solutions like the Lightning Network. These protocols enable fast, low-cost transactions by batching them off-chain and settling them periodically on the main Bitcoin blockchain, thus allowing Bitcoin to scale for everyday payments without compromising its core principles.
The argument is that instead of trying to mold Bitcoin to fit the constraints of the old financial world, we should recognize how its unique properties can address the systemic flaws within that world – issues like inflation, financial exclusion, censorship, and counterparty risk. Bitcoin, in its current form, offers a radical, resilient alternative.
The Silent Infiltration: Wealth Funds Build Up Bitcoin Holdings
Further bolstering the bullish case is the ongoing, often understated, trend of Bitcoin’s Quiet Coup: Wealth Funds Build Up Holdings. This isn't about flashy headlines but rather a methodical, strategic accumulation of Bitcoin by sophisticated institutional investors, including pension funds, endowments, sovereign wealth funds, and large family offices.
These entities, traditionally conservative and managing trillions of dollars in assets, are increasingly allocating a portion of their portfolios to Bitcoin. Their motivations are manifold:
• Diversification: Bitcoin has historically exhibited low correlation with traditional assets like stocks and bonds, making it an attractive addition for enhancing portfolio risk-adjusted returns.
• Inflation Hedge: In an environment of persistent global inflation, Bitcoin's finite supply positions it as a potential store of value, a digital hedge against currency debasement.
• Asymmetric Upside: Even a small allocation to Bitcoin can offer significant upside potential, an appealing proposition for large funds seeking growth.
• Growing Regulatory Clarity and Infrastructure: The approval of Bitcoin ETFs in major jurisdictions like the U.S. has provided regulated and accessible avenues for institutional investment, alongside the development of institutional-grade custody and trading solutions.
This "Quiet Coup" signifies a maturing perception of Bitcoin, moving it from a speculative niche asset to a legitimate component of institutional investment strategy. The steady inflow of significant capital from these large players not only provides price support but also lends credibility and encourages further adoption, potentially reducing long-term volatility as more Bitcoin is held by entities with long-term horizons.
Reading the Bullish Tea Leaves: Bitcoin Funding Rates Remain Positive
Adding another layer of confirmation to the prevailing bullish sentiment is the observation that Bitcoin Funding Rates Remain Positive On Binance — Strong Uptrend Confirmed? Funding rates are a key mechanism in cryptocurrency perpetual futures markets, designed to keep the price of the perpetual contract aligned with the spot price of the underlying asset.
When funding rates are positive, it generally means that traders holding long positions (betting on a price increase) are paying a premium to those holding short positions. This indicates a higher demand for long leverage, reflecting overall bullish sentiment in the derivatives market. Consistently positive funding rates on a major exchange like Binance, which boasts significant trading volume, suggest that this optimism is sustained. It implies that traders are confident enough in Bitcoin's upward trajectory to pay a recurring fee to maintain their leveraged long positions.
While extremely high funding rates can sometimes signal an over-leveraged market ripe for a correction (a "long squeeze"), moderately and persistently positive rates, as currently observed, are often interpreted as a healthy sign of a strong and well-supported uptrend. It suggests that the rally is not just speculative froth but is backed by conviction among active traders.
Conclusion: A Perfect Storm for Bitcoin's Next Chapter?
As May 2025 progresses, the confluence of factors points towards a potentially transformative period for Bitcoin. The $31 million decimation of short positions serves as a stark reminder of the perils of underestimating Bitcoin's strength. The market's eager anticipation of a weekly close that could unlock "Price Discovery 2" highlights the potent bullish technical setup. This is further reinforced by the fundamental conviction that Bitcoin's core design is its ultimate strength, offering solutions the traditional financial world desperately needs.
The quiet, strategic accumulation by wealth funds injects not only capital but also a profound sense of legitimacy, while positive funding rates reflect a confident and sustained bullish sentiment among active traders. While the path ahead will undoubtedly feature volatility – a characteristic inherent to Bitcoin's journey – the current alignment of technical indicators, institutional adoption, strong market sentiment, and a compelling fundamental narrative suggests that Bitcoin bears may indeed be losing out, and significantly so. The stage appears set for Bitcoin to not only challenge its previous highs but to potentially embark on a new, exhilarating phase of growth and adoption, further solidifying its role in the evolving global financial order.

BTCUSDT SHORTHere’s the translation for your analysis:
"The price here is a good level to open a sell position. The future buy and sell levels I've marked are based on the perspective it creates for us, but for now, it's just a viewpoint."
ITS POSSIBLE SCENARIO FOR BTCUSDT.

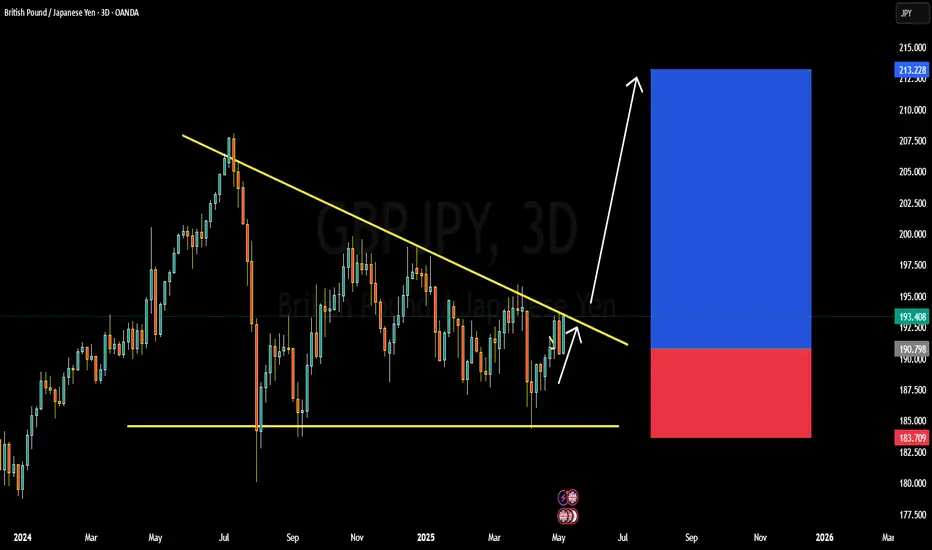
GBPJPY BULLISH OR BEARISH DETAILED ANALYSISGBPJPY is currently trading near 190.80 and is forming a significant breakout structure on the 3-day chart. After months of consolidation under a descending trendline, the pair is now coiling tightly, signaling a potential bullish breakout. The pair has respected the lower support range near 183.70 while pushing up against descending resistance multiple times. This squeeze pattern often precedes a major directional move, and with bullish momentum building, GBPJPY could be primed for a rally toward the 210.00 zone.
Fundamentally, the British pound is finding strong support from the latest hawkish commentary by the Bank of England, which has hinted that inflation remains sticky, keeping rate cut expectations delayed. On the other hand, the Japanese yen remains under consistent pressure due to the Bank of Japan's ultra-dovish stance and yield curve control policies. The BoJ’s reluctance to shift its policy outlook, coupled with soft macro data from Japan, is weakening the yen across the board.
Technically, a breakout and close above the descending trendline around 194.00 will be a key confirmation point. If this happens, bulls could dominate and push GBPJPY toward the 210.00 resistance zone in the medium term. The R\:R on this setup remains favorable with stops safely tucked below 183.70, giving this trade strong upside potential.
This pair is currently one of my top watchlist setups for May as both the technical and fundamental landscapes align. With bullish sentiment driving GBP strength and JPY weakness being a prevailing macro theme, GBPJPY could deliver a powerful upside continuation if the breakout confirms.
$BTC Looking Bullish CRYPTOCAP:BTC $104,987 resistance testing, as expected some struggle here at given key resistance area. $103,093 support tested and holding as of now, Bullish engulfing on last 1D close, need to see if it gets follow thru Today. RSI on 1D in oversold region, 4H RSI looking good, 18H left to close current weekly, looking bullish as MACD turns green, $99,361 remains key support, current support range $103,093-$102,280.

BTC in 17 April 2025Potential Major Move on Thursday, April 17, 2025 📍
📊 Based on an analysis of historical Bitcoin chart averages and similar patterns, there is a likelihood of a significant price movement on this date.
This analysis is conducted using technical analysis and a detailed examination of Bitcoin’s movement averages. It suggests that approximately every 150 days after the start of a neutral trend, we can expect a sharp upward or downward move that sets the stage for the main trend in the future.
📅 As of the current date, March 29, 2025, there are about 18 days left until this significant event.
You can follow the results of this analysis and the conducted review on TradingView on the specified date.

BTC LONG TP:105,300 10-05-2025🚀 Bullish continuation in play!
We’re going LONG with a target at 105,300, following a clear continuation pattern on the 1H chart 📈
Entry zone is between 102,500 and 103,200 — a clean range to stack your position.
This move should develop over the next 6 to 8 hours, so precision and timing are key ⏳
Price action shows strength, and the momentum is still on our side.
Manage your stop in a way that fits your personal strategy — stay sharp, trade smart.
Follow me for updates and let’s bag those greens together 💰🔥
#BTC #PriceAction #Reydragon2

(BTC/USD) 1H Trade Setup – Key Entry, Stop Loss & Dual TargetEntry Point: 95,431
Stop Loss: 95,264
Target Points:
Upside (Target 1): 100,674 (Potential gain: +5.36%)
Downside (Target 2): 86,614 (Potential loss: -7.57%)
Trade Setup:
Risk-Reward Ratio:
Approx. 1:0.7 (Not ideal; the reward is smaller than the potential loss)
Support Zones:
Highlighted in purple beneath the entry zone — this indicates a historically strong support area.
Resistance Zones:
The upper purple zone marks the next significant resistance around 100,000–100,795.
Technical Indicators:
50 EMA (Blue Line): Indicates mid-term trend support, currently holding price action.
Price Action: BTC appears to be retracing toward support after a bullish rally.
Interpretation:
The setup implies a long (buy) position with a very tight stop loss.
The price is nearing a support zone, and if it holds, there's potential for an upward move to the target at 100,674.
However, if price breaks below 95,264, a sharp drop to 86,614 is anticipated.

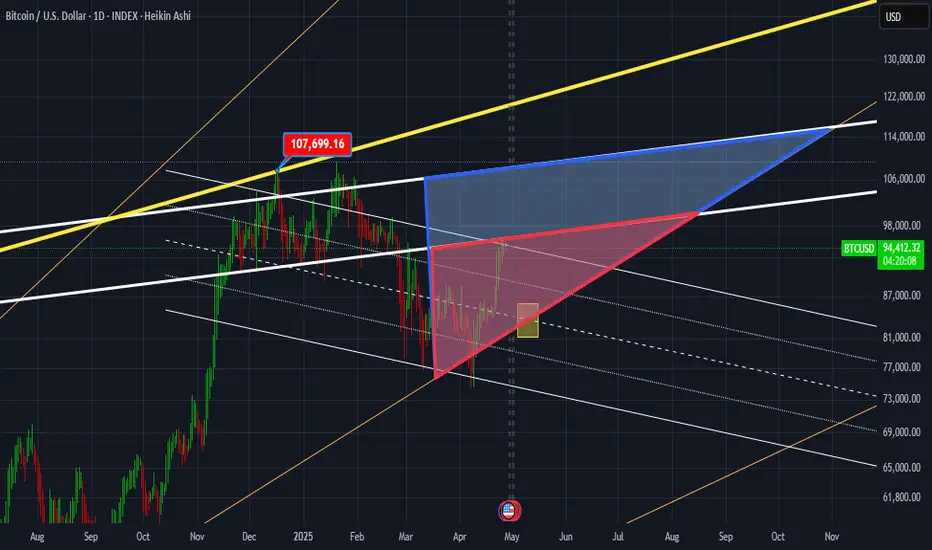
BTC in Bermuda triangle!I love shapes. Shapes have a rich and deep philosophy and give you an idea of what's going on in the mind of market's major players. BTC is no longer an infant, in fact, just like you, it's getting older and older everyday! "Now" the market movements are far beyond simple pump and dumps. No more slides in the park for baby bitcoin! Watch the small red triangle and the big blue one. The lovely yellow rectangle waves hands!
BTC Overextended: Awaiting the Perfect Pullback for a BuYBTC/USDT Analysis – 1D Timeframe
Bitcoin is currently looking overextended on the daily chart 📈, with price action pushing directly into a well-defined key resistance level 🚧. This area has historically acted as a strong supply zone, and with momentum appearing stretched, I’m anticipating a potential retracement in the near term.
My plan is to wait for BTC to pull back towards previous support zones Around the 61.8 Fibo level🛡️. I have a clear Point of Interest (POI) marked out, where I’ll be watching for price to react. If we see a bullish Break of Structure (BOS) on the pullback—I’ll be looking for a long entry from this area 🎯.
Key Levels to Watch:
Resistance: Current daily highs (where price is overextended) 🚩
Support/POI: Previous consolidation and demand zones below, which have shown strong buying interest in the past 🏦
Trade Plan:
- No FOMO entries at resistance! ❌
- Wait for a clean retrace into my POI
- Look for bullish confirmation (BOS) on lower timeframes before entering long ✅
- Manage risk accordingly and trail stops if the move plays out
Summary:
Patience is key here. I’m not interested in chasing price into resistance. Instead, I’ll let the market come to me and only act if my criteria are met. If BTC gives us the pullback and a bullish BoS, I’ll be ready to take the trade. Until then, I’m on the sidelines and monitoring price action closely 👀.
Disclaimer:
This analysis is for educational purposes only and does not constitute financial advice. Always do your own research and manage your risk appropriately. Trading cryptocurrencies involves significant risk and may not be suitable for all investors. 🚨

$BTC Daily Update - Back above $100KCRYPTOCAP:BTC : Well, Hello! $100K!!!😍
$102,280 support in effect currently, $103,093 resistance testing, current 1W candle looking mighty bullish, RSI looking good on 1D and 4H, $104,987 next key resistance, $99,361 current key support.

Bitcoin Hits $100K: Bull Run IgnitesWhat Tariff Shock? Bitcoin Surges Past $100K as Market Recovery Continues
The cryptocurrency market has been making headlines again as Bitcoin (BTC) surges past the $100,000 mark, signaling a robust recovery and potentially the start of a new bull cycle. In an environment marked by economic uncertainty, geopolitical tensions, and fluctuating central bank policies, Bitcoin’s remarkable resurgence has captured the attention of retail investors, institutional participants, and financial analysts alike.
This article delves into multiple facets of Bitcoin’s ongoing rally, including its recent rebound after a sharp drop, the role of whales in fueling the push toward $100K, the realized cap hitting a record high, and whether aggressive profit-taking by investors signifies a local top. Additionally, we’ll explore the implications of Bitcoin's return to $100K and why it hints at a "significant price move" that could shape the broader financial landscape.
________________________________________
Bitcoin Rebounds After Sharp Decline: The $100K Push
Bitcoin’s journey to $100,000 has been anything but smooth. After experiencing a sharp correction earlier in the year, many market participants feared that the cryptocurrency's bull run was over. However, Bitcoin's ability to rebound from its lows with renewed vigor has defied expectations.
Whales Drive the Rally
One key factor behind Bitcoin’s resurgence is the activity of "whales," large-scale investors who hold significant amounts of BTC. On-chain data reveals that whales have been accumulating Bitcoin during periods of lower prices, effectively acting as a stabilizing force during market downturns. By reducing liquidity in the market and concentrating their holdings, whales have created conditions conducive to a price surge.
In addition, whale wallets have been observed transferring large sums of Bitcoin out of exchanges and into cold storage, signaling a long-term bullish outlook. This withdrawal pattern reduces the supply of Bitcoin available for trading, increasing upward pressure on the price.
________________________________________
Realized Cap Hits Record High: A Bullish Signal
Another notable development supporting Bitcoin's rally is its realized capitalization (realized cap) hitting an all-time high. Unlike market capitalization, which multiplies the total supply of Bitcoin by the current price, the realized cap calculates the value of each Bitcoin at the price it was last moved. This metric provides a clearer picture of the aggregate cost basis of Bitcoin holders.
The realized cap reaching a record high indicates that a significant portion of Bitcoin has changed hands at higher price levels, reflecting increased investor confidence. This metric aligns with the narrative of accumulation, as both retail and institutional investors appear to be buying Bitcoin at higher prices in anticipation of future gains.
Accumulation Continues
On-chain analytics reveal that accumulation trends have persisted throughout Bitcoin's recovery. Wallet addresses holding between 1 and 10 BTC have grown substantially, showing that smaller investors are also entering the market. This broad-based accumulation not only adds to Bitcoin's bullish momentum but also reduces volatility by distributing supply across a wider range of participants.
________________________________________
Profit-Taking and Local Top Concerns
While Bitcoin's surge past $100,000 has been met with enthusiasm, some analysts caution that aggressive profit-taking by investors could signal a local top. Short-term holders, in particular, have been selling their Bitcoin to lock in gains, as evidenced by the increasing Spent Output Profit Ratio (SOPR).
Signs of a Local Top?
A high SOPR indicates that investors are realizing profits at a significant rate, which often coincides with price corrections. However, it’s important to note that profit-taking is a natural part of any market cycle and does not necessarily signal the end of a bull run. In fact, periods of consolidation and minor corrections can strengthen the foundation for a more sustainable rally.
Market sentiment, as measured by the Fear & Greed Index, has also entered the "Greed" zone, suggesting that bullish enthusiasm may be running high. Historically, extreme greed has preceded short-term pullbacks, making it crucial for investors to remain cautious.
________________________________________
New Bull Cycle? Bitcoin’s Return to $100K Hints at Significant Price Move
Bitcoin’s return to the $100,000 milestone has rekindled hopes of a new bull cycle, with analysts pointing to several factors that support this narrative. The cryptocurrency market has historically moved in cycles, driven by supply-demand dynamics, macroeconomic conditions, and technological advancements. The current environment appears to align with the early stages of a new bull phase.
Institutional Adoption and Macro Tailwinds
Institutional interest in Bitcoin has grown exponentially over the past few years. Major financial institutions, including hedge funds, pension funds, and publicly traded companies, have embraced Bitcoin as a hedge against inflation and a store of value. This influx of institutional capital has not only validated Bitcoin’s role as a legitimate asset class but also provided a steady source of demand.
Moreover, macroeconomic tailwinds such as high inflation, declining confidence in fiat currencies, and geopolitical instability have enhanced Bitcoin's appeal as a decentralized, non-sovereign asset. Central banks’ monetary policies, including quantitative easing and low interest rates, have further eroded the purchasing power of traditional currencies, driving investors toward Bitcoin.
Supply Shock and Halving Cycles
Bitcoin’s fixed supply of 21 million coins and its halving cycles play a crucial role in its price dynamics. The most recent halving in 2024 reduced the block reward for miners, effectively decreasing the rate at which new Bitcoin enters circulation. This supply shock, coupled with growing demand, has historically preceded significant price rallies.
On-chain data shows that long-term holders, who typically accumulate Bitcoin during bear markets, are now distributing their holdings during this bull phase. This redistribution of supply suggests that a new wave of investors is entering the market, further fueling the rally.
________________________________________
What’s Next for Bitcoin?
As Bitcoin continues to defy expectations, the question on everyone’s mind is: What’s next? While predicting Bitcoin’s price movements with precision is challenging, several scenarios could play out in the near term.
Scenario 1: Sustained Bull Run
If accumulation trends persist and institutional interest continues to grow, Bitcoin could maintain its upward trajectory, potentially reaching new all-time highs. Key resistance levels to watch include $120,000 and $150,000, which could serve as psychological barriers for further price appreciation.
Scenario 2: Short-Term Correction
A short-term correction is always a possibility, especially given the aggressive profit-taking observed in recent weeks. However, such corrections are often healthy for the market, allowing for consolidation and setting the stage for more sustainable growth.
Scenario 3: Macro-Driven Volatility
External factors, such as changes in monetary policy, regulatory developments, or geopolitical events, could introduce volatility to the market. While Bitcoin has shown resilience in the face of macroeconomic challenges, it remains sensitive to major news events.
________________________________________
Conclusion
Bitcoin’s surge past $100,000 marks a pivotal moment for the cryptocurrency market, signaling a robust recovery and the potential start of a new bull cycle. Driven by whale activity, record-high realized capitalization, and persistent accumulation, Bitcoin has defied skeptics and reasserted its dominance as the leading digital asset.
While concerns about a local top and profit-taking are valid, the broader trends suggest that Bitcoin is preparing for a significant price move. Whether this rally leads to sustained growth or faces temporary setbacks, one thing is clear: Bitcoin remains a transformative force in the financial world, offering a decentralized, inflation-resistant alternative to traditional assets.
As we look ahead, the combination of institutional adoption, macroeconomic tailwinds, and Bitcoin’s unique monetary policy positions it for continued success. For investors and enthusiasts, the journey to $100,000 and beyond is more than just a milestone—it’s a testament to the enduring promise of blockchain technology and the future of decentralized finance.

BTC Fractal Update!!CRYPTOCAP:BTC is repeating the same ABC pattern that led to past 70 %+ rallies.
We're now at a decision point — next weekly close will confirm:
Scenario 1: Rejection Below $96K (Circle 1)
→ Likely dip to $78K–$80.5K (channel bottom + 0.5 Fib)
→ Final shakeout before major move.
Scenario 2: Breakout Above $96K (Circle 2)
→ Retest at $90.5K
→ Then rally toward $160K+ begins (Circle 3)
BTC is hovering near the $100K mark — up 5% from the $96K breakout — mirroring the previous breakout from $63K (Circle 2), where it surged to $ 67K (+5%) before a sharp retest to $59.2K, followed by a major rally.
A similar healthy retest could be on the cards before CRYPTOCAP:BTC breaks its ATH!
If you find this analysis helpful, please hit the like button to support my content! Share your thoughts in the comments, and feel free to request any specific chart analysis you’d like to see.
Happy Trading!!

It’s ready to move!#BTC
👍👀 Daily Timeframe
Volume has dropped at the end of the bullish move.
Price is currently ranging in a decision zone.
✅ BTC is holding above the key 91,640 level. As long as it remains stable above this zone, there’s potential for a move toward the $100K area.
⚠️ As shown in the chart, $100K will act as a major resistance level before any attempt to reach $110K.
⚡ Meanwhile, price is testing the pivot zone around $97,400 — the same level that rejected the last bullish attempt.
So far, no strong reversal signals from this zone.
❌ But if price gets rejected again, we could see a breakdown below $93,700 and a retest of the support zone around $91,640.
💵 This support needs to hold for the bullish structure to stay intact.
✅ Historically, this level has repeatedly prevented BTC from dropping toward the $77K zone.
📈 I’m currently watching for a long setup, which will trigger only after a clear breakout above 97,400.
📉 For a short position, I’ll wait for a confirmed breakdown below 91,640.
