BTCUSDT|LONG"After analyzing the left side of the market and its historical price action, I believe the 90.747 level is a strong area to place a buy order, with clearly defined stop-loss and take-profit levels."
Btcupdate

Revisiting Bitcoin CyclesAs you can see we might be half way of the bull market phase for this cycle(green emas). These green emas reflecting the bull phase have been increasing in duration over history. This time we might see it lasting for about 1000 days. We are currently about 500 days since this green trend started , so we might see the best coming soon. Once these emas shift to green it will mark the start of the downtrend. Make sure to take some profits once we are approaching to day 1000 or you will have to wait about 4 more years to see these prices.

BTC/USD) breakout up trand analysis Read The ChaptianMr SMC Trading point update
bullish analysis of Bitcoin (BTC/USD) on the 4-hour timeframe, showing a potential breakout and rally scenario. breakdown:
---
1. Market Structure:
Downtrend Channel: Price has been moving within a falling channel.
Double Bottom Pattern: Marked by two green arrows — a bullish reversal signal.
Breakout Attempt: Price is testing the upper trendline and 200 EMA (~$83,952), suggesting possible breakout.
---
2. Key Zones:
FVG (Fair Value Gap): Around $78,678 — a demand zone where price could retest before moving higher.
Breakout Confirmation Zone: ~$85,130 — breaking above this with volume signals strength.
Target Point: $95,206 — an upside target projecting ~31.77% gain from the breakout.
---
3. Indicators:
200 EMA: Currently acting as resistance. Break above it confirms bullish momentum.
RSI: Around 60 — pointing upward with bullish divergence from recent lows, showing increasing buying pressure.
---
4. Scenarios:
Scenario 1 (Bullish Continuation):
Breaks above trendline and 200 EMA.
Retest (optional) and then heads toward $95,206 target.
Scenario 2 (Retest First):
Price dips into the FVG/demand zone.
Finds support and launches upwards, confirming a strong base.
Mr SMC Trading point
---
Summary of the Idea:
This is a buy setup on breakout or on pullback:
Aggressive Entry: Break and close above $85,130.
Safe Entry: Pullback into $78,678 area (FVG).
Target: $95,206
Risk Zone: Below $78,000 (invalidates bullish structure).
Pales support boost 🚀 analysis follow)

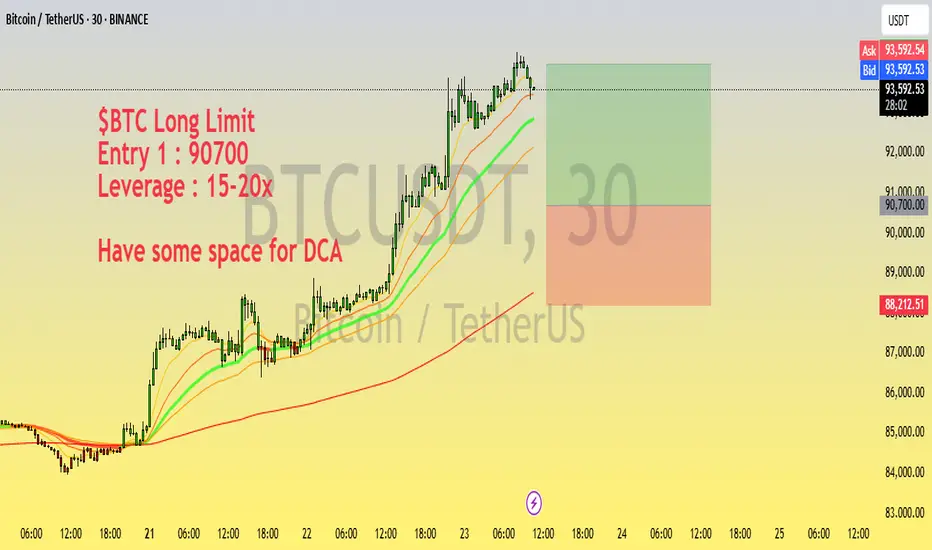
$BTC Long Setup | Entry @ 90700 | 15-20x Leverage | DCA FriendlyLooking to long BTC from the 90,700 zone with a high-conviction setup on support.
Trade Plan:
Entry 1: 90,700
Leverage: 15-20x
Setup: Price holding above key support with bullish structure forming on lower timeframes
Note: Leave room for DCA if price dips further
Monitor closely for reaction around support — tight SL recommended for capital protection.
Disclaimer: Not financial advice. DYOR and manage your risk accordingly.
BTC/USD 1H – Bullish Breakout with FVG Entry & $91K TargetChart Breakdown:
📈 Trend Structure:
BTC is moving in an ascending channel with:
🔵 Resistance Line on top
🟢 Support Line below
🔁 Recently, it broke out above the resistance with a bullish move!
Key Zones & Levels:
🟦 Fair Value Gap (FVG)
This is your potential buy zone:
✅ Entry Point: $86,135
❌ Stop Loss: $85,098
🎯 Target: $91,000
📌 Plan:
Wait for price to retrace into the FVG zone
Look for a bullish bounce ✅
Enter long at $86,135
Set your SL and target accordingly
Risk-Reward Setup:
Risk: Small (below FVG zone) ❗
Reward: Big upside toward $91,000 🚀
Gain Potential: +5.74% ($4,948 per BTC)
Visual Flow:
1️⃣ Price breaks resistance 🔼
2️⃣ Pullback expected to FVG 🔽
3️⃣ Entry triggers around $86,135
4️⃣ Targeting moon shot to $91K 🌕
Conclusion:
This setup shows a bullish continuation with solid RR.
If BTC holds the FVG on a retest, the move to $91K looks likely!

BITCOIN (BTC) Trading Plan.Bitcoin (BTC) Trading Plan:
Resistance Level: $88,000
Support/Channel Level: $85,000
Target Levels:
If price rejects $88,000 and breaks below $85,000,
Sell target: $78,000
If price holds above $85,000 and breaks out above $88,000,
Buy target: $93,000

Forget Tariffs: Why Bitcoin Cares More About ETFs Than EarningsBitcoin's Great Decoupling: Why It Ignores Tariffs and Earnings, Fueled by Fundamentals and ETF Billions
In the complex tapestry of global finance, assets typically dance to the tune of macroeconomic news, central bank policies, corporate earnings reports, and geopolitical tensions like trade tariffs. Stocks rise on strong profits, bonds react to interest rate shifts, and currencies fluctuate with trade balances. Bitcoin, however, increasingly appears to be charting its own course, seemingly indifferent to the traditional market drivers that dictate the movements of legacy assets. This phenomenon, often termed "decoupling," isn't just a statistical anomaly; it's rooted in Bitcoin's fundamental nature and is gaining significant validation through the burgeoning success of US-listed Bitcoin Exchange Traded Funds (ETFs).
The core argument, as highlighted in recent market commentary, is compelling: Bitcoin's value proposition isn't tied to quarterly earnings calls, CEO performance, or the potential impact of import tariffs. It has no central bank adjusting its supply or setting its interest rate. Instead, its perceived value stems from a unique set of characteristics: verifiable digital scarcity capped at 21 million coins, a decentralized network resistant to single points of failure or control, and an emerging role as a neutral, global reserve asset in an increasingly politicized and fragmented world.
Fundamentals Over Fleeting News Cycles
Traditional assets are intrinsically linked to the health of economies and corporations. A weak earnings report can send a stock tumbling, while fears of a trade war can ripple through entire sectors. Bitcoin exists outside this framework. Its "earnings" are the security and finality provided by its blockchain; its "management" is the distributed network of miners and nodes enforcing consensus rules; its "monetary policy" is embedded in its immutable code.
This inherent separation means that while traditional markets might gyrate based on the latest Federal Reserve announcement or geopolitical flare-up, Bitcoin's trajectory is often more influenced by factors specific to its own ecosystem: adoption rates, network upgrades, regulatory clarity (or lack thereof), halving events that reduce new supply issuance, and, crucially, capital flows into vehicles that provide access to it.
The narrative suggests Bitcoin is maturing into something akin to a digital version of gold – an asset valued for its scarcity and neutrality, acting as a potential hedge against inflation, currency debasement, and systemic risks within the traditional financial system. In a world grappling with high debt levels, persistent inflation, and geopolitical instability (like the mentioned US trade war volatility), the appeal of a non-sovereign, mathematically scarce asset grows.
ETF Inflows: A Roaring Stamp of Approval
The most potent evidence supporting this decoupling narrative and Bitcoin's growing acceptance comes from the recent performance of US spot Bitcoin ETFs. Launched earlier in the year, these products represented a watershed moment, providing regulated, accessible exposure for institutional and retail investors alike through traditional brokerage accounts.
Recent data underscores their impact. On April 21st, these ETFs collectively witnessed their largest single-day net inflows since the initial launch frenzy in January, pulling in a remarkable $381.3 million. This surge in demand, with notable contributions like the $116.1 million flowing into the RK 21Shares Bitcoin ETF (ARKB), coincided directly with significant positive price action. Bitcoin decisively broke through previous resistance levels, reclaiming the $91,000 mark after a seven-week consolidation period.
These inflows are more than just numbers; they represent a tangible shift in capital allocation. They signal growing institutional comfort and strategic positioning in Bitcoin. Unlike speculative futures-driven rallies, inflows into spot ETFs reflect direct demand for the underlying asset, potentially building a more stable foundation for price appreciation. This influx suggests investors aren't just chasing momentum but are making longer-term allocations, viewing Bitcoin as a legitimate component of a diversified portfolio, independent of its correlation (or lack thereof) to other asset classes.
Price Action, Leverage, and the Path Ahead
The technical picture for Bitcoin has brightened considerably alongside these fundamental drivers. The recent surge saw Bitcoin break key bearish structures, establishing a higher low that many traders see as a potential launchpad for challenging previous all-time highs. The reclaiming of the $91,000 level was a significant psychological victory for bulls, reinforcing the positive sentiment fueled by the ETF flows. Market participants are now eyeing levels like the yearly open around $93,000 as the next major hurdle.
However, caution remains warranted. Analysts note that recent price surges have often been accompanied by significant leverage in the derivatives market. While leverage can amplify gains and accelerate upward moves, it also increases volatility and the risk of sharp liquidations if the market turns. The critical question is whether the consistent spot buying, particularly through ETFs, can absorb selling pressure and provide the underlying support needed to sustain these higher price levels. A rally built predominantly on leverage without corresponding spot demand is often viewed as less stable.
The comparison to gold's comeback potential amidst trade tensions is intriguing, but Bitcoin still needs to prove its resilience. While it has demonstrated periods of acting as a safe-haven asset, its correlation to risk assets like tech stocks can reappear, especially during broad market liquidity crises. The "decoupling" is not absolute, but rather a dominant trend driven by its unique value proposition gaining traction.
Conclusion: A Maturing Asset Forging Its Own Path
Bitcoin's recent performance, marked by significant ETF inflows and a price surge seemingly disconnected from traditional market anxieties like tariffs and earnings reports, lends strong support to the decoupling narrative. Its fundamental characteristics – scarcity, decentralization, and neutrality – are increasingly resonating in a complex global environment. The success of spot Bitcoin ETFs provides a regulated gateway for broader adoption and serves as tangible proof of growing institutional and retail demand, validating Bitcoin's role as an emerging reserve asset.
While challenges remain, including inherent volatility, regulatory uncertainties, and the need for spot demand to underpin leverage-driven moves, the trend is undeniable. Bitcoin is increasingly trading based on its own unique supply/demand dynamics and its perceived role in the future financial landscape, rather than simply mirroring the movements of traditional markets. It doesn't care about Q3 earnings or new import duties because its value proposition exists on a different plane. As capital continues to flow in via accessible vehicles like ETFs, recognizing its distinct properties, Bitcoin's journey towards becoming a truly independent, globally significant asset class continues, one block at a time.

Just In: Bitcoin ($BTC) Reclaims $90,000 The world's renown digital asset Bitcoin ( CRYPTOCAP:BTC ) surged nearly 4% today to reclaim the $90k resistant zone, amidst breaking out of a bullish symmetrical triangle pattern enroute to $100k.
Bitcoin for almost 1 month now has been swinging within the $80k price range, since losing it's $100k resistant in the month of February, 2025 but with increasing momentum a move to the $100k resistant doesn't seem far fetch because CRYPTOCAP:BTC has already broken the ceiling of the symmetrical triangle.
With the 4-hours RSI at 79, we may experience a respite before the major leap to $100k price point. Notable firms like Micro strategy and Michael Saylor the CEO were integral in this price movement.
The company purchased 6,556 CRYPTOCAP:BTC for ~$555.8 million at ~$84,785 per bitcoin and has achieved CRYPTOCAP:BTC Yield of 12.1% YTD 2025. As of 4/20/2025, Micro strategy holds 538,200 CRYPTOCAP:BTC acquired for ~$36.47 billion at ~$67,766 per bitcoin.
Notably, financial bodies like Standard Chartered Bank says Bitcoin ( CRYPTOCAP:BTC ) could reach a new all-time high due to concerns over the Federal Reserve's independence.
As of the time of writing, CRYPTOCAP:BTC is up 3.70% currently trading at $90,715 per CRYPTOCAP:BTC setting the coast for $100k resistant.
However, on bearish tone, should CRYPTOCAP:BTC fail to pull up that stunt, a price correction might send CRYPTOCAP:BTC back to FWB:83K support.

BTC will surge in the coming months and more than you expect!The monthly money supply delayed by 90 days tells you how explosive coming months will be. Be prepared!

BTC short term Wave countAnalyzing a Bitcoin (BTC) form Wyckoff schema in a 4H chart.
We can’t determine if it’s an accumulation or distribution yet. Based on MACD and Elliott Wave Theory, I believe the chart will follow a similar pattern. However, time will determine the outcome. If BTC declines and accumulates within a shorter time frame of Elliot support levels, it could be a long trade opportunity.
(This analysis is not financial advice. Your actions are solely your responsibility.)

BTC Followed Our Plan As UsualBTC as usual followed our plan so perfectly. In MINDS also i reminded everyone about this move. Now can book nice profits here and stay tuned for our next Update

BTC USDTThe $85K–$86K zone has undergone multiple retests as a resistance level. Repeated tests of resistance typically indicate weakening supply pressure, increasing the likelihood of a breakout.

BTCHello friends
We tried to make everything clear on the chart, I hope you like it.
Good luck.
*Trade safely with us*

BTCUSD Weekend Possible Move 18-20 April 2025🔍 Key Levels
Immediate Support: $84,350 (lower trendline support)
Immediate Resistance: $85,250
Major Resistance Target: $86,000 – $86,250
Major Support Target: $83,000 and $81,400 below
🟩 Bullish Scenario (Green Path)
If BTC respects the lower trendline zone between $84,350–$84,550 and successfully retests it:
✅ Enter LONG on confirmation of bounce
🎯 Target 1: $85,250
🎯 Target 2: $86,000 – $86,250
🛡️ Stop-loss: Below $84,200
🟥 Bearish Scenario (Red Path)
If BTC breaks below the trendline at ~$84,350 and retests from below:
✅ Enter SHORT on successful rejection
🎯 Target 1: $83,000
🎯 Target 2: $81,400
🛡️ Stop-loss: Above $84,700
✅ Signal
🔔 Watch for a confirmed bounce or break at $84,350–$84,550.
Buy above $84,550 after retest confirmation → Target: $86,000
Sell below $84,350 after breakdown + retest → Target: $81,400
Follow, comment, boost and share to show your support.

BTC / Bitcoin / BTCUSDT Bullish OutlookDaily Time Frame Analysis: Bitcoin (BTC) has recently broken out of a descending trendline on the daily chart, signaling a potential shift in momentum. Following the breakout, BTC has entered a consolidation phase, lasting for the past 7–8 days.
Short-Term Outlook: In the near term, BTC may either:
Break out to the upside from the current consolidation zone, or
Execute a fake-out to the downside before reversing sharply.
Potential Upside Targets:
Target 1: $87,000
Target 2: $88,000
Target 3: $90,000
Target 4: $92,000
Traders should monitor price action closely for confirmation before entering positions.

$BTC Update - Sideways Movement AheadCRYPTOCAP:BTC #BTC at $84,221 support and testing, Next key resistances at $88,674 and $91,357, $81,614 current key support area, Ranging between $86,305-$82,833. Low volume on 4H, put bullish engulfing on previous 4H close but no follow up on current 4H, Last weekly close looks good with a bullish engulfing, but current weekly not looking promising for a follow thru yet. Previous daily closed bearish, RSI remains neutral on 4H, 1D and 1W. Expecting more sideways movement until $91,357 resistance is taken as support.

Bitcoin 4h in Consodilation / BullishBitcoin is in consolidation since last couple of days. Once channel will be broken upside, we can buy Bitcoin with target
Target 1 : 86000
Target 2 : 87000
Target 3 : 88000
Target 4 : 89000

BTC/USD Daily Technical Outlook – Approaching Cycle Top?Bitcoin is currently trading around $85,500, maintaining short-term bullish momentum within a well-formed ascending structure on the daily chart. The price is now entering a mid-phase rally, with a clear target of $98,000, a key resistance level that coincides with the upper boundary of a rising wedge formation and historical trend extension zones.
Key Technical Levels:
Immediate Resistance: $88,800 (local supply zone)
Major Target Zone: $97,000–$98,000 (macro resistance + psychological round number)
Short-Term Support: $82,000
Key Breakdown Level: $78,500
While the momentum suggests BTC may continue to push higher in the near term, the $98,000 resistance is likely to act as a distribution zone, where buying may slow and profit-taking increases. This level could falsely signal a breakout, leading to a spike in retail long positions before the market enters a longer-term correction phase.
If rejection occurs at or near $98,000, BTC could begin a multi-month correction, with the primary downside target set at $49,000 by July 2025. This level aligns with previous weekly support, volume profile lows, and would represent a typical deep retracement following a major cycle top.
Outlook:
Near-term bias: Bullish toward $98,000
Macro bias: Bearish reversal expected from resistance zone
Cycle correction target: $49,000 (Q3 2025)

BTCUSD – Bullish Breakout Loading ?
📈 *Bitcoin Daily Chart Analysis – April 14, 2025*
Bitcoin is looking 🔥 as it pushes higher from a key **accumulation zone** after a sharp recovery from recent lows. The previous **rising channel** was broken to the downside, but now the price is forming a solid **bullish structure**, suggesting a strong comeback is in play!
---
### 🔍 Technical Highlights:
- ✅ **Demand Zone Bounce:** Clean rebound from the highlighted green box (accumulation area), signaling buyer strength.
- 📈 **Higher Highs Incoming?** Price is now consolidating near **$85,000**, with bullish momentum building.
- 📊 **Upside Target:** Eyes on $87,000 → $88,500 if momentum sustains and daily closes continue above resistance.
- 📌 **Key Support:** $84,000 holds the line — invalidation below that would shift bias.
---
### 🧠 Trader's Insight:
The structure is setting up for a **potential bullish continuation**. Momentum traders should watch for a confirmed break and close above $85,400 for further upside! 🚀
💬 *"Patience in accumulation pays in breakout."*
Ready to catch the next leg up? 📲 Let’s trade smart and ride the wave.

BTC/USDTbitcoin hit our target of 85k from the 77k entry.
a small correction is expected here to 82k-84k due to resistance from the 200 day and 50 day emas before rise.
next target:95K

BTC BTC is consolidating for further upside, we will see some reaction above 90K after small correction.
Disclosure: We are part of Trade Nation's Influencer program and receive a monthly fee for using their TradingView charts in our analysis.

Bitcoin's Bounce, Your Weekly Scoop on the Bullish Surge !The market has unfolded as anticipated, aligning with our projections.
Short-Term Outlook: Expect a relatively narrow trading range this week due to the absence of major news catalysts.
Bullish Perspective: We maintain a bullish stance, targeting a price range of $88,000–$92,000.
Local Bottom Confirmation: Bitcoin appears to have established a local bottom. Notably, it diverged from Ethereum, which recorded lower lows, while Bitcoin resisted forming a new low.
Technical Analysis: Last week, Bitcoin respected a daily bullish order block, resulting in a strong upward move.
Key Support Level: This week, an inverse fair value gap (FVG) on the daily chart around $82,400 is expected to act as a liquidity zone and support, with price likely to tap this level and rebound higher.
Thank you for your support! Stay tuned for more insights and drop a Like if you loved it 🚀

BTC analysis 50ma, 200 ma, on Daily time frame are important, at 50ma got rejected, we have 2H to see if price closes above the trendline
