RAREUSDT Poised for Breakout from Falling Wedge – High Volume SuperRare (RARE) is currently forming a falling wedge pattern on the daily chart, a technical setup often indicative of a potential bullish reversal. This pattern is characterized by converging trendlines that slope downward, suggesting a decrease in selling pressure and the possibility of an impending breakout to the upside.
The trading volume for RARE has been robust, reinforcing the likelihood of a significant price movement upon breakout. Elevated volume during the formation of a falling wedge typically signifies growing investor interest and confidence in the asset's future appreciation.
Technical analysis further supports this optimistic outlook. Indicators such as the Moving Average Convergence Divergence (MACD) are showing bullish signals, while the Exponential Moving Averages (EMAs) and Relative Strength Index (RSI) are neutral, suggesting that RARE is poised for a potential upward surge
Given these factors, RARE is anticipated to achieve gains ranging from 180% to 200% or more upon a confirmed breakout. The combination of a well-defined falling wedge pattern, substantial trading volume, and supportive technical indicators suggests that RARE may experience a significant price increase in the near future.
✅ Show your support by hitting the like button and
✅ Leaving a comment below! (What is your opinion about this coin)
Your feedback and engagement keep me inspired to share more insightful market analysis with you!
Btcupdate

Bitcoin at Critical Support: Technical Analysis and Trade Idea📊 Bitcoin (BTC) is currently trading at a critical support zone, offering potential opportunities for both counter-trend trades and short setups! 🚀 In this video, we break down Bitcoin's price action and market structure on the daily and four-hour timeframes, focusing on key areas such as liquidity zones, bearish imbalances, and Fibonacci retracement levels. Discover how to identify higher highs, higher lows, and potential trade setups for both long and short positions. 💹 Whether you're an experienced trader or just getting started, this analysis will give you the tools to navigate Bitcoin's current market dynamics with confidence. 🔄 As always, this content is for educational purposes only—trade wisely and stay safe! 💡

(BTCUSD) – Bearish Continuation or Institutional Accumulation?Technical Analysis:
Bitcoin is currently trading within a descending channel, struggling to break above resistance. The price has rejected the upper boundary and could continue its downtrend toward $72,000 - $73,000 if support around $83,000 fails.
Key observations:
• Lower highs & lower lows confirm a bearish structure.
• A break below $83,000 - $82,000 could accelerate selling pressure.
• The next major support zone is $72,000 - $73,000.
Fundamental Analysis – Institutions and Governments Increasing Reserves:
• The U.S. government now holds around 200,000 BTC (~$17 billion), primarily seized from criminal cases. Their decision to maintain these holdings instead of liquidating suggests a potential shift in long-term Bitcoin adoption.
• MicroStrategy continues to accumulate BTC, now holding 423,650 BTC (~$42.43 billion), reinforcing corporate adoption of Bitcoin as a treasury asset.
• Coinbase now custodies 12% of the total Bitcoin supply, making it the largest Bitcoin custodian. This highlights institutional confidence in Bitcoin’s long-term value.
• Despite these bullish fundamentals, ETF inflows have slowed down, and macroeconomic uncertainty (such as potential Fed rate hikes) could put pressure on Bitcoin in the short term.

Analysis of BTC/USDT double top pattern occurring in the market.Hello traders.
As i mentioned before in my analysis when ever the double top pattern occure the market will move downward but still it is not completed when the neckline breacks then it will be the complete double top pattern and it will move btc more download.
If the btc bounce back from the resistance which is making right here on 8600$ it will be more upword.
Shere your valuable thoughs in comments about btc.

Bitcoin - Has This Market Cycle Peaked?In this video, I give my observations on this current Bitcoin market cycle. Nothing earth shattering, just my observations of some of Bitcoin's price action since the bear market bottom in November 2022.
The big question on most people's mind right now is: Has Bitcoin peaked for this market cycle?
This is what I am trying to determine, as I am sure many others are as well.
While looking for possible end of market cycle patterns and reviewing longer term time frames, I found a pattern on the Stochastic RSI (which I mispronounced in the video!) 😂
Looking at the Stochastic RSI indicator on the monthly time frame, you can see that about two months after each market cycle peak the indicator drops below the 20 level. In all of Bitcoin's price history, there isn't one instance when the Stochastic indicator on the monthly time frame drops below 20 that the price of Bitcoin recovered to push to a higher market cycle peak. In every instance it cemented the previous peak as the market cycle peak. Even though the drop below the 20 level lags well behind the peak, I believe that it can be useful in determining if the cycle peak has been hit or if there is more bull market yet to come.

BTC/USDT UpdateBitcoin is back to our $85-$86 support level.it is an importantlevel due to the 200 day Ema and trendline support.
another key level is the 200-day MA support,which also aligns with te SBR FOMO low $81.5k

#BTC/USDT This level is important...BTC is currently trading below the 50 EMA, 100 EMA, and 200 EMA in the 4-hour chart.
This is not ideal for the price action, and $93k has now become a strong resistance level.
The pattern appears to be setting up for a breakout soon. While it won’t be easy, it’s entirely possible we break to the upside.
If there’s a break below, we could see a dip to $73k.
Do I think the bear market has already started? Definitely not!
I’ll keep you updated, so follow and share this chart with your friends.
Thank you!
#PEACE

Will BTC reach 80,000 or 90,000? 10,000-point trading signalBTCUSD analysis and observation, 88600, 89800, 90500 are short-term resistance, and 86500, 86000, 84200 below are support. If this structure is broken, the market will enter the next stage.
BTCUSD 91000 trading opportunity has been opened, and tonight will usher in a 5000-10000 point fluctuation range
Trading is risky, positions should be reasonably controlled, when the opportunity comes, if you don’t know when to enter the market, want to get accurate transactions and huge profits in advance, please leave me a message, I will make you feel t COINBASE:BTCUSD INDEX:BTCUSD BITSTAMP:BTCUSD BINANCE:BTCUSDT hat this is true.

Bearish scenario for BTCIn trading and crypto world you have to be open to all possibilities. As we are seeing significant drop among alts and market makers manipulation. Money is withdrawed from markets and price is failing.
BTC price action reminds me 2021 year when after ATH there was a 50% drop.
Lot of similarities there - completed 5 waves, bearish div on higher timeframes, greed above 70/75, bullish sentiment, news etc.
On the other hand, current drop already liquidated more than 2b usd in one day...
We need to watch it closely and do not overtrade or do stupid FOMO.
In these time lev trades are not recommended.
THIS IS NOT A FINANCIAL ADVICE
MANAGE YOUR RISK AND ALWAYS USE STOPLOSS

Trading opportunities tonight have started at 91000Despite recent market concerns, whales continue to withdraw BTC from exchanges.
Volatility in crypto markets continued as the broader market saw 24-hour liquidations of over $500 million, with long liquidations accounting for $400 million.
The source of the US strategic reserve is the confiscated Bitcoin. The market has been prepared for this and it is not lower than expected. In the long run, it will have a great impact. BINANCE:BTCUSDT INDEX:BTCUSD BITSTAMP:BTCUSD COINBASE:BTCUSD

The market's big swing trading signal has appeared! ! ! ! !Recently, the XAUUSD and BTCUSD trading signals shared have been profitable and profitable, which is obvious to all. Especially in BTC trading, the expected fluctuations are thousands of points. Of course, this has been confirmed by the market for several times.
Today, everyone should be prepared in advance. Trading opportunities with fluctuations of thousands of points may reappear. Because the most watched non-agricultural data is released once a month, plus the cryptocurrency summit, the currency reserve bill and the Federal Reserve meeting. These major events will cause drastic fluctuations in the currency market. Of course, this time will be an opportunity for ordinary traders to turn over. When the opportunity comes, if you don’t know when to enter the market and want to get this accurate transaction in advance and make huge profits, please leave me a message. I will show you that this is true. BINANCE:BTCUSDT COINBASE:BTCUSD BITSTAMP:BTCUSD INDEX:BTCUSD OANDA:XAUUSD TVC:GOLD

Trump established a Bitcoin reserve, but why did Bitcoin plummetOn March 7, Bitcoin plunged in the short term, falling below $85,000 during the session. Then it quickly rose again. More than 150,000 people were liquidated in the past 12 hours, with a liquidation amount of $540 million.
On the news, the White House cryptocurrency director said that US President Trump has signed an executive order to establish a strategic Bitcoin reserve. The strategic reserve will be capitalized by about 200,000 bitcoins owned by the federal government, and the government will not purchase additional assets for the reserve except for assets acquired through asset confiscation procedures. This is different from what the currency circle expected. Previously, the market expected the Trump administration to buy cryptocurrencies, but now it seems to be just "storage", which disappoints people.
The market is waiting for the upcoming White House cryptocurrency summit, during which Trump is expected to announce more details of the crypto reserve. On Thursday local time, US President Trump signed an executive order to establish a strategic Bitcoin reserve, the day before he met with cryptocurrency industry executives at the White House.
Sachs wrote that the order authorizes the Treasury and Commerce secretaries to develop "budget-neutral strategies" to acquire more Bitcoin, provided that it does not increase costs to American taxpayers. Sachs said that no taxpayer money would be spent to buy cryptocurrencies, so the price of Bitcoin and other tokens fell.
People at the White House cryptocurrency summit on Friday expected the event to be the stage for Trump to formally announce plans to establish a strategic reserve containing Bitcoin and four other cryptocurrencies. BINANCE:BTCUSDT COINBASE:BTCUSD BITSTAMP:BTCUSD ICMARKETS:XAUUSD

BTCUSD short trading, expected profit 3000-5000BTCUSD is now planning to trade short, with big non-farm data and the Fed meeting, and expected profits of 3000-5000
Buy: 88800, 89300,90500
TP: 87800, 87300, 86200, 83800
SL: 89800
Trading is risky, control your position reasonably.
The market is changing rapidly, please leave me a message for accurate profit signals for buying and selling.
Recently, I have made an in-depth analysis of the BTCUSD and XAUUSD signal recommendations, which can be regarded as the key to making profits in this complex market. I don't know how many traders have achieved this goal. Although I can't make you all make profits like me, the only thing I can do is to give you a road to success. I can't force you to hold your hand, but I think those who can walk on my road must be much stronger than their own road without direction and full of bumps. The trading market is a battle of real money and silver. Everyone wants to win, but you have never considered whether your strength and experience team meets the conditions for victory. Follow me and witness the future together
BINANCE:BTCUSDT BINANCE:BTCUSDT

Bitcoin: Navigating Market Volatility and Future PredictionsBitcoin, the pioneering cryptocurrency, continues to dominate headlines with its characteristic volatility and the ever-present speculation surrounding its future trajectory. Recent market activity and expert analyses paint a complex picture, one where potential for significant growth is tempered by inherent risks and external economic factors. Several key themes emerge from recent news and analysis, offering a glimpse into the current state of Bitcoin and the factors influencing its price.
The Potential for a US Crypto Reserve and its Impact
One of the most significant potential catalysts for Bitcoin's price is the possibility of the United States government establishing a strategic cryptocurrency reserve. This concept, championed by figures like MicroStrategy founder Michael Saylor and gaining traction within political circles, could have a profound impact on the market.
Saylor has publicly suggested that the US government should acquire one million Bitcoin for its strategic reserves. He argues that this would legitimize Bitcoin as "digital property" and instill greater confidence in the cryptocurrency. Saylor pointed out that MicroStrategy already holds approximately 500,000 Bitcoins, which accounts for about 2.4% of the worldwide supply. He also suggested that the government could finance such a large crypto reserve through a deliberate, multi-year timeline, referencing a "six-month process" set out by a recent executive order.
There is research that supports this view, estimating that a US crypto reserve could boost Bitcoin's market capitalization by roughly 25%, or approximately $460 billion. This potential surge is attributed to Bitcoin's limited liquid supply, meaning that large inflows from a government purchase could trigger upward price shocks. Furthermore, such a move could incentivize institutional investors and other countries' governments to allocate funds to Bitcoin, creating a positive feedback loop.
While the idea has gained traction, particularly with endorsements from figures like Donald Trump, the path to establishing a national crypto reserve is not without its hurdles. Confusing messaging, legal challenges, and uneven progress across different states contribute to market uncertainty. The market currently views the probability of a national Bitcoin stockpile as relatively low due to challenges like confusing messaging and legal hurdles.
Market Sentiment and Price Predictions
Despite the potential for significant growth, market sentiment surrounding Bitcoin remains cautious. The Crypto Fear & Greed Index, a measure of overall market sentiment, consistently hovers in "Extreme Fear," even amidst price spikes. This suggests that while investors are drawn to potential gains, underlying anxieties about volatility and external economic pressures persist.
Predicting Bitcoin's price with certainty remains an elusive task, but analysts offer varying perspectives. Master Ananda, for example, believes that Bitcoin's price bottom is in, following a recent dip below $80,000.
However, other analysts urge caution. The recent rebound of Bitcoin to over $90,000 was short-lived, with the price retreating due to concerns about a potential recession, geopolitical tensions in Ukraine, and uncertainty surrounding the US crypto reserve. This highlights the sensitivity of Bitcoin to broader economic factors and geopolitical events.
Technical Analysis and Market Dynamics
Technical analysis of Bitcoin's price charts provides further insights into its current state. The recent formation of back-to-back weekly "hammer candles," a pattern seen only a handful of times in Bitcoin's history, suggests potential bullish momentum. However, the failure of a recent price rebound to break through key resistance levels indicates that the path to higher prices may not be straightforward.
The relationship between Bitcoin and traditional financial markets, particularly the S&P 500, also plays a crucial role. Historically, Bitcoin has struggled during periods of high volatility in the S&P 500, as measured by the VIX. This correlation suggests that broader economic anxieties can negatively impact Bitcoin's price.
The Influence of Global Liquidity and External Factors
Beyond specific events and technical indicators, broader macroeconomic factors influence Bitcoin's trajectory. Analyses suggest that global liquidity trends favor crypto and risk assets. The global money supply is expected to reach new all-time highs, potentially boosting Bitcoin's price. A dropping US Dollar Index (DXY) also signals a shift in favor of crypto.
The upcoming US Crypto Summit, organized by the Trump administration, is anticipated to be a key event that could provide clarity and potentially influence Bitcoin's future trajectory. Market participants are eagerly awaiting the summit's outcomes, as they could provide crucial insights into the regulatory landscape and government's stance on cryptocurrencies.
Conclusion
Bitcoin's current landscape is a complex interplay of potential catalysts, market sentiment, technical indicators, and macroeconomic forces. The possibility of a US crypto reserve offers a significant upside potential, but market anxieties and external economic pressures create a degree of uncertainty. While some analysts predict a rapid surge in price, others emphasize the need for caution and highlight the importance of monitoring broader market dynamics. As Bitcoin continues to evolve, its price will likely remain sensitive to both internal developments within the cryptocurrency ecosystem and external factors shaping the global economy. The upcoming US Crypto Summit and future policy decisions will be critical in shaping Bitcoin's future direction.

Trump's "exemption game" stirs up North American trade patternU.S. President Trump announced on Thursday that he would suspend the 25% tariff on Canada and Mexico for one month. This decision once again highlights the erratic nature of U.S. trade policy, which not only caused financial market turmoil, but also made business leaders feel uneasy. The exemption will expire on April 2, marking a new round of game in North American trade relations.
Chain reaction of market and economy
The uncertainty of tariff policy may reignite inflationary pressure, suppress demand and economic growth. Investors are uneasy about the Trump administration's repeated behavior, believing that this "sometimes levy, sometimes cancel" approach has exacerbated market volatility. BINANCE:BTCUSDT TVC:GOLD INDEX:BTCUSD TVC:GOLD

BTCUSD trading plan to make 5000 pips profit soon
BTCUSD91500 plans to continuously generate profitable trading signals, currently reaching around 88600, and continue to generate profit of 2800+
BTC is about to usher in a 5000-10000 point big shock trading signal
On March 7, the big non-agricultural data and the next Federal Reserve meeting will be released. These data and meetings will bring epic trading opportunities for market shocks. Everyone should understand in advance and control this risk. This will be another opportunity for ordinary traders to turn over. If you want to get accurate trading signals and this lucrative profit in advance, please leave me a message. BINANCE:BTCUSDT BITSTAMP:BTCUSD BITSTAMP:BTCUSD BINANCE:BTCUSDT COINBASE:BTCUSD

Do you know the calm before the big wave of BTCUSD?At present, the BTCUSD market is in a calm before the wave, which is nothing more than the release of the next non-agricultural data and the subsequent Fed meeting. Every trader knows the importance of this impact. Of course, this fluctuation may present large-scale trading opportunities. Every trader should be aware of it. During this period, trading must control risks.
From the analysis, BTC can focus on the resistance levels of 91500 and 92300 in the short term, and the support levels of 89600 and 88500 below.
Trading is risky, and positions should be controlled reasonably. The market changes rapidly, and accurate signals are based on real-time.
Grasp the accurate trading signals, when to buy and sell, and seize large-scale profits, leave me a message. BINANCE:BTCUSDT COINBASE:BTCUSD BITSTAMP:BTCUSD INDEX:BTCUSD

Will this short-term recovery drive Bitcoin to the $100,000 markBitcoin Price Chart
Currently, Bitcoin is trading at $92,358 with a market cap of $1.831 trillion. The completion of the Morning Star pattern on the 200-day EMA line increases the probability of a breakout beyond the resistance trendline. The price of Bitcoin has also violated the 78.60% Fibonacci level at $91,780. With the sudden recovery of Bitcoin, the index has maintained a positive stance since the end of last week due to the increase in market volatility. Additionally, the Directional Movement Index indicates a potential crossover in the VI line. This positive crossover could mark the beginning of an uptrend in Bitcoin, and a potential triangle breakout rally is on the horizon.
Despite the massive recovery in Bitcoin price, institutional support remains weak. On March 5, the US Bitcoin ETF saw a daily net outflow of $22.1 million. Surprisingly, Blackrock saw an inflow of $38.93 million, which was the first inflow after seven consecutive days of outflows.
Bitcoin ETFs, Invesco and Bitwise recorded outflows, while other ETFs maintained net zero flows. Invesco had the largest outflows, with $9.9 million worth of Bitcoin, followed by $6.9 million. BINANCE:BTCUSDT COINBASE:BTCUSD BITSTAMP:BTCUSD INDEX:BTCUSD

Today btcusd analyisBitcoin Price Trend Analysis (30-Min Chart)
Current Price: 92,005 USD
1. Key Levels & Distances
Resistance Zone: 94,000 USD (+1,995 USD from current price)
Support Zone: 91,500 USD (-505 USD from current price)
Major Support: 90,000 USD (-2,005 USD from current price)
2. Trend Analysis & Possible Scenarios
Bullish Scenario (Uptrend)
If the price maintains support above 91,500 USD and breaks 94,000 USD, it could push higher toward 95,000 USD or more.
Confirmation of higher highs and higher lows will strengthen bullish momentum.
Bearish Scenario (Downtrend)
If the price fails to break 94,000 USD and drops below 91,500 USD, a correction towards 90,000 USD is possible.
Breaking below 90,000 USD could indicate a larger downtrend.
---
3. Trading Strategy Insights
For Buyers (Long Positions):
Look for a breakout above 94,000 USD before entering.
A stop-loss around 91,500 USD.
Target profit at 95,000+ USD.
For Sellers (Short Positions):
If price rejects 94,000 USD, short entries below 91,500 USD could be considered.
Stop-loss near 92,500 USD.
Profit target around 90,000 USD.

$BTC Daily UpdateCRYPTOCAP:BTC #BTC $92,786 resistance approaching, $91,375 support currently in effect, $86,305 key support from here, possible sign of reversal on 1D with RSI and MACD confirmation, can retake $94,148 support this week if no further manipulation changes it's course. Current Weekly and Previous one both looking bullish showcasing strength of the Bulls, expect resistance at $94,148-$95,878, next key support range at $80,582-$78,034.

Major upcoming events in the marketThe trap has appeared:
- The crypto summit on Friday will confirm the strategic position of BTC
- The hotly speculated altcoins may be "delisted" by policies
- The US Treasury's 215,000 BTC reserves reveal the true intention
Now chasing the rise of altcoins is like betting against the dealer. XRP, which is deeply involved in SEC lawsuits, and SOL with Democratic background are both high-risk minefields.
Remember: When the White House starts discussing crypto strategy, the real winners are always the whales who have already made arrangements.
For more amazing news, opportunity trends, big swing trades, when to buy and sell, leave me a message. BINANCE:BTCUSDT BITSTAMP:BTCUSD INDEX:BTCUSD

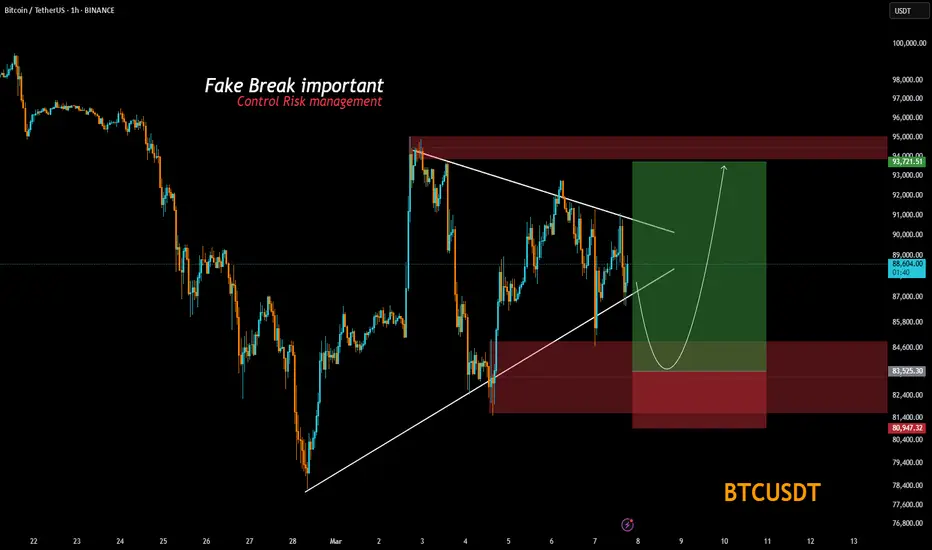
BTC/USDT 1H: Bullish Structure Emerging – Next Stop $95KBTC/USDT 1H: Bullish Structure Emerging – Next Stop $95K?
🚀 Follow me on TradingView if you respect our charts! 📈 Daily updates!
Current Market Structure (Confidence 8/10):
Price: $89,849, showing bullish momentum emerging from equilibrium zone.
Hidden bullish divergence confirmed between price action and selling volume.
Market Makers (MMs) accumulated heavily at GETTEX:87K support, now targeting the premium zone.
Clean break above POI (Point of Interest) at $88.5K signals further upside potential.
Trade Recommendation:
Entry: Current price ($89.8K) or pullback to $88.7K.
Targets:
T1: $91.2K
T2: $93.5K
T3: $95K
Stop Loss: $87.2K (below equilibrium zone).
Risk Score:
8/10 – Favorable R:R setup with a clear invalidation level.
Market Maker Activity:
Accumulation phase complete at the GETTEX:87K zone.
Currently engineering moves toward the premium zone ($94-95K).
Likely targeting shorts above GETTEX:92K before continuation.
Smart Money Insight:
Institutional accumulation is evident, showing strong buying pressure.
Structure suggests another leg up, but traders should monitor premium zone resistance near $94-95K.
🚀 Follow me on TradingView if you respect our charts! 📈 Daily updates!
