Bitcoin may rebound up from buyer zone check out and read BTC/USD Bullish Outlook: Potential Rebound from Buyer Zone"
Bitcoin is showing signs of strength as it approaches a key buyer zone. Holding above this level could trigger a strong rebound, with upside targets at key resistance levels. A breakout above confirms bullish momentum, supporting further gains.
Btcupdate

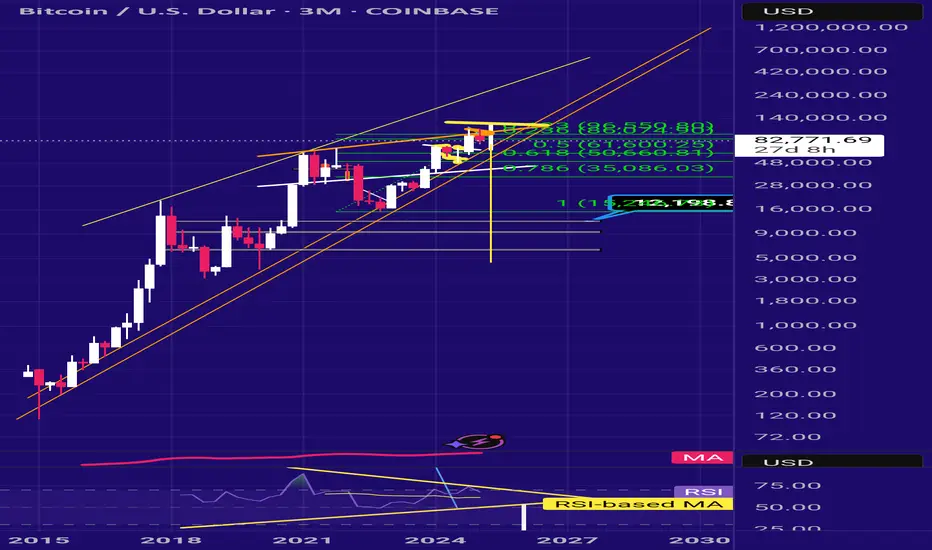
BTC in trouble. Sale Now.We are going to $61k and if we break that, we go to $50k.
If $50k breaks, guaranteed we go to $12k.
The worst case scenario is at $3k. Probable and possible based on chart patterns.
Obvioisly with a lot of up and downs and mini bull-runs but in the the big picture, we are going down.
The 2 year bear market cycle started.
Hold tight.
Time To Hunt Bitcoin - Buy from Support to Major ResistanceThe setup focuses on buying from strong support zones and riding the price up to multiple take-profit targets.
Entry Strategy:
Entry 1: Around $84,910.7, which aligns with a key support zone.
Entry 2: Around $78,430.4, a deeper support level in case of further downside.
Risk Management:
A stop loss at $65,523.5 ensures capital protection in case of a breakdown below major support.
Take Profit Levels:
Take Profit 1: $99,009.6 – First resistance area where partial profits can be secured.
Take Profit 2: $106,102.9 – A key level where momentum may slow down.
Take Profit 3: $110,919.3 – The final target in case of a strong bullish rally.
Trade Scenario:
Bullish Case: If price holds above Entry 1, a bounce towards Take Profit levels is expected.
Bearish Case: If price drops below Entry 1, the next support (Entry 2) offers another buying opportunity.
Stop Loss Activation: If BTC drops below $65,523.5, the trade is invalidated, preventing further losses.
This trade plan follows a risk-reward approach, focusing on capital preservation while targeting high-probability reversal zones.
OKX:BTCUSDT.P BINANCE:BTCUSDT BINANCE:BTCUSDT BITSTAMP:BTCUSD KUCOIN:BTCUSDT COINBASE:BTCUSD BITSTAMP:BTCUSD

THE ROAD TO 68K BTC.P/USDT 4 HOUR In this idea I expand upon my previous idea posted in December on the 8th. The previous idea showed the rudimentary course we would take according to the formation set of Ascending scallops.
In this chart I outline the key supports, resistance, and the projected bottom point we will bounce from to head back up.
Seems we have fallen from a large scale rising wedge and are now inside of descending broadening wedge. This is all in line with my previous idea and is moving as expected. We do not have long to go before we reach our bottom target if we do in fact move as projected.
Only time will tell, Happy Hunting - TND

BTC dell 120.000$📊 BTCUSDT Analysis:
Current Price: $102,859.06
Sell Zone: Near $120,000.00 (🟢 Major resistance)
Support Zone: $77,777.00 (🛡️ Key level for potential rebound)
🚨 Signal:
Bearish Scenario: If BTC reaches $120,000.00, it’s a sell opportunity 📉.
Bullish Scenario: In a strong bull trend (📈), you can buy dips around $77,777.00 (🚀 support area).
💡 Strategy:
Take profits near $120,000.00 🎯 if already holding BTC.
Watch for entries at $77,777.00 🔍 if BTC retraces.
📈 Trend: Overall Bullish unless support at $93,175 or $77,777 breaks (🔻).
🔐 Risk Management:
Stop-loss for buys: Below $73,316.18 (⚠️ Critical level).
Let me know if you need further clarification or tailored strategies!

BTC UPDATE!!BTC Update:
The current Bitcoin price has entered a critical selling pressure zone. To maintain a bullish outlook, a break above the $99.5k-$100k resistance level is necessary.
Failure to do so may result in the formation of lower highs on the daily time frame, potentially leading to another downward move towards the FWB:73K -$72k support zone.
On the weekly time frame, Bitcoin has left a wick downside without closing below it, which is a positive sign. However, the next candle is crucial, and a close above the $99.5k-$100k zone is needed to maintain bullish momentum.
A close below the $90k- GETTEX:89K zone would likely confirm another downward move towards the lower low structure of FWB:73K -$72k.
As indicated by the chart, failure to break above the $99.5k-$100k zone may result in the formation of lower highs, potentially leading to another downward move.
Investors are advised to exercise caution and not be swayed by market noise. The chart is indicating a potential move towards lower lows if the resistance level is not broken.
To manage risk, consider booking short-term profits and implementing stops on the profit side. Always prioritize risk management and adjust positions accordingly.
Key levels to watch:
- Resistance: $99.5k-$100k
- Support: FWB:73K -$72k
- Critical zone: $90k- GETTEX:89K

Bitcoin (BTC/USD) Technical Analysis – Daily Timeframe Bitcoin (BTC/USD) Technical Analysis – Daily Timeframe
This chart presents a technical breakdown of Bitcoin (BTC/USD) using supply and demand zones to anticipate potential price movements. It reflects a bearish bias as price action shows rejection from the supply zone (sell zone) and an expected drop toward the demand zone (buy zone).
🔍 Key Chart Elements
1. Supply Zone (Sell Zone) – Resistance Area
The supply zone is highlighted in the upper region, approximately between $86,000 and $88,000.
This area represents a strong resistance where sellers are active, preventing further price increases.
Bitcoin recently tested this zone but failed to break above, leading to a price rejection.
2. Demand Zone (Buy Zone) – Support Area
The demand zone is marked in the lower region, around $69,000 to $67,000.
This is a historical support level where strong buying interest is expected.
If Bitcoin reaches this level, a potential bullish reversal could occur.
📉 Bearish Price Projection
The chart includes a downward arrow, indicating an expected bearish movement from the supply zone toward the demand zone.
Reason for the expected drop:
BTC is struggling to gain momentum above $86,000, showing signs of weakness.
The recent bearish candles suggest increased selling pressure in the market.
A failed breakout above resistance increases the likelihood of a downward move.
Price Targets:
First target: Around $74,000, a potential minor support.
Second target: Around $69,000, which aligns with the demand zone and could act as a strong support level.
🔄 Potential Alternative Scenario – Bullish Breakout (Low Probability)
If BTC manages to break above the $88,000 resistance level, it could trigger a bullish rally.
In this case, the next targets would be $92,000 and $96,000.
However, given the current market structure, this is a less likely scenario unless buying momentum increases significantly.

Talking about perfection? Check my posts ;)Previous analysis completely satisfied. BTC ruined liquidity as expected, returned from levels. Each time.

BTCUSDT| LONG Hello to all traders and those viewing my analysis. I anticipate an upward movement, and the horizontal lines I have drawn represent support and resistance zones. If the price continues to rise and closes above that area, I expect further upward movement toward the current high. However, if it fails to continue its ascent, I will anticipate a decline
its just my idea not a signal guys so use money management.


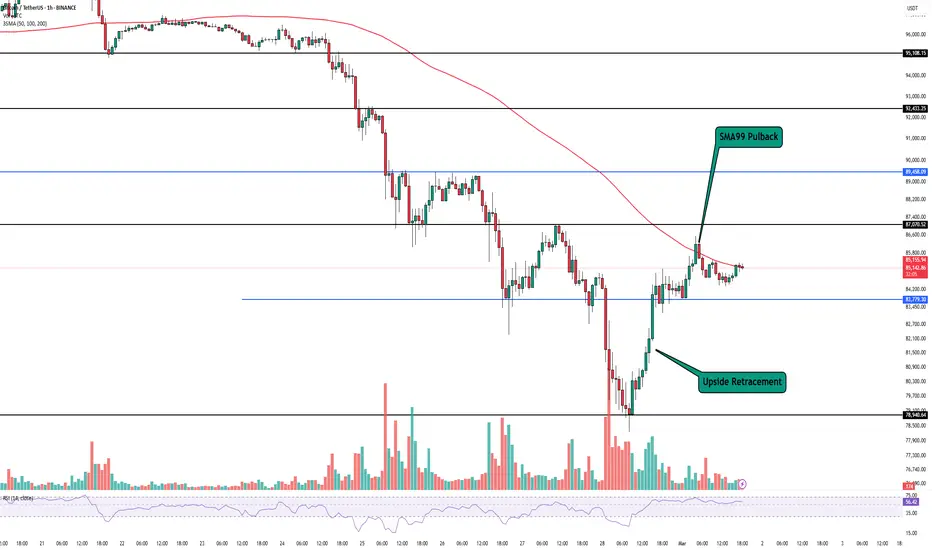
UniversOfSignals | Bitcoin Daily Analysis #20Let's dive into the Bitcoin analysis and key crypto indices, where I will, as usual, review the futures triggers for today's New York session. The market had an upward and corrective movement yesterday, rising from the support at 78,940. Today, I aim to examine the market conditions for you.
⏳ 1-Hour Timeframe
In the 1-hour timeframe, as you can see, the price has risen from the support at 78,940 and managed to exceed the area of 83,779. A V pattern has formed and has been activated, moving the price upward. It appears that the break of 83,779 so far was a fake break.
🔼 If 83,779 is broken again, you can enter a short position targeting 78,940, but keep in mind that since the price has already faked a break, there might be an upward momentum entering the market. If 82,770 breaks, you could consider taking the risk of opening a long position.
⚡️ Personally, I prefer to open a long position with the minimum risk allowed by my strategy, but if 83,779 breaks, I will open a short position with usual risk. As you can see, the price has also hit the SMA 99 and seems to be getting rejected from it.
📉 This could be another suitable confirmation for a short position, and if the price cannot stabilize above this SMA and gets rejected from this area, breaking 83,779, we could even expect the next bearish leg towards lower lows, although the first target for us would be 78,940.
✅ The RSI oscillator has also moved out of the oversell zone and above the 50 area. A break of the 50 zone could reintroduce bearish momentum into the market.
📊 Keep in mind that today is Saturday, considered a holiday, and the market volume is very low. I generally prefer the market to range on such days and then start moving afterward.
👑 BTC.D Analysis
Let's move on to analyzing Bitcoin dominance to see how Bitcoin's dominance over the market has changed compared to yesterday. As you can see, after being supported at 60.48 and breaking the 60.91 area, it's moving upwards again.
💫 As I mentioned, a range box has formed between 60.48 and 62.19, and I told you yesterday that if the dominance stabilizes above 60.91, it could start moving towards the box's ceiling.
🎲 As you can see, this movement has started, and so far, the dominance has reached 61.21. We need to see how the dominance reacts to this area. If this area breaks, the next resistance levels for dominance will be 61.49 and 62.19.
🧲 I have nothing more to say about Bitcoin dominance. It seems to be forming an upward structure, and if this upward structure coincides with the next bearish leg of Bitcoin, altcoins could provide very good short positions and experience sharp declines.
📅 Total2 Analysis
Let's move on to analyze Total2 to see what the triggers for altcoins will be. As you can see, Total2 was supported from 1.01 and has moved upward to 1.09, where it is currently being rejected.
🔍 As you observe, the SMA 99 in Total2 has reached the price and the price has reacted to it. We have a very risky trigger for a short position on Total2, which is the break of 1.06; this position is very risky and can be opened as a scalp in lower timeframes.
🚀 The highest target I can consider for this position will be the area of 1.01.
📅 USDT.D Analysis
Let's move on to the analysis of Tether dominance. As you see, Tether's dominance was rejected from 5.50 and has moved downward, reaching back to 5.21. This index, like Bitcoin and Total2, has reached the SMA 99 and been supported from this area, and could perform its next bullish leg after breaking 5.21.
💥 In this case, you could confirm the bullish turn of Tether's dominance and validate this dominance for the next bearish leg of the price.
❌ Disclaimer ❌
Trading futures is highly risky and dangerous. If you're not an expert, these triggers may not be suitable for you. You should first learn risk and capital management. You can also use the educational content from this channel.
Finally, these triggers reflect my personal opinions on price action, and the market may move completely against this analysis. So, do your own research before opening any position.
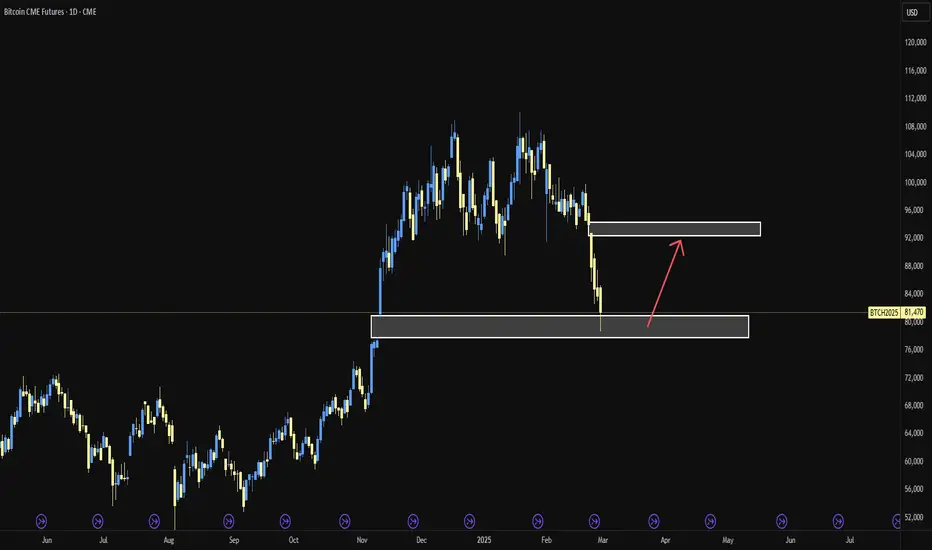
BTC Rebalance in Play? Key Retrace Setup Unfolding!Bitcoin has tapped into a bullish imbalance on the weekly timeframe—a natural move as the market seeks to rebalance. 🔄 We often see reactions around the midpoint of these levels.
If price starts ranging sideways and breaks structure to the upside, we could consider a counter-trend trade on the retrace, then look for another sell opportunity as it pulls back. 📊
I’ll aim to follow up with a video over the weekend. Stay tuned! 🎥
Not financial advice. ⚠️

BITCOIN Final update !!! We're about to BOOM!!!According to bigger picture, we're still in bull market, 5th of macro and ending 4th of micro elliott wave.
Good news is, that we're about to get back into bullish mega green candles soon!!
BTC's major CME gap has been filled and this was also the region where FVG is also available and also corrective pattern (double three) Y ends in this region in combining with expanded flat's C. we may most probably by will of GOD almighty will see green days in coming weeks. Targets of wave 5 are up to 120-130K region.

BTC retrace of 30% beginning of 2025? Historical Data suggest that #BTC could retrace by about -30% down to the 75K mark before continuing its rally throughout 2025. I am keeping an eye out for the repetition of this pattern.

BTC FUTUREi think the btc will going as like this
btc will down betwin 72000$ to 68000$
then will pumped start at 80000$ to 150or200000$

Bitcoin Reversal Setup – Potential Upside Within the ChannelBTC/USD is currently trading within a descending channel on the 1H timeframe. The price has recently bounced from the lower trendline support, indicating a possible reversal.
Key Levels & Observations:
• Support Zone: ~ $78,000 (recent low & trendline support)
• Resistance Levels:
• $95,000 (major resistance level within the channel)
• $96,000 (potential breakout level)
Trading Idea:
A bullish move is anticipated if BTC holds above the lower trendline. A potential target is the mid-channel resistance ($93,000), with an extended move toward the upper boundary ($94,600). A break above this level could signal a broader trend reversal.

BTC ——> LONG This is a normal correction , don’t panic too much, in the long term we will hit a new ATH

BTCUSDT 1WBTC ~ 1W Analysis
#BTC It's hard to say this, but this is the end.
We are still sure bullish isn't over yet.

BTC at a Make-or-Break Level Bitcoin is at a tipping point. If it stays under GETTEX:87K , we could see a drop to $80,806, and if that doesn’t hold, $75K is on the table. But if BTC breaks through GETTEX:87K , momentum could push it to $88,800, and a move past $92,121 would signal the correction is over and the uptrend is back. This is a key moment—let’s see where it goes.
Kris/Mindbloome Exchange
Trade Smarter Live Better

BTC SHORT TP:80,500 27-02-2025Bitcoin continues to display bearish patterns, particularly on the 1-hour timeframe. We can anticipate a movement towards the 80,000 - 81,000 zone, making it a good moment to consider a short position with a tight stop-loss.
This trade should materialize within 10 to 15 hours; otherwise, it will be deemed invalid. Stay updated and follow me to keep capitalizing on profitable opportunities!

BTC/USDT chart shows a Round Top (or Distribution) patternPattern Breakdown
Formation:
The chart displays a rounding top shape, where BTC price gradually increased, peaked, and then started declining.
The red shaded area represents the curved top, confirming a distribution phase.
Key Levels:
Peak: Around $110,000 (approx.).
Neckline/Support: ~$90,000, which was broken to the downside.
Measured Move: The expected drop is roughly equal to the height of the rounding top, which was around $21,300.
Breakdown & Target:
The price has broken below the $90,000 support level, confirming the pattern.
The expected price target based on the pattern is around $70,000, calculated using the height of the round top.
Additional Observations
Volume: There is an increase in volume at the breakdown point, which validates the bearish move.
Momentum: If BTC fails to reclaim $90,000, it may continue downward.
Conclusion
The chart signals a bearish trend continuation after breaking the neckline.
BTC could drop towards $70,000 unless buyers step in to regain momentum.
If BTC reclaims $90,000, the bearish scenario could be invalidated

BTC/USDT chart shows a Round Top (or Distribution) patternPattern Breakdown
Formation:
The chart displays a rounding top shape, where BTC price gradually increased, peaked, and then started declining.
The red shaded area represents the curved top, confirming a distribution phase.
Key Levels:
Peak: Around $110,000 (approx.).
Neckline/Support: ~$90,000, which was broken to the downside.
Measured Move: The expected drop is roughly equal to the height of the rounding top, which was around $21,300.
Breakdown & Target:
The price has broken below the $90,000 support level, confirming the pattern.
The expected price target based on the pattern is around $70,000, calculated using the height of the round top.
Additional Observations
Volume: There is an increase in volume at the breakdown point, which validates the bearish move.
Momentum: If BTC fails to reclaim $90,000, it may continue downward.
Conclusion
The chart signals a bearish trend continuation after breaking the neckline.
BTC could drop towards $70,000 unless buyers step in to regain momentum.
If BTC reclaims $90,000, the bearish scenario could be invalidated.
