BTC Breaks Highs: Bullish Trend Shift Possible ContinuationBTC has broken the previous high, signaling a shift in the trend. This marks a bullish change of character, and I'm watching for a retrace on the lower timeframe with a potential continuation to the upside. Keep an eye on a Fibonacci pullback to the 50-61.8% level on the previous four-hour swing for a possible bullish entry. This is not financial advice.
Btcupdate

Resistance Broken? BTC Aims for $96K!Falling Trendline Breakout
Bitcoin has broken above a descending trendline resistance, indicating a potential shift in momentum from bearish to bullish.
Entry Zone
The recommended buy zone is $91,500 to $90,500. Price is currently within this range, making it an ideal area for a long entry.
Stop Loss
A tight stop-loss at $89,500 helps minimize downside risk if the breakout fails.
Targets
Target 1: $92,000
Target 2: $93,000
Target 3: $94,000
Target 4: $95,000
Target 5: $96,000
Risk Management
Stop-loss placement is critical to avoid potential losses, with a strong downside risk below $89,500.
Recommendation
Watch for a sustained close above the breakout level and monitor volume confirmation for continued upside momentum. This trade aligns well with a bullish reversal structure and offers multiple profit-taking levels.

Bitcoin's Double Bottom Reversal1.Double Bottom Formation
Bitcoin has formed a double bottom pattern, signaling a potential bullish reversal.
The second bottom was created around $89,200, which acts as a strong support level.
2.Neckline Resistance at $91,200
The neckline of the double bottom pattern is at $91,200.
A daily close above $91,200 is crucial to confirm the breakout and initiate an upward move.
3.Bullish Scenario
If the price successfully breaks and closes above the neckline, a long position can be considered.
The breakout could lead to a potential price target of higher resistance zones, depending on momentum.
4.Risk Management:
If the price fails to sustain above $91,200, a retest of lower support ($89,200) could occur.
5. Key Levels to Watch
Support: $89,200
Resistance : $91,200 (neckline)
Bitcoin is showing signs of a bullish reversal from the double bottom pattern. Keep a close eye on the neckline breakout for confirmation before entering long positions.

What’s Next for BTC: $99K or $84K?Good Morning, Trading Family!
What’s Next for BTC: $99K or $84K?
Here’s the game plan: if BTC corrects up to $93K, $94K, or $96K, it could then pull back down to the $84K marker. But if BTC breaks $96K, we could see it climb to $99K.
This Sunday, I’m hosting a webinar on how emotions can hurt your trading and how to take control of your mindset for better results.
Send me a message or check out my profile for details. If this added value to your trading, like, comment, and share it with someone who needs it.
Kris/Mindbloome Exchange
Trade What You See

What to Expect from Bitcoin in 2025? BEARISH TREND #BTC 13-01-25Bitcoin already started BEARISH TREND, so far #BTC gave us bearish reversal signal, at the same time it is forming Bearish Trend for 2025.
Thank you and Good Luck to all traders of #BTC and crypto!

BTCUSDT: Red Lines Mark the Short-Term Shorting Zones
BTCUSDT: Red Lines Mark the Short-Term Shorting Zones 🚨
As you can see here: I shorted 102.500 level last time. I'm not going to build new position but I want to give some weak points on the chart.
We’re looking at key red lines on the chart—prime zones for short-term shorting opportunities. These aren’t just random lines; they’ve been carefully selected based on market dynamics. Let’s break it down:
Strategic Short Zones: The red lines represent areas where sellers are likely to step in. These are not long-term plays but quick, tactical shorts.
Market Context Matters: Always consider the broader trend. While these zones are ideal for shorts, confirmation from lower timeframes (like 1H or 15M) is essential.
Tools for Precision: I’ll use CDV, volume profile, and liquidation heatmaps to ensure the setup aligns with market sentiment.
Pro Tip: These short-term trades require agility—monitor price action closely and take profits quickly. The market rewards those who plan ahead and execute with precision.
Get ready, trade smart, and let’s make this another winning move. Boost, comment, and follow for more insights! 💥
Let me tell you, this is something special. These insights, these setups—they’re not just good; they’re game-changers. I've spent years refining my approach, and the results speak for themselves. People are always asking, "How do you spot these opportunities?" It’s simple: experience, clarity, and a focus on high-probability moves.
Want to know how I use heatmaps, cumulative volume delta, and volume footprint techniques to find demand zones with precision? I’m happy to share—just send me a message. No cost, no catch. I believe in helping people make smarter decisions.
Here are some of my recent analyses. Each one highlights key opportunities:
🚀 RENDERUSDT: Strategic Support Zones at the Blue Boxes +%45 Reaction
🎯 PUNDIXUSDT: Huge Opportunity | 250% Volume Spike - %60 Reaction Sniper Entry
🌐 CryptoMarkets TOTAL2: Support Zone
🚀 GMTUSDT: %35 FAST REJECTION FROM THE RED BOX
🎯 ZENUSDT.P: Patience & Profitability | %230 Reaction from the Sniper Entry
🐶 DOGEUSDT.P: Next Move
🎨 RENDERUSDT.P: Opportunity of the Month
💎 ETHUSDT.P: Where to Retrace
🟢 BNBUSDT.P: Potential Surge
📊 BTC Dominance: Reaction Zone
🌊 WAVESUSDT.P: Demand Zone Potential
🟣 UNIUSDT.P: Long-Term Trade
🔵 XRPUSDT.P: Entry Zones
🔗 LINKUSDT.P: Follow The River
📈 BTCUSDT.P: Two Key Demand Zones
🟩 POLUSDT: Bullish Momentum
🌟 PENDLEUSDT.P: Where Opportunity Meets Precision
🔥 BTCUSDT.P: Liquidation of Highly Leveraged Longs
🌊 SOLUSDT.P: SOL's Dip - Your Opportunity
🐸 1000PEPEUSDT.P: Prime Bounce Zone Unlocked
🚀 ETHUSDT.P: Set to Explode - Don't Miss This Game Changer
🤖 IQUSDT: Smart Plan
⚡️ PONDUSDT: A Trade Not Taken Is Better Than a Losing One
💼 STMXUSDT: 2 Buying Areas
🐢 TURBOUSDT: Buy Zones and Buyer Presence
🌍 ICPUSDT.P: Massive Upside Potential | Check the Trade Update For Seeing Results
🟠 IDEXUSDT: Spot Buy Area | %26 Profit if You Trade with MSB
📌 USUALUSDT: Buyers Are Active + %70 Profit in Total
🌟 FORTHUSDT: Sniper Entry +%26 Reaction
🐳 QKCUSDT: Sniper Entry +%57 Reaction
📊 BTC.D: Retest of Key Area Highly Likely
This list? It’s just a small piece of what I’ve been working on. There’s so much more. Go check my profile, see the results for yourself. My goal is simple: provide value and help you win. If you’ve got questions, I’ve got answers. Let’s get to work!

Bitcoin is BULLISHSee how Bitcoin did not take out the blue B leg, it also created bullish divergence on 4hr tf.

BITCOINBTC next reaction will be expected at 98K level. Once 98K is tapped we will see the reaction and decide if its further upside to down as an impulse

BTC Price Forecast: Will Accumulation Zones Lead to a 50% Surge?We are analyzing a BTC/USD weekly chart where the price is holding strong support above the rising trendline, marked in blue.
First Scenario:
After breaking out of the resistance trendline, the price rallied by 135%, as shown in the first green box. Notably, there was a small accumulation phase in the red-marked zone before the breakout.
Second Scenario:
Currently, the price is steadily moving upward, forming another small accumulation zone within the red-marked area. This pattern suggests a potential continuation of the bullish trend.
Outlook:
Based on these observations, the price could potentially rise an additional 50% from current levels. The Stochastic RSI supports this view, aligning well with the momentum seen in both scenarios.
Conclusion: The strong trendline support, recurring accumulation zones, and favorable momentum indicators point to further upside potential.

Bitcoin BTC Has Almost Finished Correction: $89k soon!Hello, Skyrexians!
In our recent analysis we told that this correction will not be finished without reaching GETTEX:89K , it almost impossible! Several days ago BINANCE:BTCUSDT surges above $102k which caused a lot of optimism on the market, but all these traders has been banished by the sudden dump. Why this drop was expected and promised GETTEX:89K will be reached anyway.
Let's take a look at the daily time frame. We can see the after reaching wave 3 top corrective wave 4 has been started. Wave 4 is a zigzag ABC. Corrective wave B has been finished exactly at 0.61 Fibonacci. Now price is forming wave C. This wave has the minimal target at 0.38 Fibonacci at $89k. There we can expect the signal on Bullish Reversal Bar Strategy to make sure with the high probability that correction is over and the next target is $120k. As always, alerts from this indicator are automatically replicated on my accounts. You can find the information in our article on TradingView . You can see the sniper entries for this indicator before.
Best regards,
Skyrexio Team
___________________________________________________________
Please, boost this article and subscribe our page if you like analysis!

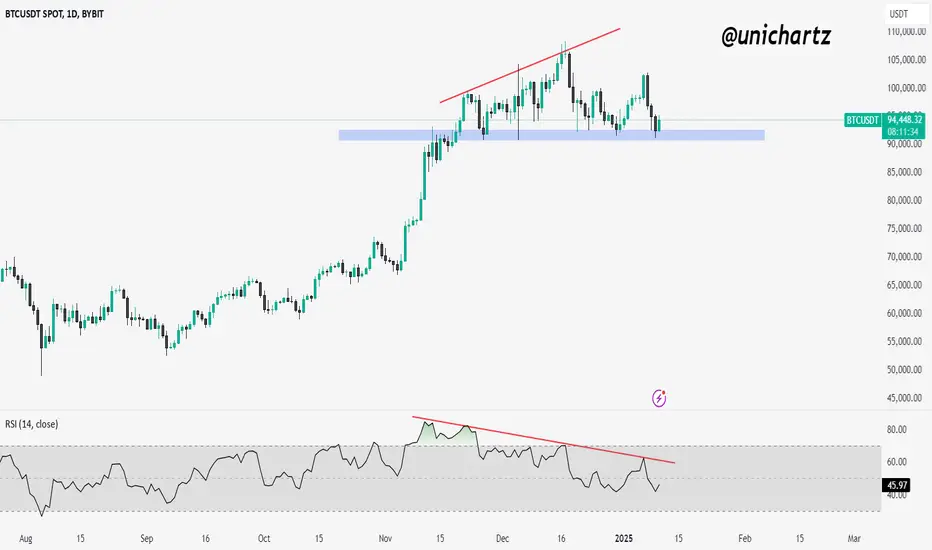
BTC Consolidates Near Support Amid Bearish SignalsBitcoin is currently trading near a crucial horizontal support zone, as marked on the chart. The price recently pulled back from its highs, forming a bearish divergence on the RSI, which suggests weakening momentum. However, the key support level around $90,700–$92,500 is holding firm for now, providing potential for a bounce.
If BTC manages to sustain above this support zone, we could see a recovery attempt. However, a breakdown below this critical level might trigger further downside, with the next possible target around $85,000. Traders should closely monitor the RSI and volume for confirmation of either a bounce or a break below the marked support.
Bitcoin Idea!"🌟 Welcome to Golden Candle! 🌟
We're a team of 📈 passionate traders 📉 who love sharing our 🔍 technical analysis insights 🔎 with the TradingView community. 🌎
Our goal is to provide 💡 valuable perspectives 💡 on market trends and patterns, but 🚫 please note that our analyses are not intended as buy or sell recommendations. 🚫
Instead, they reflect our own 💭 personal attitudes and thoughts. 💭
Follow along and 📚 learn 📚 from our analyses! 📊💡"

637% BTC Profit Secured Ride the Crypto Wave with Us !!!!🎉 Profit Alert!
Our BTC Long Position has delivered exceptional returns, booking 637% profit (20x leverage) on a partial exit. If you've been following my insights and trade setups, you’re likely celebrating significant gains by now! 🪙💵
If you haven’t followed us yet, you’re literally missing out on life changing opportunities! i would say 😎
This is the power of disciplined trading and precise analysis. But we’re not done yet! The trade is still active with the remaining position, safeguarded by setting the Stop Loss (SL) at the Breakeven Price, ensuring risk free potential for further gains.
This is what we do consistently identifying opportunities and executing strategies to maximize profits. If you’ve benefitted, it’s time to spread the word! Share our page with your network, boost this post, and help us grow this community of successful traders.
Stay tuned for more high quality setups and actionable insights. The journey to financial success doesn’t end here it only gets better. 🚀
Here is where Traders Thrive
Thank you for your continued trust and support! 💪

Bitcoin is at a critical point - Consider this very seriously!!Hey family! Welcome to the wild world of cryptocurrencies, where the market can swing from one extreme to another in the blink of an eye. Crypto trading is known for its high volatility, which means prices can go up or down dramatically in short periods. Right now, many traders are buzzing with excitement, expecting Bitcoin to go on a bullish run. However, in such a dynamic market, it's always wise to consider the other side of the coin. Given the current sentiment, there's a good chance we might see some bearish moves too. So, while we're all hoping for the best, let's keep our eyes open for potential dips and prepare accordingly. Let's dive into today's analysis with that in mind!
Overview
This report provides a detailed technical analysis of Bitcoin (BTC) against Tether (USDT), focusing on the Ichimoku Cloud and chart pattern formation in combination.
Head and Shoulders Pattern
Pattern Description: The chart shows a Head and Shoulders pattern, which is a bearish reversal pattern following an uptrend. It consists of three peaks: the left shoulder, the head, and the right shoulder.
Identification on Chart:
Left Shoulder : Formed around mid-November.
Head : Formed in Mid December, peaking at approximately $108,000+.
Right Shoulder: Currently forming as of Jan 10, 2025, with a peak slightly lower than the head formed on Jan 7th.
Neckline : The neckline is drawn at the price level where the dips occur between these peaks and it is a wise choice to take the price zone as a whole in to consideration instead of just a specific price level. By this the neckline zone can be taken as between $89,800 & $92,400. A breakout below this level suggests a strong trend reversal.
Ichimoku Cloud Analysis
The Ichimoku Cloud, or Ichimoku Kinko Hyo, provides insights into support/resistance, momentum, and trend direction .
Here's the breakdown:
Kumo (Cloud): The cloud is formed by two lines, Senkou Span A and Senkou Span B, projected 26 periods into the future.
Current Cloud: The price has recently broken below from the upper cloud support, which was acting as support, and heading to the bottom of the cloud. This breakout below the cloud is a bearish signal indicating potential further downside.
Future Cloud : The future cloud (shaded area ahead) is sloping upwards, which traditionally would suggest bullish momentum, but given the current price action below the cloud and the reddish color it created, it might imply a false bullish signal or a potential resistance if the price attempts to recover.
Tenkan-sen (Conversion Line) and Kijun-sen (Base Line):
Tenkan-sen : This line (blue) is the average of the highest high and lowest low over the last 9 periods. It's currently below the Kijun-sen, reinforcing the bearish sentiment.
Kijun-sen: This line (red) is the average of the highest high and lowest low over the last 26 periods. The price is below both lines, indicating bearish momentum.
Chikou Span (Lagging Span) : This line shows the current price action shifted back 26 periods, providing a historical perspective.
Position: The Chikou Span is below the price action from 26 periods ago, which is another bearish signal.
Kijun-sen Cross : The Tenkan-sen crossing below the Kijun-sen while both are below the cloud strengthens the bearish outlook.
Key Price Levels
Breakout Level: $89,800 (Neckline)
Current Price: Around $92,750
Resistance: Cloud top around $95,000 - $97,000 - $100,000.
Support : Below the neckline, potential support around $85,000 to $82,000.
Volume Analysis
Volume: While high/average volume during the formation of the head might suggests strong participation, the volume during the right shoulder formation is lower, possibly indicating reduced buying interest.
Last Note : As a confluence the Trend Strength Index is also showing a declining movement both the weekly and daily charts even though it it at floor levels on the 4 Hr chart. This basically tells us that we might see some dip movements in the following days if volume continue dumping like it does in the past 3 1D candles.
Conclusion
Using the Ichimoku Cloud, we observe several bearish signals for Bitcoin:
The price is below the cloud, indicating bearish momentum.
The Tenkan-sen is below the Kijun-sen, and both are below the cloud, reinforcing the bearish trend.
The Chikou Span is below past price action, further confirming the bearish scenario.
Despite the future cloud showing an upward slope, the current price action suggests a continuation of the downtrend, with the Head and Shoulders pattern serving as a strong bearish indicator. Traders should consider this analysis in light of overall market conditions, keeping in mind that while the Ichimoku provides comprehensive insights, market sentiment and external factors also play crucial roles. Watch for any potential retest of the neckline or cloud for further confirmation of the trend.
But instead of the bearish breakout to the downward, if Bitcoin can rebound from the current price level, it is going to be yet another strong bullish move for a formation of a megaphone which is unlikely though.
For risk management, always consider using stop-loss orders, especially in volatile markets like cryptocurrency.
Stay Tuned for further updates.
With Regards.
CTE.

BTC.D Breakdown the Next Altcoin Bull Run Closer Than You Think?Bitcoin dominance (BTC.D) is a crucial metric that reflects Bitcoin's market share relative to the overall cryptocurrency market. A rising dominance often signifies Bitcoin outperforming altcoins, while a declining dominance suggests increased strength in altcoins or a broader altcoin rally. The current chart provides critical insights into the state of Bitcoin dominance, the potential implications for market dynamics, and the timeline for future movements.
Key Observations and Technical Insights
1. Breaking the Rising Wedge Pattern
The weekly chart shows a classic rising wedge pattern that Bitcoin dominance has adhered to for an extended period. A breakdown from this pattern is a bearish signal, indicating a potential shift in dominance from Bitcoin to altcoins.
The wedge breakdown was accompanied by significant bearish momentum, validated by a retest of the breakdown level.
This technical development is a strong indication that BTC.D has entered a new phase of its trend.
2. Current Consolidation Zone
Following the breakdown, BTC dominance has entered a consolidation phase within the highlighted rectangular box (approximately between 53.2% and 58%).
The consolidation suggests market indecision as Bitcoin retains relative strength but altcoin activity starts to increase.
Volume levels during this phase are moderate, reflecting a lack of aggressive participation, which is typical before a major directional move.
3.Key Levels to Watch
Resistance: The upper boundary of the box (58%) aligns with prior rejection levels. A move above this could indicate a temporary resurgence of Bitcoin dominance, potentially due to increased Bitcoin-led market rallies.
Support: The lower boundary of the box (53.2%) is a critical support zone. A sustained break below this level could confirm the next bearish leg.
4. Indicators Supporting the Bearish Bias
Ichimoku Cloud: The dominance has started interacting with the cloud's lower boundary, which acts as dynamic resistance. A clean break below the cloud would further confirm bearish momentum.
MACD Divergence: The MACD histogram is tilting bearish, signaling weakening upward momentum. A bearish crossover on the MACD line would solidify downside expectations.
RSI: The RSI is trending near the midline, showing no extreme conditions. This gives room for further downside before entering oversold territory.
Market Implications and Projections
1. Impact of a Breakdown Below the Box
If BTC dominance decisively breaks below the 53.2% level, it will likely lead to a significant shift in market dynamics.
A drop toward the marked lower levels (approximately 48%, 42.8%, and 39.9%) would indicate the onset of an altcoin season, characterized by robust performance in altcoins.
Historically, such breakdowns in BTC.D have coincided with increased speculation and capital rotation into altcoins, signaling the start of a bull run across the cryptocurrency market.
2. Bull Run Timeline
The estimated timeline for this critical move is Q1 2025, which aligns with broader market cycles and macroeconomic expectations. Institutional interest in crypto, combined with improved market sentiment, could amplify this trend.
3. Potential Scenarios
Bullish Case for BTC.D: A reversal above 58% would require significant Bitcoin-led rallies, possibly fueled by macroeconomic uncertainty or a Bitcoin ETF approval. This scenario delays the altcoin season but strengthens Bitcoin as the primary investment vehicle.
Bearish Case for BTC.D: A sustained decline below 53.2% would confirm altcoin strength and could trigger rapid capital rotation into alternative assets, particularly in high-liquidity altcoins and DeFi protocols.
This chart provides a professional-grade analysis of Bitcoin dominance and its potential impact on market dynamics. The breakdown from the rising wedge, the ongoing consolidation, and the bearish indicators suggest that BTC.D is on the brink of a major directional move. Traders and investors should closely monitor the consolidation box boundaries and prepare for a shift in market structure as BTC dominance declines.
The Q1 2025 timeline for the next leg down aligns with historical patterns and macroeconomic projections. A break below 53.2% will likely usher in a new phase of the crypto market, driven by altcoin strength and increased retail participation. Stay vigilant, as this period could mark the beginning of the next crypto bull run.

BTC - TOP is NEARBTC is nearing its top. It still has a few more distribution to go but what better time for the final distribution than when Trump becomes president. After all he is "pro crypto" and time for BTC to go to 1million. Everything will be approved, USA will make BTC its reserve.. Blah, Blah, Blah.
This is not a financial advice, please do your DD.
Please support this idea.

Where To Buy The Blood On BTC & ALTsMartyBoots here , I have been trading for 17 years and sharing my thoughts on BTC and where to buy the BLOOD .
BTC looks weak so be careful
Do not miss out on the dip as it can be a life changing opportunity
Watch video for more details

BTC/USDT Breakout Strategy & Long SetupThe chart presents a clear structure for BTC/USDT on the 4-hour timeframe. After a significant retracement from the recent highs, BTC has formed a descending channel, which it has now broken out of, signaling potential bullish momentum.
Chart Observations
Descending Channel Breakout
BTC was trading in a well-defined descending channel, consolidating near a critical demand zone. The breakout above this channel suggests a potential reversal in trend.
Key Support Zone
The price has respected the support range between $94,800 and $95,400, which aligns with a high-volume area and serves as a strong buy zone. Buyers have consistently stepped in here to defend this level.
Demand Zone Test
A retest of this support zone has provided a new opportunity to accumulate long positions. The candlestick wicks and volume activity indicate significant buying pressure in this area.
Ascending Channel Formation
Post-breakout, BTC is trading within an ascending channel, which offers potential upside targets as the price moves towards the upper resistance trendline.
Short-Term Pullback Completed
The previous bearish movement was capped at the support zone, with the "short position" trade closed as the price reversed into bullish territory. This reversal strengthens the case for a long position targeting higher levels.
Volume and Momentum
Increasing volume near the breakout and demand zone suggests that buyers are regaining control. Momentum indicators (not shown here) likely confirm this bullish bias.
Key Insights for the Trade Idea
Buy Zone The optimal entry for this trade is between $94,800 and $95,400, coinciding with the retest of the support zone and the lower trendline of the ascending channel.
Stop Loss: A tight stop loss at $92,574 protects against downside risk while allowing room for natural price fluctuation.
Targets: Gradual profit-taking is recommended at the following resistance levels, derived from Fibonacci extensions and key price levels.
Targets 🎯:
$96,333 – Immediate resistance and the first key level of profit-taking.
$97,285 – Mid-range resistance within the ascending channel.
$98,230 – Upper mid-point of the bullish channel.
$99,212 – Close to psychological resistance and ascending channel boundary.
$100,211 – Psychological round number and major resistance zone.
Stop Loss
$92,574: Positioned below the critical support zone to avoid invalidating the bullish setup.
This setup presents a high-risk-to-reward opportunity with clear entry, exit, and risk management strategies. Adjust position size according to your trading plan and always adhere to risk management principles.

BTCUSDT What gonna happen?!!!Here is the both side of story market may show, 93,000-91,800 is the most important support level here... Not lets see if market breaks it or respects it.

BITCOIN PREDICTION HIGH RECORD?Bitcoin is preparing for an explosive move that could take it to unprecedented heights, reaching for the moon! With all-time high records potentially in sight, this is the moment to stay strong and hold on. For those considering jumping in, now might be the perfect time to buy and secure your position before the rocket takes off. 🌕🚀

Bitcoin updateBitcoin update...
The LTF CME gap got filled... And the liquidity on the lows has almost been taken...
Waiting for confirations to long the market...
Patience is key...

BTCUSDT - CRYPTO | 4H | DOWNHey guys,
Yesterday, there was a lot of manipulation in BINANCE:BTCUSDT , causing many people to take losses due to the actions of market movers. However, I’m hopeful about the day Trump takes the presidential seat. Please, don’t panic right now—those who act out of panic tend to experience consistent losses.
I’ve marked the key points on the chart. If you’d like to see more of these analyses, don’t forget to hit the like button. Much love and respect to all of you, my dear followers! 🙌📊✨

BTC/USDT Pullback to Key SupportThe chart highlights Bitcoin's breakout from a symmetrical triangle formation, followed by a pullback to a critical support level. This price action indicates a period of consolidation before the next significant move.
Key Observations
1. The breakout from the symmetrical triangle has propelled the price upward, signaling bullish momentum.
2. The area around $97,100 is a crucial support level where buyers may step in.
3. A breakdown below $97,100 could lead to further downside, indicating a continuation of the pullback.
4. If the price holds above this support, a strong bounce and continuation of the uptrend are expected.
Strategic Implications
Monitor the $97,100 level closely. A strong defense of this support could provide an opportunity for long positions, targeting the next resistance levels.
Conversely, a confirmed break below $97,100 would warrant caution, as it may signal further downside.
Patience and careful observation are essential to capitalize on the next move effectively.
