BTC SCALP TRADE / Long Setupwait for the entry, must use SL. If final tp is achieved then trade is not valid, active till final tp. Must use proper risk management. Expecting upside move. If SL hit then take previous trade, It's still valid.
Btcupdate

BTC Storm of Consolidation, New Money, and Macro-PoliticsBitcoin at the Precipice: A Perfect Storm of Consolidation, New Money, and Macro-Political Tailwinds
In the intricate and often tempestuous world of digital assets, there are moments of frantic volatility and periods of eerie calm. Bitcoin, the undisputed king of cryptocurrencies, currently finds itself in one of these fascinating lulls—a state of high-altitude consolidation that is anything but sleepy. Trading just a whisper away from its all-time high, the asset is coiling like a spring, absorbing immense selling pressure from early adopters while simultaneously drawing in a new, powerful wave of buyers. This delicate equilibrium, however, is set against a backdrop of explosive potential catalysts. From tightening technical indicators screaming of an imminent breakout to the looming deadline of US tariffs, the vocal endorsement of tech titans, and the unprecedented entry of Bitcoin into the mainstream political arena, the stage is being meticulously set. The question on every analyst's and investor's mind is no longer if Bitcoin will make its next major move, but when, and just how monumental it will be. This is not just another market cycle; it is a convergence of forces that could propel Bitcoin toward price horizons that were once the domain of only the most fervent optimists.
The Anatomy of a Healthy Consolidation: Whales Recede as a New Foundation is Built
At first glance, a market that stalls just below its peak might seem like a sign of weakness, an indication that the bullish momentum has been exhausted. However, a deeper look into the current structure of the Bitcoin market reveals a picture of profound strength and maturity. This period of consolidation is characterized by a crucial and healthy rotation of ownership. The so-called "whales"—early investors and large-scale holders who have accumulated vast quantities of Bitcoin at much lower prices—are beginning to ease their holdings. This is not the panic-selling seen during bear market capitulations. Rather, it is a strategic and logical process of taking profits, de-risking portfolios, and realizing life-changing gains after a historic run.
Every Bitcoin sold by a whale must be bought by someone else, and the identity of these new buyers is what makes the current phase so compellingly bullish. The supply being released onto the market is not causing a price crash; instead, it is being steadily absorbed by a fresh cohort of participants. This new wave includes a diverse mix of players: retail investors who are gaining confidence as Bitcoin solidifies its mainstream status, smaller institutional players who are now more comfortable entering the market, and, most significantly, corporations that are beginning to view Bitcoin as a legitimate treasury reserve asset. This process is akin to the changing of the guard. The early pioneers are passing the baton to a new generation of holders who are establishing a new, higher cost basis. This dynamic is incredibly constructive for long-term price stability. It builds a robust and formidable wall of support at these elevated price levels, transforming what was once a speculative peak into a solid foundation for the next leg up.
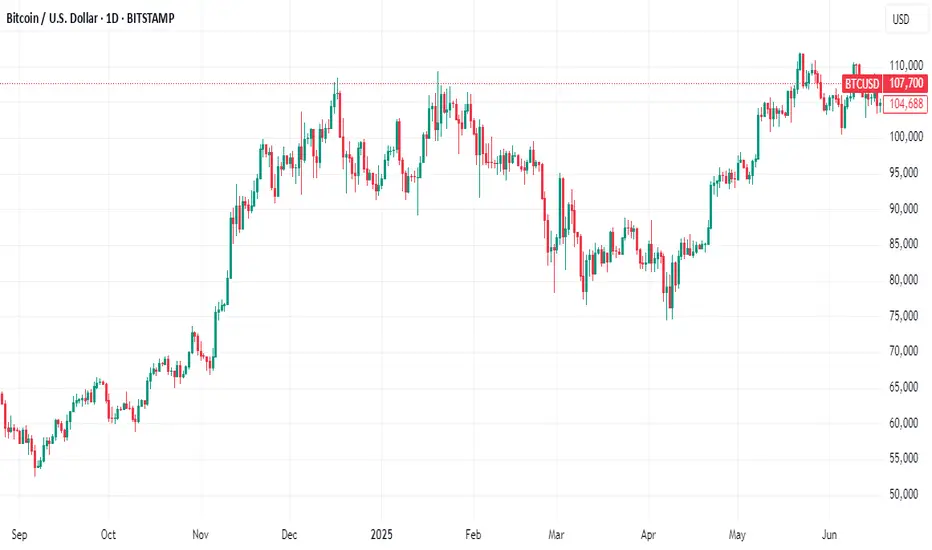
Further evidence of this underlying strength can be seen in Bitcoin's recent weekly performance. The asset has managed to set another record high weekly close. In the world of technical analysis, a weekly close is considered far more significant than a brief, volatile intraday spike. An intraday high can be the result of a short-lived speculative frenzy or a liquidation cascade, but a high weekly close demonstrates sustained buying pressure and conviction over a longer duration. It signifies that, for seven straight days, buyers successfully defended higher price levels against sellers, ultimately winning the battle as the candle closed. This repeated ability to secure high weekly closes indicates that the market is systematically accepting and validating these new price territories, creating a psychological and technical launchpad for a future assault on all-time highs. Traders are now intensely focused on this dynamic, attempting to pinpoint the new, higher bottoms of this consolidation range, recognizing that these levels are likely to serve as the bedrock for the next major bull run.
The Technical Cauldron: Bollinger Bands Signal an Imminent and Violent Breakout
While the fundamental picture is one of healthy rotation, the technical charts are sending an even more urgent message: prepare for a massive move. Among the myriad of indicators used by traders, the Bollinger Bands are currently painting a particularly dramatic picture. Bollinger Bands consist of three lines plotted over a price chart. The middle band is a simple moving average, while the upper and lower bands are positioned at a set number of standard deviations away from the middle band. In essence, they are a direct measure of market volatility. When the market is volatile, the bands widen. When the market is calm and consolidating, the bands contract, or "squeeze."
Bitcoin is currently in the midst of one of the most significant Bollinger Band squeezes seen in recent history. The upper and lower bands have drawn incredibly close to one another, indicating that volatility has been wrung out of the market to an extreme degree. Historically, such periods of low volatility are the calm before the storm. A Bollinger Band squeeze is almost always resolved by a period of explosive, high volatility—a powerful breakout. The longer and tighter the squeeze, the more violent the subsequent price move tends to be. The indicator itself does not predict the direction of the breakout, but in the current context, the directional bias is overwhelmingly clear. With Bitcoin consolidating just shy of its all-time high after a powerful uptrend, and with the fundamental backdrop being so strong, the path of least resistance is overwhelmingly to the upside.
This technical setup creates a powerful psychological feedback loop. As more traders and algorithms spot the tightening bands, they begin to position themselves for the inevitable breakout. This builds a massive amount of potential energy within the market. When the price finally does break through the upper band, it can trigger a cascade of buy orders—from traders entering new long positions, to short-sellers being forced to buy back to cover their losing bets. This rush of buying pressure is what can turn a simple breakout into a parabolic, face-ripping rally.
The anticipation surrounding this move has led to some audacious price targets being discussed. Analysts are now contemplating the possibility of a "false move" to as high as $105,000. The term "false move" in this context is intriguing. It could imply a rapid, almost wick-like surge to that level, driven by extreme speculation and leverage, which might then be followed by a sharp correction to shake out the "paper hands" before a more sustainable climb resumes. Alternatively, it could simply be a way of expressing disbelief at the sheer velocity of the potential move. Whether the target is $105,000 or another figure, the underlying message from the charts is unambiguous: Bitcoin is on the verge of a big move, and the technicals strongly suggest it will be a powerful breakout to the upside, potentially ushering in a new phase of price discovery.
The Confluence of Catalysts: Tariffs, Politics, and The Musk Effect
A primed technical setup is potent on its own, but when combined with powerful external catalysts, it creates the recipe for a perfect storm. Bitcoin's next potential move is not just being driven by its internal market dynamics; it is being pulled forward by a confluence of macroeconomic and political forces that are aligning in its favor.
One of the most significant near-term catalysts is the looming US tariff deadline. Historically, periods of geopolitical tension and economic uncertainty have been incredibly bullish for Bitcoin. Tariffs, trade wars, and protectionist policies create instability in global markets and can erode the value and trust in fiat currencies. As nations engage in economic conflict, savvy investors and even central banks begin to look for non-sovereign, censorship-resistant stores of value to hedge their wealth. Bitcoin, with its decentralized nature and fixed supply, is the ultimate hedge against such fiat currency debasement and geopolitical turmoil. The impending tariff deadline is forcing a global conversation about the stability of the current financial system, and Bitcoin stands to be a primary beneficiary as capital seeks a safe haven from the storm.
Adding fuel to this fire is the upcoming "Crypto Week," a period of heightened focus on the industry through conferences, major announcements, and media coverage. These events act as a gravitational force, pulling the attention of the financial world toward the digital asset space. This concentrated attention almost always leads to increased trading volume and volatility. It creates a self-fulfilling prophecy where the expectation of big news and market moves encourages traders to participate, thereby creating the very volatility they anticipated.
Perhaps the most electrifying and unpredictable catalyst, however, is the re-emergence of Elon Musk's "love" for Bitcoin and the asset's dramatic entrance onto the main stage of American politics. Musk, with his colossal social media following, has a proven and unparalleled ability to influence market sentiment with a single post. His recent teasing of a "Pro-Bitcoin America Party" has sent shockwaves far beyond the crypto community. This move, whether serious or satirical, has injected Bitcoin directly into the heart of the US political discourse. It reframes Bitcoin not just as a financial asset, but as a political symbol—a representation of innovation, decentralization, and freedom from government control.
This has been met with a reaction from other major political figures, including Donald Trump, creating a fascinating push-and-pull. The fact that leading presidential candidates and political influencers are now debating Bitcoin's merits and role in the nation's future is a monumental step in its journey toward mainstream legitimacy. It forces the public and policymakers to take it seriously. This political theater creates an environment where assets perceived as being aligned with pro-growth, pro-innovation, and pro-freedom ideologies can thrive. The emergence of a "BTC Bull Token" or similar concepts tied to this political momentum underscores the new reality: Bitcoin is no longer just a tech story; it is a powerful political and cultural movement, and this new dimension is likely to attract a wave of capital from those who align with its burgeoning ideology.
The Institutional Stamp of Approval: A Corporate Treasury Revolution
While retail excitement and political drama provide the fuel, the institutional adoption of Bitcoin provides the solid, unshakeable foundation for its long-term trajectory. The most powerful recent example of this trend is the announcement from Genius Group, a publicly traded education technology company, that it is increasing its Bitcoin treasury target to a staggering 10,000 BTC. This is not a speculative trade; it is a profound strategic shift in corporate treasury management.
This decision signifies that corporate boards and CFOs are beginning to understand and act upon Bitcoin's value proposition as a superior treasury reserve asset. In an era of persistent inflation and low-to-negative real yields on traditional assets like government bonds, holding large amounts of cash on a balance sheet is a guaranteed way to lose purchasing power. By allocating a portion of its treasury to Bitcoin, Genius Group is taking a proactive step to protect its shareholders' value from the ravages of monetary debasement. It is a declaration of confidence in Bitcoin's long-term potential as a reliable store of value.
The importance of such a move cannot be overstated. It provides a powerful stamp of approval and a case study for thousands of other corporations around the world. When one publicly traded company makes such a bold move and outlines its rationale, it normalizes the strategy. Other CFOs, who may have been hesitant, now have a blueprint to follow and a precedent to point to when presenting the idea to their own boards. This has the potential to unlock a veritable floodgate of corporate capital. Even a small, single-digit percentage allocation from the treasuries of the S&P 500 companies would represent hundreds of billions of dollars of new, sustained buying pressure for Bitcoin. The move by Genius Group is not an isolated event; it is the leading edge of a seismic shift in how the corporate world perceives and utilizes money.
Conclusion: The Dawn of a New Epoch
Bitcoin stands at a historic inflection point. The current period of quiet consolidation is deceptive; beneath the surface, a powerful confluence of forces is converging to launch the asset into its next major chapter. The market's internal structure has never been healthier, with the holdings of early whales being patiently absorbed by a new and committed class of buyers, building a formidable price floor far above previous highs. The technical charts are screaming of an imminent and powerful breakout, with the tightening Bollinger Bands signaling a massive release of energy that heavily favors the upside.
Layered on top of this potent technical and structural setup is a perfect storm of external catalysts. The specter of global economic instability driven by tariffs, the focused attention of a "Crypto Week," the unparalleled influence of figures like Elon Musk, and the shocking but legitimizing entry of Bitcoin into the partisan political arena are all acting as powerful tailwinds. This is all underpinned by the quiet but revolutionary trend of institutional and corporate adoption, which promises to bring waves of new capital into the asset for years to come.
The consolidation will soon end. The question is not about direction, but about magnitude. The forces at play are no longer just about market cycles; they are about a fundamental repricing of a global, non-sovereign asset in a world grappling with economic and political uncertainty. The stage is set for a breakout that could not only shatter previous all-time highs but could also permanently elevate Bitcoin's status, solidifying its role as a cornerstone of the 21st-century financial and political landscape.
7.7 Analysis of the latest BTC trend and operation layout📊 Cautious wait-and-see strategy (Recommendation index ⭐️⭐️⭐️⭐️⭐️)
📰 News information:
1. Digital Market Asset Transparency Act
2. Anti-CBDC Regulation Act
3. US Stablecoin Innovation Act
📈 Technical Analysis:
At present, the price of BTC is around 109,000, and the overall narrow fluctuation pattern continues. The market as a whole lacks clear direction. However, it is worth noting that the trading volume has dropped to 30.1 billion US dollars, which has further shrunk compared with the previous day, reflecting a decline in market participation.
In my opinion, the driving factors of the market include the following:
1. The continued activity of ancient whales has attracted attention
2. The technical side shows that the momentum is weakening
3. Market sentiment has turned neutral
4. ETF fund inflows remain strong
5. The "Crypto Week" policy catalyst is coming
Currently, BTC continues to consolidate within the upward trend line, but the momentum indicator shows fatigue, the 4H Bollinger Bands shrink, and the price is running near the middle track of 108,400. Enter the market cautiously during the day and pay attention to the support of 107,000
🎯 Trading Points:
SELL 109,000-110,000
TP 107,500-107,000
In addition to investment, life also includes poetry, distant places, and Allen. Facing the market is actually facing yourself, correcting your shortcomings, facing your mistakes, and being strict with yourself. I share free trading strategies and analysis ideas every day for reference by bros. I hope my analysis can help you.
BITSTAMP:BTCUSD

Bitcoin BTC Trade Plan: Watching for Breakout or Pullback Entry📊 Currently watching BTC (Bitcoin) as price action remains bullish overall, but we're approaching a key decision point 🎯
💹 Price is pushing higher, but with some signs of exhaustion after the recent rally ⚠️ — and with the weekend approaching, we could either see a continuation higher or a healthy pullback
I’m keeping an eye on two potential trade scenarios:
1️⃣ A break and clean retest of the recent high, which could offer a continuation long if momentum follows through 🚀
2️⃣ A retracement into equilibrium — a deeper pullback toward fair value 📉 — which could also present a high-probability long setup if confirmed with structure and reaction 📈
Either way, I’m letting the market reveal its hand and waiting for one of these setups to play out before committing 💡
💬 Not financial advice — always assess your own risk and confirm with your own analysis.

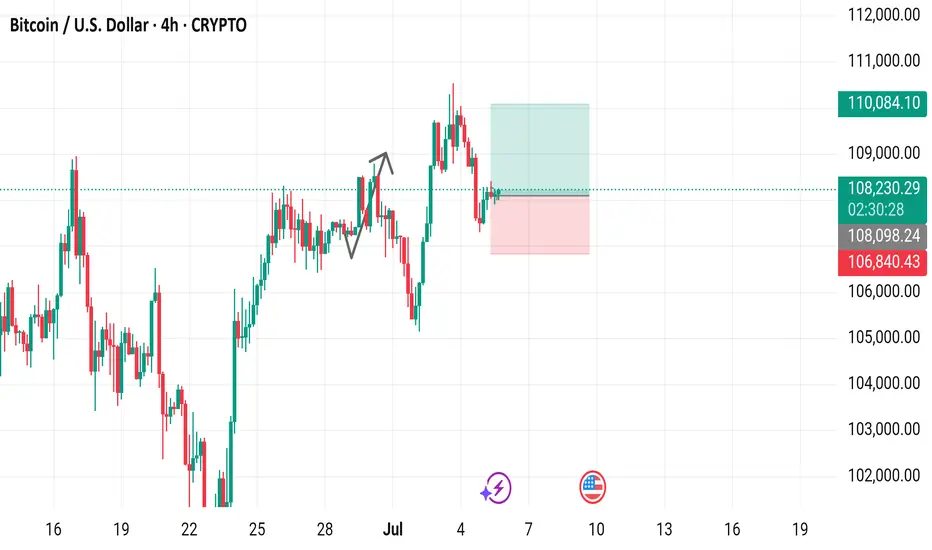
Bitcoin / U.S. Dollar 4-Hour Chart - CRYPTO4-hour candlestick chart displays the Bitcoin (BTC) to U.S. Dollar (USD) price movement, currently at $108,252.17 with a 0.21% increase (+$230.82). The chart highlights a recent upward trend with key price levels marked, including a buy price of $108,252.17 and a sell price at the same level. Support and resistance zones are indicated with a pink shaded area around $106,840.43 to $108,252.17 and a green shaded area near $110,084.10. The chart spans from late June to July 7, 2025, with the latest data point at 06:27 PM PKT on July 5, 2025.
BTC: 650 Point Long Trade To 108,650$ (Date: Sat 05 Jul 25)High potential signal as my all signals. Don't miss this opportunity. At least open a trade in demo just to test.
Details:
Entry: Now - 108,100 $
Target Price: 108,650 $
Stop loss: 107,700 $
Trade Ideas:
There is a flag pattern here after a good down trend. So here is possibility for a small pull back till my target price.
Trade Signal:
I provide trade signals here so follow my account and you can check my previous analysis regarding BITCOIN. So don't miss trade opportunity so follow must.
BINANCE:BTCUSDT BINANCE:BTCUSDT.P BYBIT:BTCUSDT.P

BTCBTC has done exactly what we expected, wait for the drop now before you look for further buys.
Disclosure: We are part of Trade Nation's Influencer program and receive a monthly fee for using their TradingView charts in our analysis.

Bitcoin May See Short-Term Pullback After Hitting $108,000📊 Market Overview:
Bitcoin surged to $108,000 amid renewed risk-on sentiment, a softer US dollar, and slightly declining bond yields. However, weekend trading sees lower liquidity, and some profit-taking has emerged. Traders are also cautious ahead of next week’s Fed-related news.
📉 Technical Analysis:
• Key Resistance: $108,500 – $110,000
• Nearest Support: $106,200 – $105,500
• EMA 09 (1H): Price is above EMA 09, indicating bullish momentum remains.
• Candlesticks & Volume: Doji candle and falling volume in 1H → suggests weakening upside momentum and possible retracement.
📌 Outlook:
Bitcoin may face a short-term pullback if it fails to break above $108,500 and no fresh catalysts emerge. Holding above $106,200 would keep the broader bullish structure intact.
💡 Suggested Trade Setup:
🔻 SELL BTC/USD at: 108,200 – 108,500
🎯 TP: 106,800
❌ SL: 109,300
🔺 BUY BTC/USD at: 106,200 – 105,500
🎯 TP: 107,800
❌ SL: 104,800

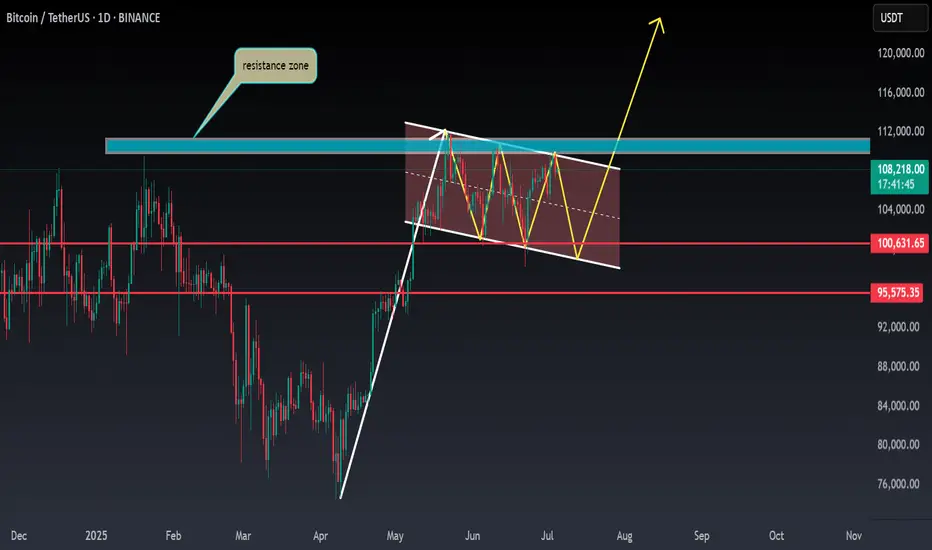
BTC ANALYSIS🌸#BTC Analysis : Bullish Trend 🚀🚀
🚀As we can see that there is a formation of Flag & Pole Pattern in #BTC in daily time frame. Right now we can see that #BTC again retest from the resistance zone and we can see a bounce back from its support zone 💪
🔖 Current Price: $1,08,050
⏳ Target Price: $1,20,000
⁉️ What to do?
- We can trade according to the #BTC chart and make some profits. Keep your eyes on chart price action, observe trading volume. Always observe market sentiments and update yourself everyday.🔰🔰
#BTC #Cryptocurrency #Breakout #TechnicalAnalysis #DYOR
BTC/USD Bullish Reversal Breakout Pattern BTC/USD Bullish Reversal Breakout Pattern 🚀
Technical Analysis:
🔹 Trend Reversal: The chart shows a clear inverse head and shoulders pattern highlighted with orange circles — a strong bullish reversal signal after a downtrend.
🔹 Breakout Zone: The neckline resistance around 108,000 USD has turned into support (marked as “SU00QT” due to a typo, assumed to be “SUPPORT”). Price action is consolidating just above this zone.
🔹 Trendline Support: The upward blue trendline confirms bullish structure, with price forming higher lows. Recent price action is bouncing off this trendline, showing strength.
🔹 Bullish Confirmation: Green arrows indicate strong bullish rejections from key levels, aligning with breakout retests.
🔹 Target Projection: The measured move from the inverse head and shoulders pattern projects a target towards the 114,000 USD resistance zone 📦 highlighted above, suggesting a potential 5-6% upside move 📊.
Conclusion: As long as price holds above the 108,000 support zone and the ascending trendline, BTC/USD remains bullish with potential continuation towards 114,000 USD. A breakout above minor consolidation could trigger a strong bullish rally 💥.
🛑 Invalidation: A sustained break below 106,000 USD would invalidate the bullish structure and may lead to further downside.

BTC SCALP Tradeas long as BTC doesn't closes below the mentioned area on 1hr tf, it will bounce and hit the fresh sellers SL. Once we have a closing below the area it can take correction upto 98-97K area.

Bitcoin Euro is €82,000 nextIn this video I go through an idea that may take bitcoin down to the €82,000 region .
I cover the current price action and run through a scenario of bitcoin coming down to the Newley spawned quarterly pivots and faking out at the value area low before coming back up into the range .
The tools I used in the video are quarterly pivots , anchored vwap , Fibonacci, fixed range volume profile and a tpo chart .
Appreciate your following and Good luck with your trading !

BTC shorting opportunity comes againBTC climbed above 108000 again, and the short-term bullish power was slightly stronger. According to the current strength, BTC still has room for growth, but it is still under pressure in the 109000-110000 area in the short term; if there is no major positive news, BTC may find it difficult to break through the resistance area in the short term under the current conditions, and may even experience stagflation and retreat again after approaching the resistance area.
Therefore, I think shorting BTC with the help of the resistance area is still the first choice for short-term trading. We can boldly short BTC in the 108500-109500 area and look towards the target area around 106000 again.

BTC Trade SetupBTC will not take any major correction until it sweeps upside liquidation and close with big red candle, So take the long only on BTC. Wick possible below the SL. I will hold the trade without sl if it comes to entry, if tp achieved first then ignore the trade. Also July breakout possible for BTC, July always positive for BTC, let's see.

Bitcoin Eyes Breakout if Clears $114,000📊 Market Overview:
• Bitcoin trades around $109,350, with an intraday high near $109,610
• Rosenberg Research notes BTC could rally ~6% to clear $114,000, potentially triggering a 25% rise to $143,000 on the back of ETF inflows, a weaker dollar, and Fed rate cut expectations
📉 Technical Analysis:
•Key Resistance: ~$114,000; followed by the psychological $112,000 zone .
•Nearest Support: $107,000 (prior highs/descending channel bottom) and key floor at $100,000
•EMA Levels:
o Price consolidates near 50-day EMA ($105,800), a crucial confluence zone
•Candlestick/Momentum:
o RSI near 50 (neutral),
o Flag pattern breakout suggests continuation potential
📌 Viewpoint:
Bitcoin may extend its rally if it breaks above $114,000, targeting $137,000–$143,000. If rejected, a pullback toward $107,000 is likely before bouncing.
💡 Suggested Trading Strategy
SELL BTC/USD at: $113,500–$114,000
🎯 TP: $110,000–$110,500
❌ SL: $114,500
BUY BTC/USD at: $107,000–$108,000
🎯 TP: $112,000–$113,000
❌ SL: $106,000

Navigating BTC the Volatile Path to a Potential $117,000 PeakBitcoin at a Crossroads: Navigating the Volatile Path to a Potential $117,000 Peak
Introduction: A Tale of Two Forces
The world of Bitcoin is once again a theater of high drama. After a breathtaking surge that brought the digital asset tantalizingly close to its all-time high, the market now stands at a pivotal crossroads, caught in a tense tug-of-war between powerful bullish undercurrents and formidable macroeconomic headwinds. On one side, a confluence of unprecedented institutional adoption, potent on-chain signals, and a volatile derivatives market suggests an imminent price explosion. Analysts and investors whisper of a short-term upper bound of $117,000, with some seeing a potential tap of $116,000 as early as July amid a ‘perfect storm’ of macro catalysts. A move to this level would represent a significant 6.45% jump from Bitcoin’s recent price, a leap that seems entirely within reach when viewed through the lens of the asset's internal momentum.
Yet, on the other side stands the unyielding wall of global economic reality. Bitcoin’s recent attempt to decisively conquer the $110,000 level was swiftly reversed as strong U.S. jobs data and other factors tempered expectations of a near-term Federal Reserve rate cut. This macroeconomic reality has cast a long shadow over risk assets, including Bitcoin, creating significant resistance at the previous all-time high of around $112,000. Analysts point to an absence of new, retail-driven buyers and the kind of "FOMO-driven greed" that characterized previous bull runs as a key factor pinning the price down.
This creates a fascinating and high-stakes dichotomy. The very structure of the Bitcoin market has undergone a "paradigm shift," with institutional exchange-traded funds (ETFs) providing a steady, relentless stream of demand. At the same time, the asset remains tethered to the decisions of central bankers and the health of the global economy. This article will delve into the intricate layers of this conflict, exploring the powerful bull case built on on-chain data and market structure, the sobering macroeconomic headwinds, the psychological barrier of the all-time high, and the long-term predictions that see Bitcoin potentially reaching $200,000. As the market braces for pivotal events like the upcoming Jackson Hole Economic Symposium, the question on every investor's mind is which of these two powerful forces will ultimately dictate Bitcoin's next monumental move.
The Bull Case: A Cauldron of On-Chain and Derivatives Strength
Bitcoin’s impressive rally was not a random speculative whim; it was underpinned by a bedrock of strong on-chain and technical signals that paint a compelling picture of underlying market health and explosive potential. These indicators, which provide a transparent view into the blockchain’s activity, suggest that the current price action is just the beginning.
On-Chain Analysis: The Blockchain's Transparent Ledger
On-chain analysis is the practice of examining the public and immutable data on a blockchain to understand the behavior of network participants. Unlike traditional financial markets, where investor actions are opaque, Bitcoin’s ledger allows for a granular assessment of transaction volumes, wallet balances, and investor profitability, offering a data-driven glimpse into market sentiment.
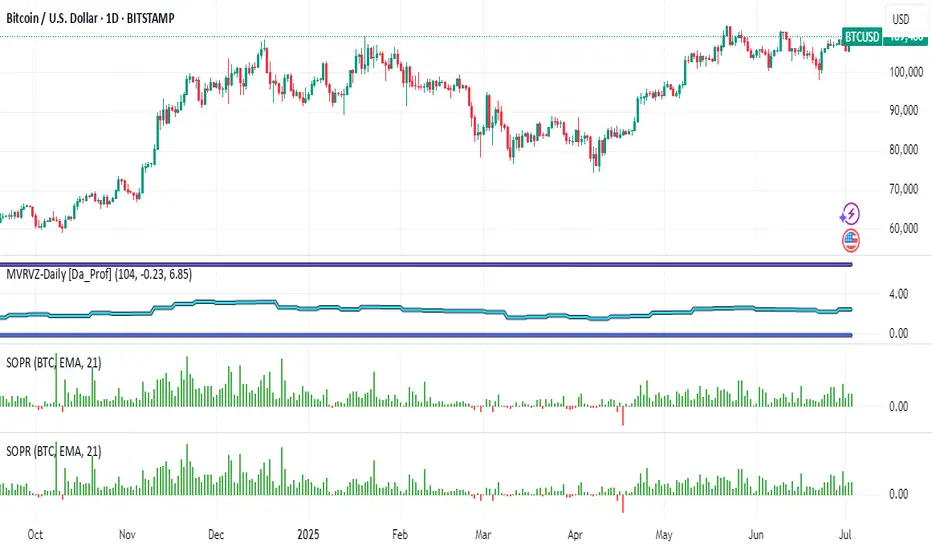
Two of the most powerful on-chain metrics in this context are the Market Value to Realized Value (MVRV) ratio and the Spent Output Profit Ratio (SOPR).
The MVRV ratio is a fundamental valuation tool that compares Bitcoin's total market capitalization to its "realized capitalization." While market cap is the current price multiplied by all coins in circulation, realized cap values each coin at the price it was last moved on-chain. Essentially, MVRV compares the current market price to the average cost basis of all investors. A high MVRV ratio suggests the market is overheated, while a ratio below 1.0 signifies that the average investor is underwater, a condition often seen at market bottoms.
The Spent Output Profit Ratio (SOPR) offers a more immediate look at market behavior by analyzing the profitability of transactions occurring on the network. It is calculated by dividing the sale price of a Bitcoin by the price it was last acquired.
• When SOPR is greater than 1, it means that, on average, coins being sold are in profit.
• When SOPR is less than 1, it means coins are being sold at a loss.
• A SOPR value of 1 acts as a critical psychological level. In bull markets, the market often "bounces" off this line, as investors are reluctant to sell at a loss, creating strong support.
The Derivatives Market: Funding Rates and the Looming Short Squeeze
Beyond the blockchain itself, the cryptocurrency derivatives market provides another layer of bullish sentiment. This market is dominated by perpetual futures contracts, which use a funding rate mechanism to stay tethered to the spot price.
• Positive Funding Rate: When the futures price is higher than the spot price, longs pay shorts, indicating dominant bullish sentiment.
• Negative Funding Rate: When the spot price is higher than the futures price, shorts pay longs, indicating dominant bearish sentiment.
Paradoxically, a deeply negative funding rate can be an extremely bullish contrarian indicator. A crucial historical precedent exists: Bitcoin price rallied 80% the last time BTC funding rates flipped red. When funding rates are negative, it means a large number of traders are shorting the market. If the price begins to rise against them, these short sellers must buy back Bitcoin to close their positions and limit their losses.
This forced buying can trigger a "short squeeze." A large cluster of potential short liquidations has been identified near the $111,320 level, with an estimated $520.31 million in leveraged positions at risk. If the price can push through this zone, it could trigger a cascade of liquidations, providing the fuel to accelerate Bitcoin’s next leg higher into price discovery. This mechanism represents one of the most powerful potential catalysts for a rapid move toward the $116K-$117K target.
The Macroeconomic Maelstrom: A "Perfect Storm" of Headwinds
While Bitcoin’s internal metrics flash green, its path is being obstructed by a formidable storm of macroeconomic factors. In today's interconnected financial world, no asset is immune to the policies of central banks. The recent reversal from the push beyond $110,000 is a stark reminder of this reality, as markets began to discount the odds of the Federal Reserve lowering interest rates.
The Federal Reserve and Interest Rate Jitters
For the past several years, the price of Bitcoin has been highly correlated with monetary policy. A policy of low interest rates generally creates a favorable environment for assets like Bitcoin by lowering the opportunity cost of holding them compared to bonds or savings accounts. Conversely, a period of monetary tightening—characterized by higher interest rates—has a negative effect on Bitcoin's price.
The market's sensitivity to this was on full display when strong U.S. economic data reinforced the case for keeping rates "higher for longer" to contain inflation. This immediately took the wind out of Bitcoin’s sails and halted the rally. An unexpected rate cut, however, could send Bitcoin back toward its all-time high of $112,000.
All Eyes on Jackson Hole
This brings into focus the immense importance of the Jackson Hole Economic Symposium. This annual conference is a crucial event where central bankers from around the globe discuss pressing economic issues and signal future policy directions. Speeches from key figures, particularly the Federal Reserve Chair, are scrutinized by global markets for clues about the future of monetary policy.
The anticipation surrounding the event highlights its high stakes for risk assets. Market participants will be listening for any hint of a dovish pivot (a signal that rate cuts are back on the table) or a hawkish stance (a reinforcement of the "higher for longer" narrative).
• A dovish signal could be the catalyst that reignites Bitcoin's rally by weakening the dollar and sending risk assets soaring.
• A hawkish signal, on the other hand, could reinforce the current headwinds, potentially leading to a deeper correction for Bitcoin.
The Great Wall of $112K: Why All-Time Highs Are Hard to Break
Every seasoned market participant knows that previous all-time highs (ATHs) are not just numbers on a chart; they are formidable psychological barriers. For Bitcoin, the level around $112,000 represents this wall. Breaking through it requires immense momentum, and the current struggle to do so is explained by a critical missing ingredient: widespread, retail-driven Fear of Missing Out (FOMO).
The Psychology of an All-Time High
An ATH represents a point of maximum financial opportunity and maximum regret. This creates a powerful and complex dynamic:
1. Profit-Taking: Long-term holders and traders who bought at lower prices see the ATH as a prime opportunity to realize their gains.
2. Break-Even Selling: Investors who bought at or near the previous peak may be eager to sell as soon as their position returns to break-even.
3. Hesitation from New Buyers: For new investors, buying at an all-time high feels inherently risky, leading to hesitation.
Overcoming this selling pressure requires a massive wave of new demand, a force often fueled by pure, unadulterated FOMO.
The Absence of FOMO-Driven Greed
FOMO, or the "Fear of Missing Out," is the force that turns a rally into a parabolic ascent, characterized by a surge in retail interest and media saturation. Analysts suggest that a key reason Bitcoin can’t break the $112K all-time high is the absence of new buyers and FOMO-driven greed. While there have been spikes in retail enthusiasm, the kind of euphoric mania seen at the peak of previous cycles has yet to fully materialize in 2025. Without that surge of irrational exuberance, there may not be enough buying pressure to absorb the natural selling that occurs at an all-time high, creating a stalemate.
The Paradigm Shift: How Institutional ETFs Changed the Game
While the lack of retail FOMO explains the resistance at the all-time high, the very reason Bitcoin reached this level so quickly is due to a fundamental, game-changing development: the approval and launch of spot Bitcoin Exchange-Traded Funds (ETFs) in the United States. This event represents a true "paradigm shift" in market structure, providing a powerful counterbalance to the whims of retail sentiment.
A spot Bitcoin ETF directly holds Bitcoin and allows investors to gain exposure through traditional brokerage accounts, dramatically simplifying the investment process. This has had a revolutionary impact:
1. Accessibility and Legitimacy: ETFs have democratized access to Bitcoin for a massive new audience and conferred a new level of legitimacy on the asset class.
2. Unlocking Institutional Capital: Most importantly, ETFs created a regulated pathway for institutional investors to allocate capital to Bitcoin.
The impact has been staggering, with massive ETF inflows directly fueling Bitcoin's price appreciation. In a recent two-month period, for instance, U.S.-based spot Bitcoin ETFs recorded nearly $10 billion in inflows. This is not the fickle demand of a retail FOMO cycle; it is the steady, calculated allocation of capital from major financial players, providing a strong floor for the price.
Gazing into the Crystal Ball: Near and Long-Term Price Horizons
With these conflicting forces shaping the market, analysts are looking at both short-term technical targets and long-term fundamental models to chart a potential path forward.
Short-Term Targets: The Path to $117,000
The immediate upper bound for Bitcoin is pegged by many analysts at $117,000, with some suggesting a move to $116K in July is possible. This target is derived from a combination of technical analysis, historical seasonal trends, and the potential for a short squeeze. A decisive break above the $112,000 all-time high would clear the path for a rapid move toward this level.
The Long-Term Vision: A $200,000 Call
Looking further ahead, some of the most bullish predictions from institutional players call for Bitcoin to hit $200,000 by the end of 2025. This forecast is not based on short-term chart patterns but on a fundamental assessment of supply and demand in this new era. The reasoning is that there is simply too much institutional demand to keep prices flat for long, a trend driven by the continued success of spot Bitcoin ETFs and growing regulatory clarity.
Interestingly, this bullish institutional sentiment for Bitcoin is not always extended to other major cryptocurrencies. Some outlooks are less confident that assets like Ethereum (ETH) and Solana (SOL) will hit new all-time highs this year. Challenges such as network reliability issues and the lack of similar institutional products are cited as reasons for a more tempered outlook on these other assets. This suggests a potential future where Bitcoin's performance decouples from the broader altcoin market, driven primarily by its unique status as an institutional-grade digital asset.
Conclusion: The Great Tension and the Path Forward
Bitcoin's current market position is one of profound tension. In the world of its own blockchain and market structure, the signals are bullish. A new era of institutional demand, evidenced by billions flowing into spot ETFs, has created a paradigm shift. This is reinforced by a derivatives market primed for a potential short squeeze.
However, Bitcoin does not exist in a vacuum. It is also a participant in the broader financial ecosystem, where a hawkish Federal Reserve has put a damper on risk-on sentiment. This macroeconomic resistance is amplified by the psychological barrier of the all-time high, where natural profit-taking meets the absence of the retail-driven FOMO that defined past cycles.
The resolution of this conflict will define the next chapter for Bitcoin. A catalyst could come from the Jackson Hole Symposium, a sudden acceleration in ETF inflows, or a shift in the macroeconomic landscape. What is certain is that Bitcoin is no longer just a retail phenomenon; it is a maturing asset on the global stage, navigating a complex interplay of internal strength and external pressures. Whether it reaches $117,000 in the coming months or faces a setback, its journey will be a masterclass in the collision of technology, finance, and human psychology.
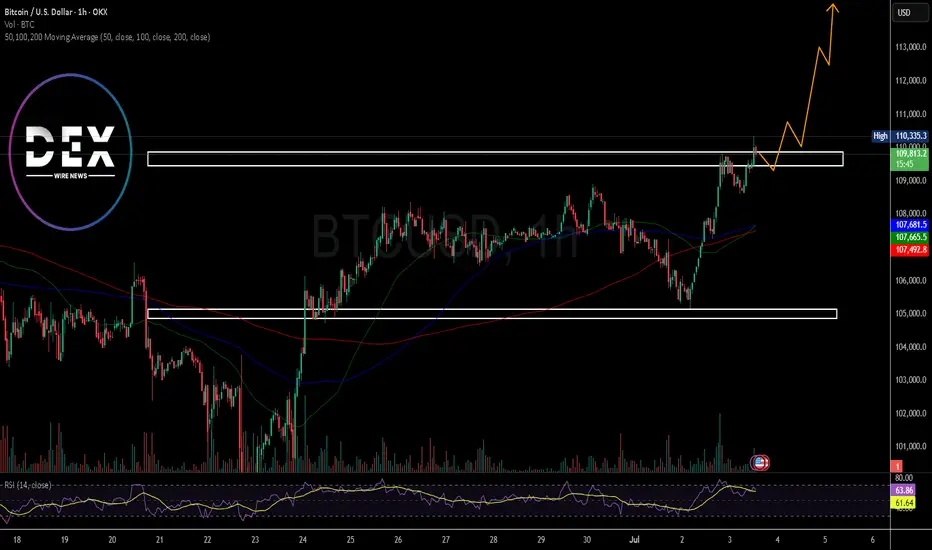
Breaking: Bitcoin Just Broke the $110k Resistant Next Top $115kThe price of the first crypto currency ever created saw a noteworthy uptick to reclaim the $110k price point however, the move was short-lived as the asset retraced to $109k mark but present price chart depicts a move to the $115k resistant point in the short term.
With the Relative strength index (RSI) at 63, Bitcoin might be inches away from claiming the $115k pivot amidst build up momentum and institutional adoption. further bullish metrics include the asset trading above the 50, 100 and 200-day Moving Averages (MA) respectfully.
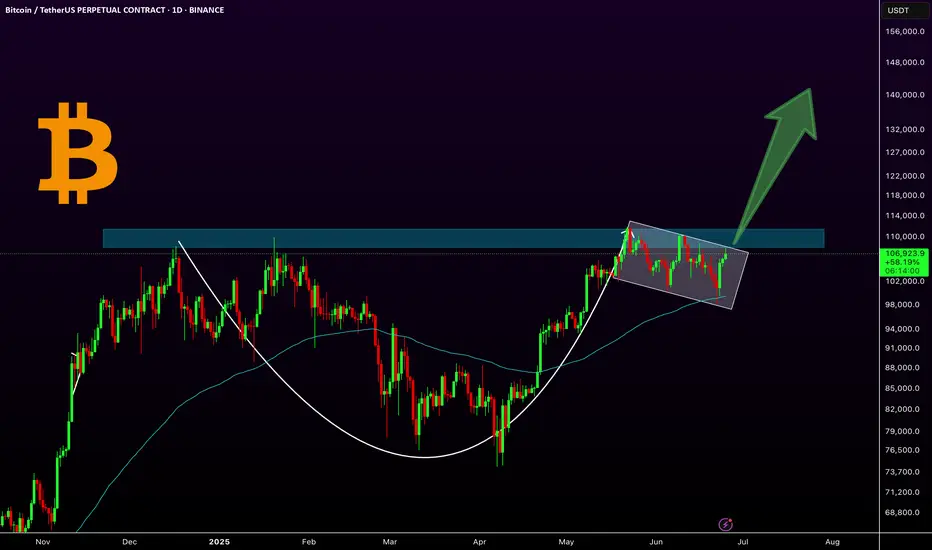
BTC: A Classic Cup & Handle in Play!Bitcoin has formed a classic cup and handle pattern on the daily chart, with the 100 EMA providing solid support during the handle formation. Currently, the price is consolidating in what appears to be a bullish flag or extended handle, just below the key resistance zone around $109K. A breakout above this level could ignite a strong bullish rally toward higher targets like $144k.
Key Highlights:
-Cup & Handle pattern confirmed
-10 EMA acting as dynamic support
-Bullish flag/handle forming near resistance
- A breakout could lead to explosive upside
Regards
Hexa
CRYPTOCAP:BTC BITSTAMP:BTCUSD
$BTC Breakout $108k soonCRYPTOCAP:BTC is showing strength after bouncing from the $105K support zone.
It’s now trying to break above $108.5K.
If that happens, the next target could be around $111K–$112K.
The trend looks positive with growing momentum, but if BTC drops below $105K, this move could fail.
For now, bulls are in control.
Let’s see if they can keep it going.
DYRO, NFA

BTC: Price to 134,500$ , FVG, Fib 0.5 and 0.618 ratio ?Price to 134,500$:
Bitcoin is now moving in a triangle pattern, which is getting smaller. The price is around $107,758. Here is possible move is a breakout to the downside first, where the price may drop to fill the "Fair Value Gap" area, which is marked in purple. This area is between the Fibonacci levels of 0.5 and 0.618. After that, Bitcoin could go up again and reach the price of $134,000.
Trade Ideas:
I marked 2 areas with arrow let the price reach here and wait for confirmation in both areas. Specially in Fair Value Gap area.
Trade Signal:
I will provide both trade signal here so follow my account and you can check my previous analysis regarding BITCOIN. So don't miss trade opportunity so follow must.
BINANCE:BTCUSDT BITSTAMP:BTCUSD COINBASE:BTCUSD COINBASE:BTCUSD BINANCE:BTCUSDT.P CRYPTO:BTCUSD BYBIT:BTCUSDT.P BINANCE:BTCUSD

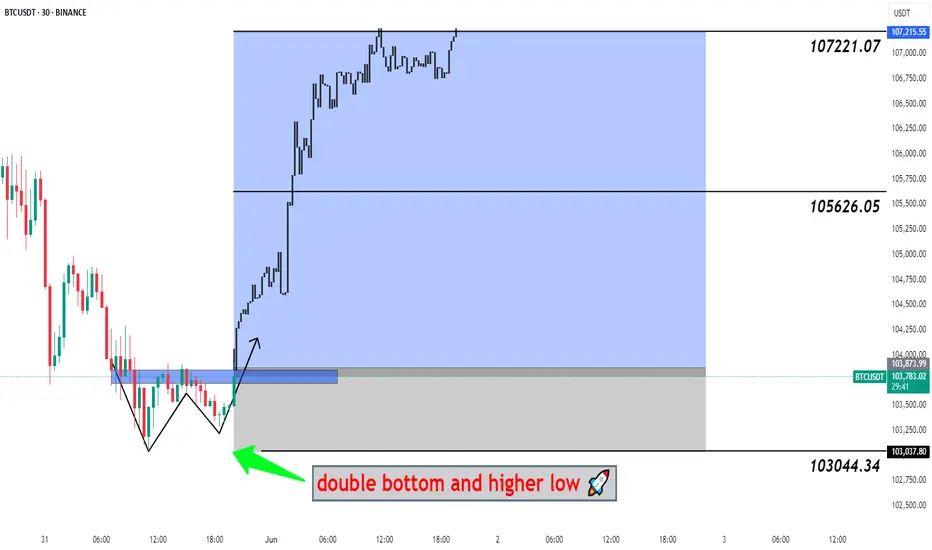
#BTCUSDT Big Pump Next Hour - Bitcoin, BTCUSD, BTCUSDT 📉 Double Bottom Pattern Forming – Potential Reversal Setup
The current price structure is showing signs of a Double Bottom – a classic bullish reversal pattern. After an extended downtrend, this pattern suggests that the market may be preparing for a trend reversal from this key demand zone.
🔹 Trade Setup
Entry, Targets, and Stop Loss (SL) are marked on the chart.
Entry: Upon breakout confirmation above the neckline.
Stop Loss: Just below the recent swing low to manage downside risk.
Targets: Calculated using the measured move method from the bottom to the neckline .
🔹 Risk & Money Management (Professional Approach)
To maintain consistent profitability and protect capital, strict risk management is essential. For this setup:
🔸 Position Sizing: Based on a fixed % of total capital (typically 1–2% of account equity per trade).
🔸 Risk-to-Reward Ratio: Minimum of 1:2, ideally higher.
🔸 Stop Loss Discipline: No arbitrary changes after entry. SL only adjusted for breakeven or trailing stops once price moves favorably.
🔸 Trade Management: Secure partial profits at key levels, trail stops as structure forms.
🔸 Capital Allocation: Avoid overexposure. Trade fits within overall portfolio strategy.
💬 Let the setup come to you. React, don’t predict.
🔁 Like, comment, or share your thoughts below!
BINANCE:BTCUSDT BITSTAMP:BTCUSD COINBASE:BTCUSD BINANCE:BTCUSDT.P INDEX:BTCUSD CRYPTOCAP:BTC.D CRYPTO:BTCUSD BYBIT:BTCUSDT.P BINANCE:BTCUSD
BTC - High Probability Trade Idea Here we have a major resistance at this upper level. And market seems to create a "Double Top Patter". So its indicating a possible bearish move.
Target and Sl on chart. Follow risk and money management.
BINANCE:BTCUSDT BITSTAMP:BTCUSD BINANCE:BTCUSDT.P INDEX:BTCUSD BYBIT:BTCUSDT.P BINANCE:BTCUSD

Bitcoin May Break Higher if $108K Clears📊 Market:
BTC trades around $106,860, driven by strong ETF inflows and weaker USD ahead of Fed rate decisions.
📉 Technical:
• Resistance: $107,400–108,000 → breakout may target $110,000+
• Support: $106,500–106,800 → next at $105,500
• EMA: Price above EMA9 → short-term uptrend
• Momentum: RSI > 80, Stoch high → upside potential but overbought
📌 Outlook:
BTC could rise if $108K breaks. If not, expect a pullback to $106,800.
💡 Trade Setup:
🔺 BUY BTC/USD: $107,000–107,200
🎯 TP: 1000–2000 pts
❌ SL: $106,500
🔻 SELL BTC/USD: $108,000–108,200
🎯 TP: $106,800–107,000
❌ SL: $108,500
