Major Coins and Crypto Stocks Pump — Thank Landmark GENIUS BillBitcoin BITSTAMP:BTCUSD making ATHs? Old news. But Coinbase NASDAQ:COIN and Robinhood NASDAQ:HOOD hitting those record-high notes? And XRP BITSTAMP:XRPUSD dangerously close to eclipsing its own peak, while Ethereum keeps chugging along toward $4,000? Now we’re talking.
In a market-friendl
Key facts today
Key stats
About Bitcoin
Bitcoin is the world’s most traded cryptocurrency, and represents the largest piece of the crypto market pie. It was the first digital coin and as such, remains the most famous and widely-adopted cryptocurrency in the world. It's the original gangster in whose footsteps all other coins follow. The birth of Bitcoin was the genesis of an entirely new asset class, and a huge step away from traditional, centrally controlled money. Today, many advocates believe Bitcoin will facilitate the next stage for the global financial system, although this — of course — remains to be seen.
Related coins

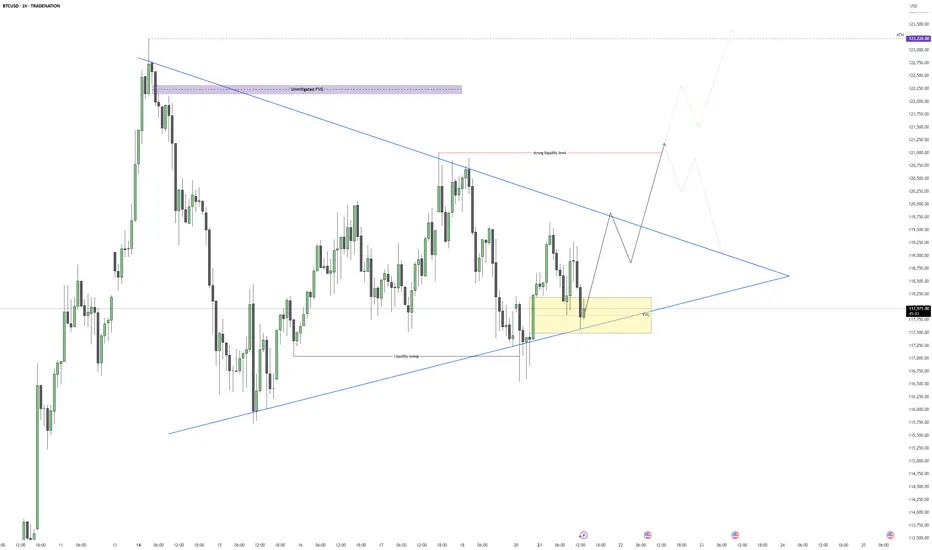
Bitcoin – Breakout Coming, But May Be a TrapBitcoin is trading within a well-defined bullish pennant structure on the 1H chart, with clear compression between a rising support and descending resistance. This pattern typically signals a continuation of the prior trend, but given the surrounding liquidity and recent FVG formation, the setup loo
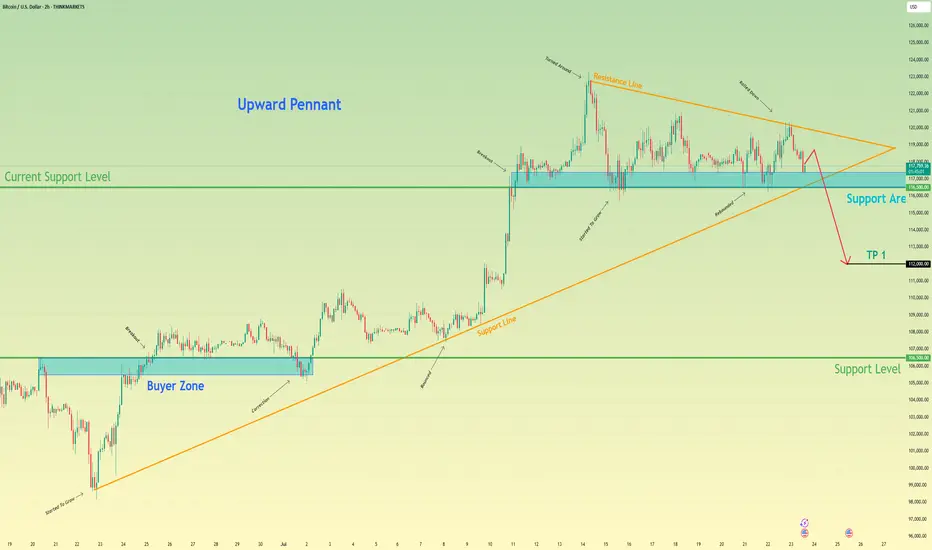
Bitcoin can start to decline and break support levelHello traders, I want share with you my opinion about Bitcoin. After completing a powerful upward impulse that originated from the buyer zone near 106500, the price action for BTC has transitioned into a corrective market phase. This consolidation has taken the form of an upward pennant, characteris
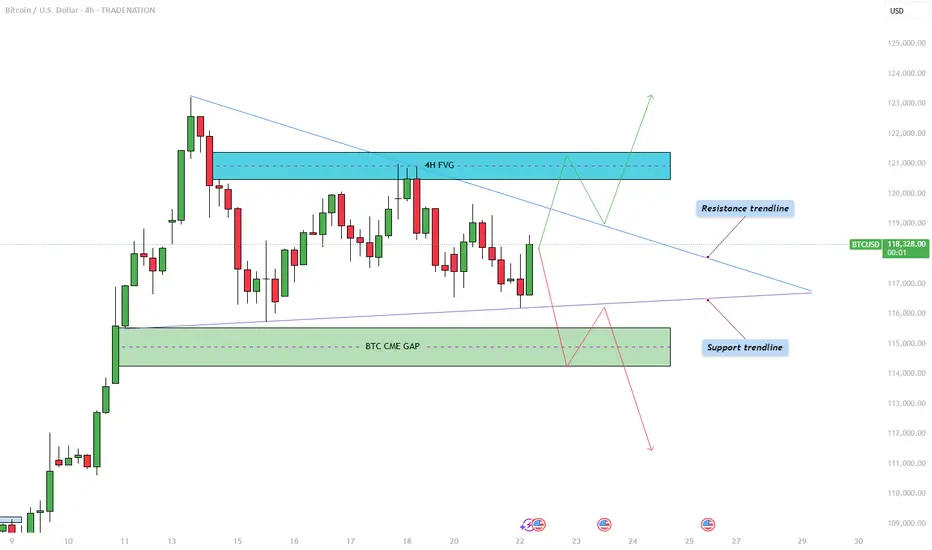
Bitcoin - Triangle pattern consolidation!The Bitcoin price action is currently coiling within a symmetrical triangle pattern on the 4-hour chart, as illustrated in the chart provided. After a significant bullish move earlier this month, BTC has now entered a phase of consolidation, marked by a series of lower highs and higher lows. This ha
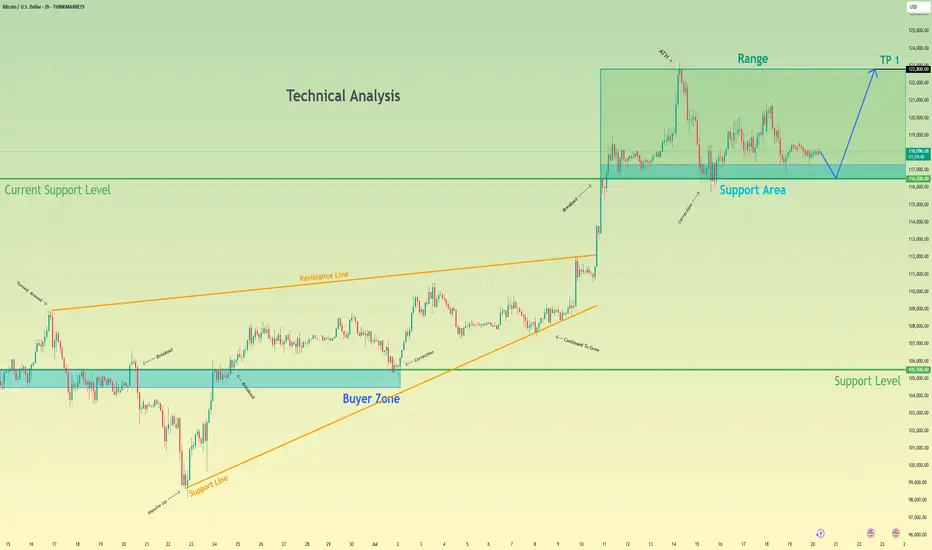
Bitcoin may bounce up from support area to 122800 pointsHello traders, I want share with you my opinion about Bitcoin. Analyzing the broader market context on the BTC chart, the past price action has carved out two significant technical structures: a wide trading range and a larger upward wedge pattern. The formation of this wedge indicates a generally p
Bitcoin: 130K AREA Upon Triangle Break Out.Bitcoin consolidating in a sub wave 4 and poised to break out (see triangle formation on chart). This breakout would be the sub wave 5 which can take price as high as the 133K to 134K area. In my opinion, this can be the completion of the broadest impulse wave (5th of the 5th). Wave counts aside, th

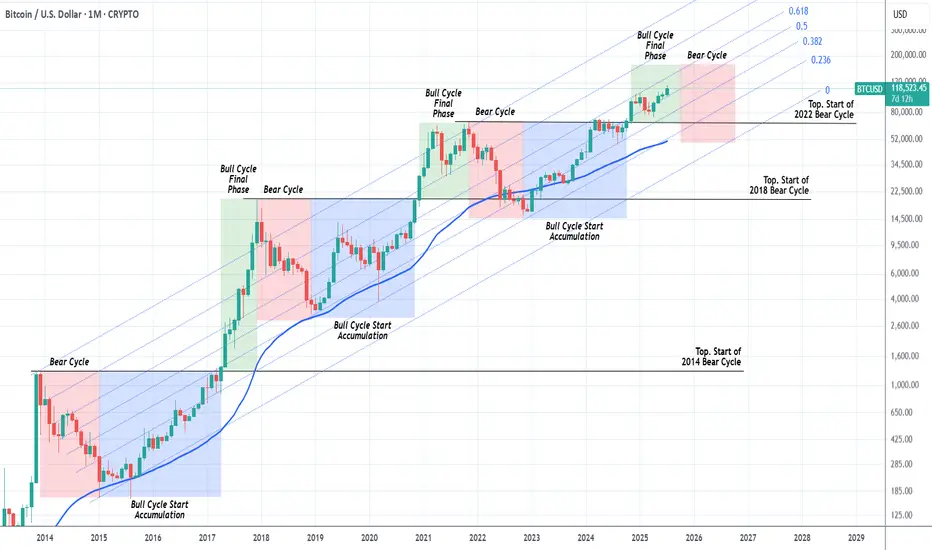
BITCOIN Should we start thinking about the next Bear Cycle yet?Bitcoin (BTCUSD) has had extremely symmetric (time-wise) Cycles in the past +10 years and this is a subject we've analyzed extensively many times. We've spent the last months projecting potential Targets for each stage of the bull run and only the last few are left.
This is exactly why we thought t
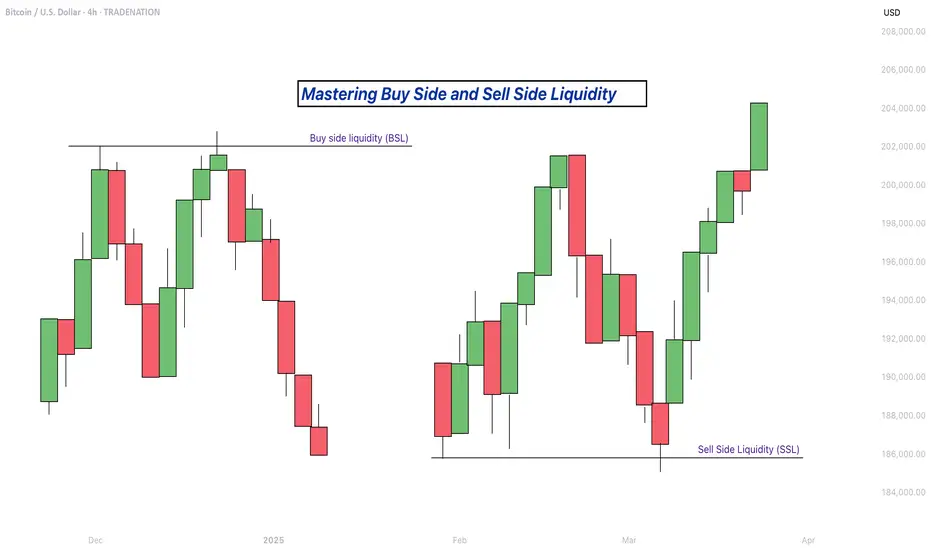
Mastering Buy Side and Sell Side Liquidity - How to trade it!In trading, understanding liquidity is one of the keys to predicting where the market might go next. The Inner Circle Trader (ICT) method teaches traders how to recognize where big players like banks and institutions are likely to enter or exit trades. Two important ideas in ICT trading are buy side
BITCOIN Entering Cyclical Profit Zone. Risk should be limited.Bitcoin (BTCUSD) has just entered the first level of the Logarithmic Growth Curve (LGC) Resistance Zone, which is the light pink band. The Top of the previous Cycle was priced at the top of the band just above this.
In fact every BTC Cycle had this as the 'Profit taking Zone'. The market marginally

BITCOIN - Price can bounce up from support line to $125000Hi guys, this is my overview for BTCUSD, feel free to check it and write your feedback in comments👊
For a long time, the price was trading sideways inside a wide flat range between the $99000 support area and the $112000 resistance level.
After accumulating volume, bitcoin made a strong upward imp

See all ideas
Summarizing what the indicators are suggesting.
Oscillators
Neutral
SellBuy
Strong sellStrong buy
Strong sellSellNeutralBuyStrong buy
Oscillators
Neutral
SellBuy
Strong sellStrong buy
Strong sellSellNeutralBuyStrong buy
Summary
Neutral
SellBuy
Strong sellStrong buy
Strong sellSellNeutralBuyStrong buy
Summary
Neutral
SellBuy
Strong sellStrong buy
Strong sellSellNeutralBuyStrong buy
Summary
Neutral
SellBuy
Strong sellStrong buy
Strong sellSellNeutralBuyStrong buy
Moving Averages
Neutral
SellBuy
Strong sellStrong buy
Strong sellSellNeutralBuyStrong buy
Moving Averages
Neutral
SellBuy
Strong sellStrong buy
Strong sellSellNeutralBuyStrong buy
Displays a symbol's price movements over previous years to identify recurring trends.
Curated watchlists where BTCUSD is featured.

Gen 1 crypto: from little acorns grow
15 No. of Symbols

Proof of Work: Embracing the crunch
27 No. of Symbols
See all sparks
Discover funds exposed to Bitcoin and find another way to access the coin.
Frequently Asked Questions
The current price of Bitcoin (BTC) is 117,990 USD — it has risen 0.08% in the past 24 hours. Try placing this info into the context by checking out what coins are also gaining and losing at the moment and seeing BTC price chart.
The current market capitalization of Bitcoin (BTC) is 2.35 T USD. To see this number in a context check out our list of crypto coins ranked by their market caps or see crypto market cap charts.
Bitcoin (BTC) trading volume in 24 hours is 99.12 B USD. See how often other coins are traded in this list.
Bitcoin price has fallen by −0.23% over the last week, its month performance shows a 9.62% increase, and as for the last year, Bitcoin has increased by 79.33%. See more dynamics on BTC price chart.
Keep track of coins' changes with our Crypto Coins Heatmap.
Keep track of coins' changes with our Crypto Coins Heatmap.
Bitcoin (BTC) reached its highest price on Jul 14, 2025 — it amounted to 123,236 USD. Find more insights on the BTC price chart.
See the list of crypto gainers and choose what best fits your strategy.
See the list of crypto gainers and choose what best fits your strategy.
Bitcoin (BTC) reached the lowest price of 2 USD on Oct 20, 2011. View more Bitcoin dynamics on the price chart.
See the list of crypto losers to find unexpected opportunities.
See the list of crypto losers to find unexpected opportunities.
The current circulating supply of Bitcoin (BTC) is 19.90 M USD. To get a wider picture you can check out our list of coins with the highest circulating supply, as well as the ones with the lowest number of tokens in circulation.
Bitcoin has the limit of 21.00 M coins. No matter how the currency evolves, no new coins will be released after this number is reached.
The safest choice when buying BTC is to go to a well-known crypto exchange. Some of the popular names are Binance, Coinbase, Kraken. But you'll have to find a reliable broker and create an account first. You can trade BTC right from TradingView charts — just choose a broker and connect to your account.
Crypto markets are famous for their volatility, so one should study all the available stats before adding crypto assets to their portfolio. Very often it's technical analysis that comes in handy. We prepared technical ratings for Bitcoin (BTC): today its technical analysis shows the buy signal, and according to the 1 week rating BTC shows the buy signal. And you'd better dig deeper and study 1 month rating too — it's strong buy. Find inspiration in Bitcoin trading ideas and keep track of what's moving crypto markets with our crypto news feed.
Bitcoin (BTC) is just as reliable as any other crypto asset — this corner of the world market is highly volatile. Today, for instance, Bitcoin is estimated as 0.92% volatile. The only thing it means is that you must prepare and examine all available information before making a decision. And if you're not sure about Bitcoin, you can find more inspiration in our curated watchlists.
You can discuss Bitcoin (BTC) with other users in our public chats, Minds or in the comments to Ideas.