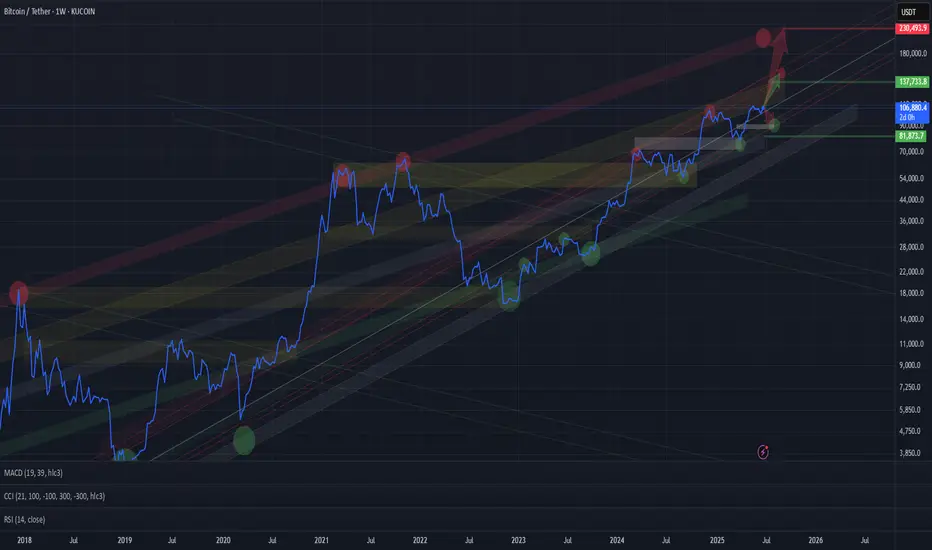
BTC BTC/USDT LONG_TERMChannels are drawn, long-term targets are clear. The upper extreme visible so far is around $200K for Bitcoin — possible within this cycle.
More realistic targets for this cycle are around $135K.
In the short term, a correction to the lower red channel zone ($88K–94K) is possible.
Watching closely.
BTCUSD1W
BTC BOTTOM $ - 100% Never Fails (2013 - Today)Bitcoin Weekly Chart Going Back To 10+ Years
We are looking at the BitStamp Green Support Line here that has Marked the bottom correctly before 100% of the time for each each bull cycle pump on bitcoin going 3/3 without fail.
We are now looking to see if we can go 4/4 and mark the new bottom buy with a quick wick down to the green support currently around 73K+ this week, but as each week closes the bitcoin bottom number will rise as the green support line rises over time.
Good luck. Let's see if the 4th time is also the charm.

#BTC/USDT Ready to launch upwards#BTC
The price is moving in a descending channel on the 1-hour frame and is adhering to it well and is heading to break it strongly upwards
We have a bounce from the lower limit of the descending channel, this support is at a price of 98500
We have a downtrend on the RSI indicator that is about to be broken, which supports the rise
We have a trend to stabilize above the moving average 100
Entry price 102500
First target 104300
Second targe 107500
Third target 110080

BTC Before Halving 2024My Thoughts for BTC before BTC's Halving 2024.
It is just an idea and not a financial idea.

#BTC/USDT#BTC
The price is moving in a descending channel on the 4-hour frame upwards and is expected to continue
We have a trend to stabilize above the moving average 100 again
We have a descending trend on the RSI indicator that supports the rise by breaking it upwards
We have a support area at the lower limit of the channel at a price of 66000
Entry price 66600
First target 58056
Second target 69169
Third target 70000

BTCUSDPair : BTCUSD ( Bitcoin / U.S Dollar )
Description :
Completed " 12345 " Impulsive Waves
Break of Structure
RSI - Divergence
Bullish Channel as an Corrective Pattern in Short Time Frame
Demand Zone

BTCUSDPair : BTCUSD ( Bitcoin / U.S Dollar )
Description :
Completed " 12345 " Impulsive Waves
Break of Structure
RSI - Divergence
Rising Wedge as an Corrective Pattern in Short Time Frame and Breakout of Lower Trend Line
Demand Zone

BTC potential bounce areaBTC / USDT
BTC in downtrend since last visit @ 72k
Where we can see next strong bounce ?
Personally i think the Area around 52k (54k to 50k) can lead to possible bounce
But why ? …:
This area has much supports cluster
This area has big liquidity
Around 52k is the moving average 50 on weekly chart (was the Dynamic support for this bullrun since 2023!)
Keep watching price action there…
Important condition: wicks below moving average are acceptable but not closing below it
Best of wishes

BITCOIN Comprehensive Technical AnalysisHello everyone.
First of all I should say happy new year (Nowrooz) to all iranian people around
the world specially iranian traders community.
Im going to explain how will BTC behave in coming months according to
Elliot wave principles.
As you know wave analysis act better in higher timeframes like Weekly.
So I want to take a look at BTC price action from Nov 2022 that new Elliot Motive wave starts.
You can see the end of wave 3 of a 5 wave move in picture below:
so we are now in the end of a wave 3 in 161.8% fibonacci projection level from the end of wave 2.
furthermore we will have price correction as wave 4.
this wave 4 can be end in 57000 level that is a strong support level and most Fibo retracement levels compress here.
there are a lot of reasons that we will have a bullrun in coming months :
The most important one is Bitcoin Halving and the second one is inflows from approved ETFs
and last one is expected Federal rate cuts.
In chart below you see the overlay levels of Fibo that price will target soon.
Overall in my opinion after a correction to 57000 level as wave 4 , price will go forward to 3 targets ahead as wave 5 (100% level of wave 1) : 85000 , 100000 and 115000.
the most probable target level is 115000 (100% Fibo projection of wave 1)
after that price will correct till the range of wave 4 means 57000 again.
this level (I mean 57000 to 60000) will convert to a strong support level after the price correction.
Hope you like this opinion.
you should make decision on your own opinion but I will be happy if you share your views in comments with me.
Thank you for reading this analysis.
Have good trades

BTC UpdateAfter we got a huge bullish wave 3 I am expecting to get a wave 4 and it should be bearish strong wave ( 4) then will lastly get wave 5 before we get C all the way down
Note : it is not a financial advice

BTCUSDT Short trading ideaOKX:BTCUSDT.P
Short trading idea
=
Head and shoulders
+
Rising wedge
+
Fibonacci retracement 0.618
+
Fibonacci retracement 0.786
+
Retest level 30000
=
Enter 61175
=
Exit 53921 + 47241 + 31047
I am interested in your opinion on this algorithm of actions
deposit 20% of the asset
order 20% of deposit
shoulder ×20
cross margin
take profit 25+-% of the order
stop loss 5+-% of the order
day loss 1% of deposit
RR 1 to 5
Short position
Enter against a negative news background
+
When trendsetters are in a negative mood
+
No upcoming reports, speeches
+
Bearish chart and candlestick patterns
+
A pool of indicators signals a downtrend
#DYOR

Every Fair Value Gap & Volume Gap For Bitcoin {10/02/2024}Educational Analysis says BITCOIN BTCUSD may move in this range for some time according to my technical.
Broker - Coinbase
This is not an entry signal. I have no concerns with your profit and loss from this analysis.
Why this range?
Because I think It's going to be short selling for Bitcoin this year or up to the end of this year, There is a lot of liquidity as fvg & volume gaps to the downside.
Bitcoin Institutional traders have built a lot of liquidity when the price was very low, I think it's time to collect it and after that go for an all-time high.
Let's see what this pair brings to the table in the future for us.
Please check the Comment section on how it turned out for this trade.
I HAVE NO CONCERNS WITH YOUR PROFIT OR LOSS,
Happy Trading, Fx Dollars.

Free fall or patienceBitcoin has reached its weekly resistance, on the other hand, it is in a static resistance, and there is also a negative divergence in this currency.
Caution is the best option. If you enter a capital management position, don't forget the important support and resistance ranges.
Follow us and make us happy

$BTC Lost $40k Support Level Today, Key Price Targets To MonitorCRYPTOCAP:BTC has traded sideways within a range with resistance at the white resistance zone (around $44k) and support in the green support zone around $40k. CRYPTOCAP:BTC has lost support at $40k and is at risk of a steep drop. Altcoins will get wrecked here too.
Price levels on the way down:
- The white trendline at $37.5k is the next key support level of interest.
- The orange support zone at $33.6k and $34.9k is my key support zone of interest.

BtcUsd WeeklyWe all saw what happened in the weekly time frame of Bitcoin. Well, this upswing that is happening is slow and from Ichimoku's point of view, a strong upswing has not been formed
So I expect it to move along the red path drawn based on the higher probabilities I guess
and experience another terrible descent

Bitcoin (BTC) Short SetupOKX:BTCUSDT.P Short 1W
Rising wedge
+
Entrance 31745
=
Exit 18475
I am interested in your opinion on this algorithm of actions
deposit 20% of asset
order 20% of deposit
leverage ×20
cross margin
take profit 25+-% of order
stop loss 5+-% of order
day loss 1% of deposit
RR 1 to 5
Entry on negative news background
+
At negative mood of trendsetters
+
No nearby reports, speeches
+
Bearish chart and candlestick patterns
+
A pool of indicators signalling a downtrend
#DYOR

BTC ready for another jump but …BTC / USDT
After recent huge growth in BTC prices
We can see upsloping flag pattern in small time frames and price just brokekout from it which is very bullish to make another jump
But here is an important condition:
The key level 36k-35.7k must hold
If 4 candle closed below it we might see corrections towards 35-34-33k first before another rise
If you see my ideas help you in your tradings please like follow for more .. iam also free for your opinions and questions to share with me in comments section

Unpublished Idea of Bitcoin Price Prediction {09/Nov/2023}Some trade ideas if I am not sure will go Unpublished and it will be left out alone for a long time.
The next idea coming soon of price prediction on bitcoin.
Thank you for your support.
Happy Trading,
Fx Dollars.

BTC overview and ask for your altcoins BTC / USDT
BTC succeeds to breakout the resistance of 32k (monthly resistance) yesterday first time since may 2022! We can see also a successful breakout retest
what does that mean ?
– The 30k to 32k level should act now as support /buy area until broken for the next pump toward 40k region !
– NOTE :
The price has filled the CME GAP at 35k
There is another major CME gap around 21k and in order to fill this one we need a big big FUD ,but for now we cant talk about this scenario as long as we closing weekly above 30k
Summary:
My current bias now is bullish as long as we close weekly above 30k
Don’t forget to show your support by like(rocket) and comment⬇️
Also you can ask for only 1 altcoins analysis and i will try to do my best to cover as much as i can

BTC 1W Next stop for bullsOn weekly BTC flipped the major resistance at 31k. Next potential target for bulls is around 41.5k approx. Since price is pumping momentum is on the bulls side.

The Four Reasons I'm Long On BitcoinOn the weekly timeframe for CRYPTOCAP:BTC :
- A candle closed above the downwards trendline (Forming a bull flag), indicating strength in buyers
- The MACD indicator had a crossover on the weekly timeframe
- Price has been respecting the 21 EMA in the last few weeks. All of my favorite setups include EMAs!
- There seems to be a potential Cup and Handle pattern forming.
- And obviously ... The news about an ETF for CRYPTOCAP:BTC seems very bullish and I can see this continuation!
Given these four reasons, I am bullish on CRYPTOCAP:BTC
Stop Loss / Take Profits
Stop loss: My stop loss on this trade is pretty tight. I put it at a break of low of this week. However, I might wait for a close on the low!
Take Profits:
All of these take profits are set at levels that were areas where there was previous heavy selling pressure.
My plan would be to scale out half of my position at TP1, 1/2 of the remaining position at TP2, and fully out at TP3
Let me know what you think of this trade!

BTC bullish vs bearish scenariosBTC / USDT
After rumors of SEC approved Bitcoin ETF yesterday, price pumped hard and then most of the pump is absorbed …
right now BTC at very decisive area :
1- The Bullish scenario:
Since 2021 the key level (31-32k)is a very strong level, a breakout and stability above is a bull signal and will confirm double bottom pattern
2- The Bearish scenario:
completing the head and shoulders pattern and dropping below 25k will lead to further correction “if happened I believe it will be the last correction”
What is the most likely scenario for you and why ?
All questions and opinions are welcomed
Share with me below ⬇️

BTC USDTMy analysis of Bitcoin in the weekly time form, considering the inverse head and shoulders that it has hit, has the possibility of growth before the end of 2023 within the specified limits.
