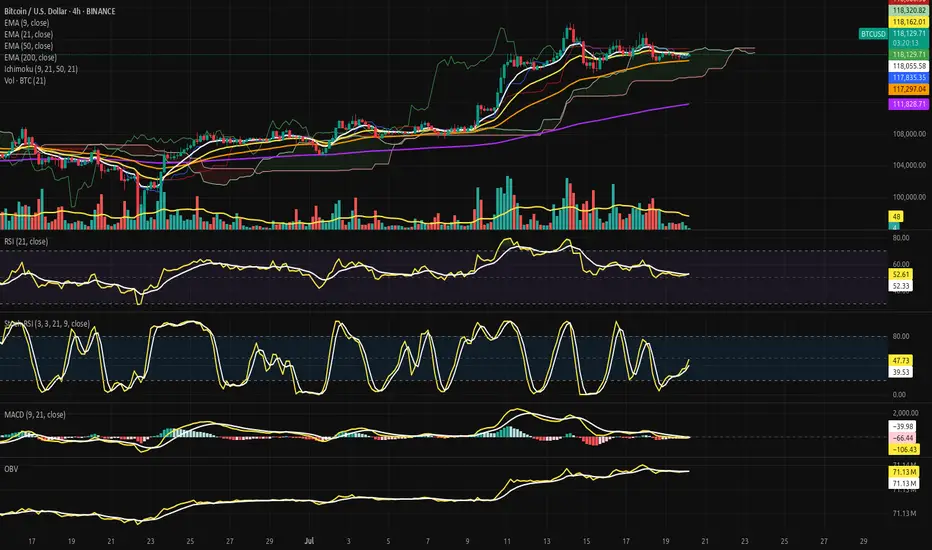
Bitcoin Suspended Beneath the Ichimoku Silence.⊢
⨀ BTC/USD - BINANCE - (CHART: 4H) - (July 20, 2025).
◇ Analysis Price: $117,919.29.
⊣
⨀ I. Temporal Axis - Strategic Interval - (4H):
▦ EMA9 - (Exponential Moving Average - 9 Close):
∴ Price is currently hovering just below the EMA9 at $118,035.43, showing weakening immediate momentum;
∴ EMA9 is now flat-to-downsloping, indicating short-term loss of control from intraday bulls;
∴ Recent candles have failed to reclaim closes above EMA9, reflecting micro-resistance and tactical fragility.
✴️ Conclusion: Logic sealed - EMA9 has lost command; tactical control has shifted to neutrality with bear undertones.
⊢
▦ EMA21 - (Exponential Moving Average - 21 Close):
∴ EMA21 currently sits at $118,164.50, acting as an overhead suppressor;
∴ The gap between EMA9 and EMA21 is compressing, signaling potential for either crossover or volatility breakout;
∴ Price action is now trapped between EMA9 and EMA50, with EMA21 forming the upper barrier of a tactical box.
✴️ Conclusion: Logic sealed - EMA21 serves as containment lid; rejection here confirms tactical indecision.
⊢
▦ EMA50 - (Exponential Moving Average - 50 Close):
∴ EMA50 rests at $117,262.74, offering foundational support within the current structure;
∴ Price has respected this level on multiple dips since mid-July, confirming its strategic function as mid-term equilibrium;
∴ The slope remains mildly upward - no sign of reversal, only compression beneath.
✴️ Conclusion: Logic sealed - EMA50 maintains its structural role as mid-range dynamic floor.
⊢
▦ EMA200 - (Exponential Moving Average - 200 Close):
∴ EMA200 remains well below at $111,765.30, untouched since early July;
∴ Its wide distance from price confirms that the broader structure remains in bullish territory;
∴ Its trajectory continues upward, anchoring the uptrend beneath all volatility.
✴️ Conclusion: Logic sealed - EMA200 secures the long-term structure; market remains elevated far above reversal threshold.
⊢
▦ Ichimoku Cloud - (9, 21, 50, 21):
∴ Price is currently within the Kumo (cloud) zone, defined between SSA and SSB - a region of ambiguity and compression;
∴ The Senkou Span A and Span B are nearly flat, signaling lack of directional command in the near term;
∴ Kijun and Tenkan lines are converged, offering no trend bias - equilibrium is dominating.
✴️ Conclusion: Logic sealed - Ichimoku confirms a neutralized compression state; breakout required for trend clarity.
⊢
▦ RSI (21) + EMA9 - (Relative Strength Index with Signal Smoothing):
∴ RSI value stands at (51.48), while the EMA9-signal rests at (52.25) - confirming a soft bearish crossover;
∴ The RSI has declined from its recent peak and now oscillates around the neutral 50-line;
∴ Momentum is waning without structural damage, indicating tactical cooling.
✴️ Conclusion: Logic sealed - RSI confirms suspended momentum; structural neutrality prevails beneath fading thrust.
⊢
▦ Stochastic RSI - (3, 3, 21, 9):
∴ Current values are: (%K = 35.33), (%D = 32.68) - with %K slightly above %D, forming a mild bullish crossover;
∴ The oscillator has just risen from oversold levels, indicating potential energy buildup;
∴ Prior cycles in this zone have produced false starts, so confirmation is essential.
✴️ Conclusion: Logic sealed - Stoch RSI hints at rebounding energy, but with fragile structure and low reliability.
⊢
▦ MACD - (9, 21, 9 - EMA/EMA):
∴ MACD Line = (–105.52), Signal Line = (–129.07), Histogram = (+23.55) - confirming a bullish crossover;
∴ The crossover occurred below the zero line, indicating a possible reversal from weakness rather than strength;
∴ Slope of MACD is positive but modest - insufficient to declare dominant shift.
✴️ Conclusion: Logic sealed - MACD is in bullish transition mode, but still recovering from beneath structural base.
⊢
▦ OBV + EMA9 - (On-Balance Volume with Trend Overlay):
∴ OBV currently reads (71.13M), and is slightly above its EMA9, signaling retention of volume without strength;
∴ Volume has not left the system - but neither has it surged; this is passive accumulation at best;
∴ No divergence exists for now, but lack of buildup implies neutral positioning.
✴️ Conclusion: Logic sealed - OBV is stable and neutral; no buyer escape, but no commitment surge either.
⊢
▦ Volume + EMA21 – (Volume Profile with Trend Average):
∴ Current volume bar = (13.91), sitting below the EMA21 baseline;
∴ The volume profile across recent sessions is declining - suggesting consolidation or exhaustion;
∴ No breakout volume spike has accompanied price stabilization - trend is under silent compression.
✴️ Conclusion: Logic sealed - volume fails to validate price levels; tactical fragility remains unresolved.
⊢
🜎 Strategic Insight – Technical Oracle:
∴ The H4 structure presents a state of compression beneath a neutral cloud, suspended between tactical short-term EMA's (9, 21) and safeguarded by a rising EMA50 backbone;
∴ Momentum oscillators (RSI, Stoch RSI, MACD) converge toward reactivation, yet none have broken decisively above neutral thresholds - reflecting potential, not power;
∴ Volume participation is inconsistent and fading, offering no confirmation for breakout - the market is in silent observation mode, not assertion;
∴ Ichimoku confirms indecision: price floats within Kumo, without command or breakout - equilibrium reigns;
∴ Price positioning remains elevated above the deeper structure (EMA200), but its current zone between EMA9 and EMA50 represents a coil of indecision;
∴ The overall condition is not bearish - but it is tactically suspended, lacking conviction, awaiting external ignition.
✴️ Conclusion: The Oracle confirms - the structure is intact, but tactical initiative is lost; the field is poised, not marching.
⊢
∫ II. On-Chain Intelligence – (Source: CryptoQuant):
▦ Short-Term Holder (SOPR):
∴ SOPR currently reads (1.001), meaning short-term holders are spending coins with no significant profit or loss - a signal of economic neutrality;
∴ The chart displays persistent lateral volatility around the (1.0) threshold since early July - no emotional dominance in market behavior;
∴ This pattern historically coincides with pre-expansion compression phases, rather than breakdown events.
✴️ Conclusion: Logic sealed - SOPR confirms behavioral neutrality among short-term holders; the market remains in a state of expectation, not realization.
⊢
▦ STH-MVRV - (Short-Term Holder Market Value to Realized Value):
∴ The metric is currently oscillating around (1.30), well above the danger zone at (1.0), but far below the euphoria threshold at (1.8);
∴ The structure reflects multiple euphoria rejections, followed by a return to balance - a classic cooling-off pattern without structural failure;
∴ Convergence between market price, realized value, and short-term cost basis indicates the market is retesting foundation zones.
✴️ Conclusion: Logic sealed - STH-MVRV confirms post-euphoric cooling with structural support intact; no active trend, no breakdown.
⊢
▦ Exchange Inflow Spent Output Age Bands - (All Exchanges):
∴ Inflows to exchanges have been consistently low in recent weeks, particularly among young coins (0d–1d, 1d–1w) - showing no urgency to sell;
∴ Aged outputs (>6m) remain dormant - long-term holders are not mobilizing;
∴ The absence of inflow pressure signals no macro panic or exit event, reinforcing the diagnosis of tactical compression.
✴️ Conclusion: Logic sealed - muted inflows confirm a lack of distribution catalysts; stable structure sustains the technical silence on the 4H chart.
⊢
🜎 Strategic Insight - On-Chain Oracle:
∴ All three on-chain metrics converge into a clear state of tactical equilibrium - not bearish, not euphoric, but suspended between action and observation;
∴ Short-Term Holder SOPR stabilizes at (1.001), marking a precise psychological stasis - profit-taking and panic-selling are both absent;
∴ STH-MVRV confirms a post-euphoria cooldown with structural preservation, implying that short-term holders have recalibrated expectations without abandoning their positions;
∴ Exchange inflows remain historically depressed, with no aged coins activating - a hallmark of silent markets preparing for resolution;
∴ The chain speaks softly: no exit, no aggression, no irrationality - only latency, and the potential energy of stillness.
✴️ Conclusion: The Oracle confirms - the on-chain architecture reflects suspended initiative; nothing is broken, nothing is charged - only paused.
⊢
𓂀 Stoic-Structural Interpretation:
▦ Structurally: Bullish;
∴ Price remains well above the EMA200 and EMA50, with no breach of long-term support;
∴ All EMA's (9, 21, 50) are compressing, but retain upward trajectory - confirming structural integrity;
∴ Ichimoku Kumo holds price within a neutral band, but does not reflect a breakdown.
⊢
▦ Momentum-wise: Suspended Compression.
∴ MACD shows bullish crossover from beneath, but lacks amplitude to confirm trend reversal;
∴ RSI is parked around 50 with a bearish signal crossover - signaling stagnation, not strength;
∴ Stochastic RSI is climbing out of oversold, but with no impulsive follow-through.
⊢
✴️ Final Codex Interpretation:
∴ The H4 structure is consolidating beneath short-term resistance and within equilibrium clouds;
∴ Momentum is rebuilding, but flow remains stagnant;
∴ Buyers have not exited, but neither have they re-initiated force;
∴ The chart breathes - but does not speak.
⊢
⧉
· Cryptorvm Dominvs · MAGISTER ARCANVM · Vox Primordialis ·
⚜️ ⌬ - Silence precedes the next force. Structure is sacred - ⌬ ⚜️
⧉
⊢
Btcusd4h
BTCUSD BULLISH MORE all time high again The price may briefly break above the 113,000–114,000 level (first target) to trap long positions, then sharply reverse.
Support Break Warning:
If BTC fails to hold the 110,000–108,000 support zone, it could accelerate a drop to deeper supports:
Support Area 1: 106,000
Support Area 2: 102,000
Extreme Bearish Target: 96,000–94,000
What to Watch:
Bearish divergence on lower timeframes
Volume drop on new highs = possible fakeout
Candle rejection from 113,000–114,000 zone

BTC SCALP TRADE / Long Setupwait for the entry, must use SL. If final tp is achieved then trade is not valid, active till final tp. Must use proper risk management. Expecting upside move. If SL hit then take previous trade, It's still valid.

Weekend BTC Trend Analysis and Trading SuggestionsLet's review this afternoon's market performance. The BTC price, as we anticipated, rebounded to around 109,000 in the afternoon before plummeting sharply. Living up to "Black Friday", this violent drop was well within our expectations. In the afternoon's live trading, we also reminded everyone that as long as there was a rebound to the upper zone, it was a good opportunity to go short. This drop has created a space of nearly 1,500 points. Currently, the BTC price has pulled back to around 107,800.
From the current 4-hour K-line chart, after a strong upward surge, the market encountered significant resistance near the upper track of the Bollinger Bands. As bullish momentum gradually faded, the price started to come under pressure and decline, suggesting that the short-term upward trend may come to a temporary halt. At present, the market has recorded multiple consecutive candlesticks with large bearish bodies. The price has not only effectively broken below the key support level of the Bollinger Bands' middle track but also caused the Bollinger Bands channel to switch from expanding to narrowing, indicating that market volatility is decreasing. In terms of trading volume, it showed a moderate increase during the price pullback, which further confirms the authenticity of the bearish selling pressure.
BTCUSD
sell@108000-1085000
tp:107000-106000
Investment itself is not the source of risk; it is only when investment behavior escapes rational control that risks lie in wait. In the trading process, always bear in mind that restraining impulsiveness is the primary criterion for success. I share trading signals daily, and all signals have been accurate without error for a full month. Regardless of your past profits or losses, with my assistance, you have the hope to achieve a breakthrough in your investment.
Evening BTC Trend Analysis and Trading RecommendationsDuring the morning session, the Bitcoin price continued its upward momentum from the previous night, surging to an intraday high of 110,653. Subsequently, as bullish momentum gradually waned, the price entered a volatile downward channel. Consecutive bearish candles triggered a significant retracement of earlier gains. In the afternoon, supported by the hourly moving average, Bitcoin saw a brief rebound, climbing to 109,852 as U.S. stocks opened. However, bears quickly regained control, pushing the price down to 108,282 before stabilizing, after which it entered horizontal consolidation. The current price remains around 109,000. Notably, our previous short strategy at 109,800 precisely aligned with the trend, successfully realizing the expected profit.
Current trading advice: Consider light short positions within 109,400–109,700, targeting around 108,500. If the price effectively holds support and stabilizes at 108,500, you may attempt light long positions to speculate on a rebound.
BTCUSD
sell@109400-109700
tp:108500-107500

BTCUSD Analysis – Bearish Elliott Wave Structure UnfoldingAfter BTC recently made a high around 111,959, we observed a clear impulsive bearish move followed by minor pullbacks.
The current market price stands at 103,396, and based on the structure, it appears that BTC is unfolding a bearish Elliott Wave pattern. If this holds, we could be in the midst of Wave 3, which typically shows strong momentum and continuation.
Key downside levels to watch:
99,620
97,670 – This level also aligns with a bullish breaker on the 4H chart, making it a potential area of interest for buyers.
Strategy:
My current approach is to sell on pullback, targeting the formation of lower highs and aiming for a break below the recent lower lows.

BTC in Bullish Channel – Another HH Coming ?Bitcoin continues to respect this ascending channel with clear Higher Highs (HH) and Higher Lows (HL).
Every breakout has followed consolidation and pullback patterns. RSI is neutral a breakout above $110K+ could confirm the next HH.
Watching for a move toward the top of the channel... or a deeper HL retest?
What's your take?

Bitcoin Update – Expecting a Correction to $96K! Crypto traders! 💙 Bitcoin looks ready for a pullback to our key level at $96,000. I’m waiting to BUY in this zone, but if the level breaks and price stabilizes below, I’ll consider a SHORT trade to our next target (as previously defined).
⚡️ Pro Trading Tip:
✅ If you’re a trader, always have a strategy—be ready for any scenario!
✅ For long-term investors, accumulate on dips near support levels.
📌 Risk management is key! Double your position size at each lower level to drastically reduce your average entry price.
💎 The Golden Rule of Crypto Success:
🔹 Keep losses small & disciplined.
🔹 Let your winners run to maximize gains!
🔹 The market is unpredictable, but YOU control your capital!
🚀 Bitcoin never sleeps—what’s your play?
👇 What’s your take on this move?
For detailed entry points, trade management, and high-probability setups, follow the channel:
ForexCSP

Bitcoin remains fluctuating at a high levelThe overall market trend is largely in line with my analysis chart. Today, the Bitcoin market shows a pattern of high-level fluctuations and a slight decline. The RSI index is 40.47, having retreated from the overbought area, indicating short-term pullback pressure. However, although the momentum of the MACD indicator has weakened, it still maintains a bullish trend.Moreover, the price is far above both the 50-day moving average and the 200-day moving average, and the medium- and long-term upward channel remains intact, with the overall market in a strong bullish structure.
The operation suggestion is mainly to go long on the pullback, and patiently wait to enter the market at the key position.👉👉👉
BTCUSD Trading Strategy
buy @ 103000-103200
sl 101000
tp 104200-104500
If you think the analysis is helpful to you, you can give a thumbs-up to show your support. If you have different opinions, you can leave your thoughts in the comments. Thank you!👉👉👉

Strategic Analysis of Bitcoin for Next WeekRecently, Bitcoin has broken through the $100,000 mark, and its market dominance has risen to over 60%. Investors are highly bullish. Such a positive market sentiment is likely to attract more investors to enter the market, further driving up the price. 👉👉👉
In the short term, the price of Bitcoin has continuously broken through multiple key technical resistance levels. For example, on May 8th, it broke through the psychological barrier of $100,000, demonstrating strong bullish momentum. The market dominance has risen to over 60%, and investors are highly bullish. Such a positive market sentiment is likely to attract more investors to enter the market, further driving up the price.
BTCUSD Trading Strategy
buy @ 103500-103200
sl 101000
tp 104300-104600
If you approve of my analysis, you can give it a thumbs-up as support. If you have different opinions, you can leave your thoughts in the comments.Thank you!👉👉👉

Bitcoin is likely to rise after its declineFrom the perspective of historical trends and technical indicators, when the short-term moving averages show a bullish arrangement, it is usually a relatively strong signal. However, the previously mentioned signs of a bearish divergence in the MACD indicator imply the risk of a pullback. If Bitcoin can break through the recent resistance level, such as $95,000, it may trigger a new round of upward trend. Conversely, if it fails to break through and the selling pressure continues to increase, there may be a certain degree of decline.👉👉👉
From the demand side, although the inflow of ETF funds is still lower than the level in 2024, the apparent demand has turned positive since the end of February, indicating a certain purchasing power. If this kind of demand continues to grow, it will provide support for the price of Bitcoin. On the supply side, the total amount of Bitcoin is fixed, and the increase in mining difficulty has slowed down the growth rate of new currency supply, which is conducive to price stability or increase to a certain extent.
BTCUSD Trading Strategy
buy @ 93500-9370
sl 925000
tp 94800-95000
If you approve of my analysis, you can give it a thumbs-up as support. If you have different opinions, you can leave your thoughts in the comments.Thank you!👉👉👉

Summary of the Bitcoin Market This WeekThis week, the Bitcoin market showed a trend of steady increase and broke through the key resistance level.👉👉👉
Technically, the MACD indicator on the daily chart shows a strong bullish signal, and the price has also held above the key moving average, confirming the short - to medium - term upward trend. Overall, market sentiment is relatively optimistic, and investors' expectations for it to break through the psychological barrier of $100,000 have increased. However, when Bitcoin approaches the $98,000 level, it may form a short - term resistance, and as the price gets closer to the $100,000 mark, the overly optimistic market sentiment also increases the risk of a pullback.
The better than expected performance of the US job market has alleviated recession concerns, boosted the sentiment of risky assets, and provided support for Bitcoin. Meanwhile, the signs of easing in US - China trade relations have had a positive impact on the global financial markets, including the cryptocurrency market.
This week, the Bitcoin market has performed strongly driven by various factors. Both on-chain data and market indicators have shown positive signals. However, during the process of price increase, it's also necessary to pay attention to the potential risk of a pullback.

#BTC/USDT#BTC
The price is moving within a descending channel on the 1-hour frame, adhering well to it, and is on its way to breaking it strongly upwards and retesting it.
We are seeing a rebound from the lower boundary of the descending channel, which is support at 82900.
We have a downtrend on the RSI indicator that is about to break and retest, which supports the upward trend.
We are looking for stability above the 100 moving average.
Entry price: 83240
First target: 85150
Second target: 86435
Third target: 87858

BTC-----Sell around 82100, target 80800-80300 areaTechnical analysis of BTC contract on April 10: Today, the large-cycle daily level closed with a big positive line yesterday. The K-line pattern was single negative and single positive. The price stood above the MA5 daily average line, but the attached indicator was dead cross. A single rise is difficult to become a trend and difficult to continue. In addition, when the large trend is still weak, there is no room for rise, so the current trend can only be regarded as a correction trend; from the four-hour chart, the current K-line pattern is continuous negative, and the pressure high point after the pullback is 83,600 area, and the price has not broken the correction high point position of the previous stage-by-stage decline. This is very obvious. The current K-line in the short-cycle hourly chart is continuous negative, and the attached indicator is dead cross, so whether the European session can continue is the key.
Today's BTC short-term contract trading strategy: sell directly at the current price of 82,100 area, stop loss at 82,600 area, and target 80,800 area and 80,300 area;

BTCUSD Analysis StrategyBitcoin prices are currently hovering around $84,000 as the market's bull-bear struggle intensifies.
In the short term, Bitcoin remains in a sideways consolidation and base-building phase. Traders are advised to remain nimble and adjust strategies based on the actual breakout direction.
Bitcoin Trading Strategy
sell @ 87000
buy @ 81500,78500
Finally, I'd like to remind every investor that the cryptocurrency market is inherently highly volatile, and every decision you make may have an impact on your investment returns.
you can visit my profile for free strategy updates every day.

BTCUSD Analysis StrategyToday's Bitcoin market shows the dual characteristics of technical correction and cautious market sentiment. The short - term risk is inclined to the downside, but there is still rebound potential in the medium - and long - term.
The fact that the price of Bitcoin has fallen below $84,000 does not mean the end of Bitcoin. Instead, it is just a part of the market operation. For investors, the key to success lies in understanding the underlying factors of the market and correctly assessing the risks and opportunities. In a market full of uncertainties, only by staying calm and conducting rational analysis can one seize the future opportunities.
Bitcoin Trading Strategy
sell @ 90000
buy @ 78000
Finally, I'd like to remind every investor that the cryptocurrency market is inherently highly volatile, and every decision you make may have an impact on your investment returns. In this rapidly changing market, what we need is not just luck, but also a keen mind. You are all welcome to follow me. Let's discuss the future of Bitcoin together. Perhaps it is through the collision of ideas between you and me that we can gain a clearer understanding of this market.

BTCUSD Trading StrategyBitcoin is currently trading at approximately $84,364.87, with a 24-hour gain of 2.96% and a 7-day cumulative decline of -2.81%. Recently, influenced by news about the Trump administration's strategic reserves, the price experienced a "sell-the-news" style pullback, retreating from its high of around $100,000 to consolidate within the $80,000 range. The short-term support level stands at $74,000, while the resistance level is at $85,000.
Bitcoin Trading Strategy
sell @ 90000
buy @ 78000
If you're currently dissatisfied with your Bitcoin trading outcomes and seeking daily accurate trading signals, you can follow my analysis for potential assistance.

BTC LONG Great entry opportunity, important support. I expect at least a bounce. After waiting for a long time, I believe we are finally in a good zone. Don't forget to protect the trade.

BTCUSDT ( BITCOIN ) TODAY'S MAPPING IN 4H TF MUST CHECK IT OUT Hello Guy's Welcome To Another Day Of TRADING
Here we are mapping chart of BTCUSDT ( BITCOIN ) in 4-Hour TF
Our chart shows Bitcoin's price moving within a triangle shape. The price is going up and down, getting squeezed into a smaller range.
What this means: The price is preparing for a big move, either up or down.
If it breaks up: The price might increase a lot.
SUPPORT LEVEL 103,500
2ND SUPPORT. 102,000
TARGET IS 106,500 - 108,000
If the price breaks above resistance, it’s a bullish signal. If it breaks below support, it’s bearish.
If it breaks down: The price might drop, possibly toward the orange zone (2nd support area).

BTCUSD H4 Outlook If this current H4 candle closes below my poi which is 97552.82 I'll be looking to sell Bitcoin down to the indicated liquidity zone 92743.63
If price close above it. I'll wait for the next three H4 candles to know if I'd still be willing to see Bitcoin fall to 92743.63.
What's your outlook on BTC. Drop your comments I'll be glad to read your point of view.

BTC view to 86k!BTC from BBMA point of view
Daily is valid CSAK Sell with clear momentum sell in H4.
As for now; H4 is having re-entry sell at its MA High is aiming for lower BB at 93500 in short term.

Scenario BTC 6.12.There are two main scenarios: either the support at 0.786 breaks through and we go for another ATH, or the support holds and we can watch for a possible correction. If that happens, we can test the levels somewhere around the previous low and if the trendline breaks, we can test the levels around 87k, but we are currently waiting for further signals.

BTC Bullish Above $65.5K, Bearish Below $60K | Weekly to 4-HourHey everyone, it’s Mindbloome Trader here! Let’s dive into Bitcoin’s charts, from the weekly to the 4-hour timeframe. If BTC breaks above $65,570, we’re in for a bullish run. But if we dip below $60K, things could turn bearish fast. Keep these levels on your radar and, as always, trade what you see. Let’s get it!
Key Levels:
Bullish above $65,570 (Target higher moves)
Bearish below $60,000 (Watch for downside pressure)
Mindbloome Trader
Trade what you see
