A boom for bitcoin but let's not forget the brakeThe possibility of growth is stronger for Bitcoin, but there is a possibility of a correction up to the blue range, i.e. the price of 41,112.
The resistance range is located almost 4% higher at 42,755.
We have to wait for the reaction in the support range, because if this range is broken, there is a possibility of falling to the support price of 39.417.
Friends who are risk takers can now enter a long position and set the loss limit below the blue support zone.
Btcusd4h

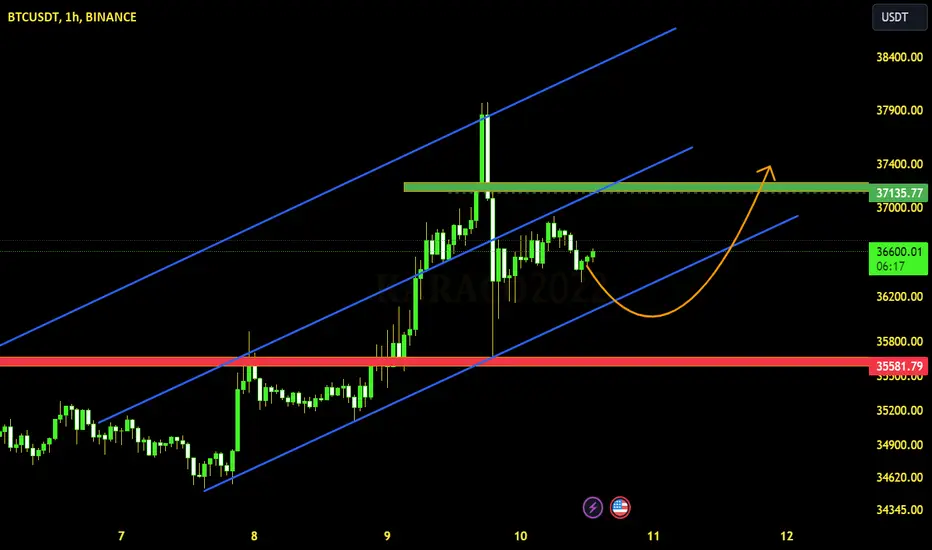
Bitcoin is in an upward trend in the hourly time frameBitcoin is in an upward trend in the hourly time frame, and the possibility of a correction to the bottom of this trend is not far from expected, and this digital currency is likely to see growth again after a correction.
But as we mentioned in the analysis, according to the news, there is a possibility of breaking the bottom of the channel for this digital currency, Bitcoin.
Market Symmetry show BTC dipping before pumping to 34kNOTE: Following is interesting stuff but don't take this seriously as this is just for fun.
I love market symmetry and use it to make models that predict what certain assets may do next, it works as long as model and symmetry remains intact.
Chart is self-explanatory, but still there is a lot going on so let me break it down.
This story began on 12th September as you can see on the left most part of the chart. That is when the current uptrend began and BTC started moving symmetrically on several parameters which are described below.
1. Time spent at the lows before making move that breaks Market structure:
From 12th September lows to the present lows at 26500 the time BTC
consolidated at the lows kept on increasing but in a symmetrical fashion.
As you can see in the chart on the 12th September lows it spent 7 bars , on the
24th September lows it spent 16 bars and on the 11th October Lows it spent 23
bars. So, we can deduce a pattern here. 7, 16 , 23 , the next number in the
series should be 29. Each number in this series is derived by adding a number
from another series 9,7,5,3 ....
2. Time taken from the previous lows to the next highs is constant, that is approx.
30 bars.
3. Percentage move between each low and the next high is also increasing in
symmetrical fashion:
First move was 6% highlighted in yellow vertical bars, second move was 10%, 3rd
Move was 16% , so logically the next number in the series is 24. Each number in this
series is derived by adding a number from another series 4,6,8,10 ....
Notice the curve shown in cyan color which I have fitted as close as possible to the highs and the lows.
So based on this data, we should get out next low on or around 25th Oct and we should spend around 4days consolidating there, then btc should give us an explosive PUMP to 33500 area which is 24% from the anticipated low at 27K on 25th Oct.
We can also make following conclusion based on information presented by above parameters:
Volatility on BTC has been expanding gradually over time, which is giving us bigger pumps, but we also notice that the time between each high and low remains constant while time spent at the lows increases every time, this tells us that each time the time it will take to pump to new highs will reduce hence giving us increasingly explosive pumps.
The target 33500 is also in confluence with the Cyan Curve in the main chart. It is also the measured move of the following large Diamond BTC has been trading in for a long time.

Bitcoin and the possibility of falling more to a conditionToday's news is very important, this news can cause more growth of Bitcoin, so if the news is positive, this analysis will be invalidated.
But according to the technical analysis, there is a possibility of more return and fall for Bitcoin.
This return may happen in the 4-hour time frame, but there is still hope for a return in the daily time frame because the downtrend has broken and the 200-day moving has not been established yet.
In general, if we want to ignore the news, we can have more possibility of fall for Bitcoin

BTC 4HR Analysis - Short Opportunity Right Around the CornerBTC has failed three times in its attempt to ascend to the top of the bull channel with three-pin bar bear candles closing on or near their lows. It's been a slow bleed to the downside ever since last Friday. We are nearing the 200EMA on the 4HR and should expect some support here. A good short entry may be at the end of the next bull bar or two if you're not already in a short.
We should be looking for a breakout of the channel bottom with a bear bar closing on or near its low, followed by a retest of the channel resistance, and a confirmation bar to the downside. Such price action calls for a short back down to the bottom of this trading range we've been in since March of this year, which sets a target price of $25,000.
Trade wisely and let us know what you think in the comment section below!

🟢BTC - Falling Wedge in Rising Channel"As you can see, Bitcoin is in a rising channel on the 4-hour timeframe, and now we can observe a Falling Wedge pattern. As you know, the Falling Wedge pattern is one of the bullish classic patterns that can push the price higher towards the top of the channel. However, don't forget that eventually, the rising pattern must break from the bottom of the channel, and the falling channel must break from the top. So, please pay attention to risk management.

Recent BTC movesBINANCE:BTCUSDT moves with good price action in
time frame, both Option seller and buyer are making
healthy consistently profitst.

Examining the two positions of Bitcoin. The probability of falliBitcoin broke its resistance, but it has not been stabilized yet, and there is still a possibility of price reversal, because the negative divergence is visible in this digital currency, so entry is risky for long.
Considering that we still don't have stabilization of the drop, entering the short position is also risky.
In both cases, we checked the entry to this currency.
And we know more probability with falling.
We don't talk randomly and also we don't say buts and ifs.
Because an analyst must give his final opinion and admit his mistakes
And we all know that no one is always right.
Follow us friends

Bitcoin is like an unchainedBitcoin is in a bearish trend, with the possibility of a small rise to the specified range at best.
But there is still the last hope for the growth of Bitcoin in one-day time, which is the price of 27000.
This price will be the last hope of Bitcoin's 232-day uptrend.

Ready for an attack or escape from a resistance?Bitcoin is in a downward channel, but at the ceiling of this channel...
Considering that Bitcoin had a little drop after touching this downward channel, but it maintained itself near the channel and strengthened the possibility of this channel's failure.
But as we know, any action taken early will lead to loss

Bitcoin's Remarkably Tight Range Bound Since July 24
As a trader, you are likely aware that Bitcoin's price fluctuations have historically been a source of great excitement and profit potential. However, the current market conditions have led to a lack of significant movement, which may leave some traders uncertain or even frustrated. While it is essential to acknowledge and adapt to the prevailing market dynamics, exploring potential future scenarios and their implications for your trading strategies is equally important.
Considering the tight range bound, it would be interesting to hear your perspective on Bitcoin's future trajectory. Do you believe this stagnant phase will persist, or are you anticipating a breakout shortly? Sharing your insights and discussing with fellow traders can provide valuable perspectives and help navigate the market more effectively.
I encourage you to take a moment to reflect on your trading approach during this period of limited volatility. Are there alternative investment opportunities you are exploring or strategies you are considering to adapt to the current market conditions? Sharing your thoughts and experiences can contribute to a more comprehensive understanding of the situation and potentially uncover new possibilities.
Feel free to respond to comments and contact fellow community traders to exchange ideas and opinions. Together, we can navigate the market's twists and turns while adapting our strategies to optimize our trading outcomes.

BTC Price Indicators Signal a Bearish OutlookAs we analyze the technical indicators, it becomes evident that the current sentiment remains bearish, urging us to exercise patience and wait for more favorable conditions.
Firstly, it is worth noting that the Slow D indicator has recently turned negative. This indicator, known for its ability to identify trend reversals, suggests that the prevailing downtrend in BTC may persist for some time. When combined with other hands, remaining vigilant and avoiding hasty decisions becomes even more crucial.
Additionally, while still bearish, the Moving Average Convergence Divergence (MACD) indicator adds to the concerns surrounding BTC's price performance. This indicator, often used to identify potential buying or selling opportunities, suggests continuing the downward trend. It is essential to consider this bearish signal and proceed with caution.
Furthermore, the BTC price is below the Simple Moving Average (SMA) of 200. This long-term moving average is widely regarded as a significant level of support or resistance. The fact that BTC is trading below this level further emphasizes the bearish pressure in the market.
Given these indicators and the overall market sentiment, I strongly encourage you to exercise patience and wait for more positive signals before making significant trading decisions. While the crypto market is known for its volatility, it is crucial to prioritize risk management and avoid impulsive actions during uncertain times.
In conclusion, the BTC price indicators, including the negative Slow D, bearish MACD, and BTC below SMA 200, collectively suggest a cautious approach. It is prudent to wait for more favorable conditions before initiating substantial trades. Remember, successful trading requires seizing opportunities and avoiding unnecessary risks.
Let's wait for BTC indicators to turn positive before making significant trading decisions. Exercise caution and prioritize risk management. Our team supports you and provides guidance during these uncertain times. Stay tuned for further updates.

BTC Drops Below SMA 50 100 with Negative Slow K
Bitcoin (BTC) has experienced a significant drop, breaching the Simple Moving Averages (SMA) of 50, 100, and 200, accompanied by a negative Slow K indicator.
As seasoned traders, we understand the allure of a "buy the dip" strategy, which has often proven to be a classic move in Bitcoin. However, it is crucial to approach the current situation with prudence and consider the potential risks associated with such a move.
The recent decline below the SMA 50, 100, and 200 levels suggests a shift in the overall trend, indicating a potential bearish sentiment in the market. Additionally, the negative Slow K indicator further strengthens this cautious outlook. While historical data may suggest that buying the dip has been a profitable strategy in the past, it is essential to acknowledge that market dynamics can change rapidly.
Given these indicators, I encourage you to exercise caution and carefully evaluate your investment decisions. It is advisable to re-evaluate your risk tolerance and consider the potential consequences of a further downturn in the Bitcoin market. Remember, preserving capital is equally essential as seeking growth opportunities.
Before making any investment decisions, conducting thorough research and consulting with trusted financial advisors or professionals experienced in cryptocurrency trading is always wise. They can provide valuable insights and help you navigate through these uncertain times.
While the current market conditions may present an opportunity for some, it is crucial to approach it with a cautious mindset. As traders, we must prioritize risk management and make informed decisions aligning with our investment strategies.
Please remember that the cryptocurrency market is highly volatile, and staying informed and adapting to changing market dynamics is essential. Stay vigilant, keep a close eye on the market trends, and consider seeking expert guidance when in doubt.

Bitcoin on the borderThe number of hits to the support floor of Bitcoin has increased and this can signal a drop, so in any case, management must be observed.
But in the 4-hour timeframe, we currently have a positive divergence, and in the hourly timeframe, there is a possibility of a short growth

Buyers go shoppingBy reaching its support floor in the suffering trend, Bitcoin has increased the possibility of its growth, so the first resistance range in 1 hour time has been determined for Bitcoin, also the important support range has been determined in the price, which is an important range in the medium term.
There is a noisy pattern in the time of one hour for this currency, which enables the possibility of one percent growth.
Follow us on social networks and support us by Like.

Obsessed with Bitcoin or Alzheimer's?By reaching the support range, Bitcoin raised the possibility of its growth again. According to this analysis, in the hourly time, we will have the possibility of a growth up to the specified range for this currency. Also, the divergence in 4 hours shows the growth of this currency, and for the ranges Support and resistance move according to the analysis

Distance from the dangerous area and trying to flyBitcoin is still in a neutral trend, and upon reaching the bottom of this trend, the possibility of growth will gain strength

BTC Price Dips Below SMA 50 and 100 as They Go FlatOver the past few days, we have witnessed a significant decline in the price of Bitcoin, resulting in it falling below the Simple Moving Averages (SMA) of both 50 and 100. Furthermore, these moving averages have also started to flatten, indicating a potential weakening of the bullish trend we have been observing.
While it is important to remember that past performance does not indicate future results, this recent price action combined with the SMA indicators suggests a potential shift in market sentiment. As such, it may be prudent to pause and reevaluate your investment strategy before making further moves in the Bitcoin market.
I understand that Bitcoin has shown immense potential for growth in recent years, but it is equally important to exercise caution and carefully analyze the current market conditions. By taking a step back and assessing the situation objectively, we can better position ourselves to make informed decisions and mitigate potential risks.
In light of these recent developments, I encourage you to consider the following call to action:
1. Pause and Reflect: Take some time to analyze the current market conditions and reassess your investment strategy. Consider the potential implications of Bitcoin falling below the SMA 50 and 100 and the flattening of these indicators.
2. Research and Stay Informed: Stay updated with the latest news and analysis from reputable sources to comprehensively understand the factors influencing the Bitcoin market. This will help you make informed decisions based on a well-rounded perspective.
3. Consult with Experts: Contact trusted financial advisors or cryptocurrency experts who can provide valuable insights and guidance tailored to your investment goals and risk tolerance.
Remember, the cryptocurrency market can be highly volatile, and exercising caution and prudence in your trading activities is crucial. We can better protect our investments and potentially capitalize on future opportunities by taking a cautious approach during uncertain times.
Please do not hesitate to reach out if you have any questions or want to discuss this matter further in the comments. I am here to support you and provide any additional information you may require.

BTC:i think it will continue to rise
Hey traders, I think bitcoin will continue to rise next, what do you think?
Bitcoin (BTC) has been extremely quiet in recent days, but if the U.S. dollar continues the downward trend brought about by the non-farm data, Bitcoin (BTC) price will benefit and strengthen. From a technical perspective, if Bitcoin holds the 30,000 mark, the bullish outlook will remain
From the 4-hour chart, the upper pressure is around 31,200 points, and the lower support is at 30,000 points.
At the current price, you can buy long positions with small positions, tp31200
If the back step does not break through 30,000, you can buy long positions with large positions.
If you agree with my strategy, welcome to pay attention
BINANCE:BTCUSDT BITSTAMP:BTCUSD

Bitcoin stagnatesIs there a sense of concern regarding the current state of the BTC market? As you may have noticed, BTC has stagnated while the RSI remains above 50, and the MACD has declined into negative territory.
These indicators suggest that we may be entering a bearish phase and need to act accordingly. While it can be tempting to hold onto our BTC in the hopes of a rebound, it is crucial to consider the potential risks.
That is why I am encouraging you to consider selling your BTC now. We can minimize our potential losses and protect our investments by taking action now.
Of course, the decision to sell is ultimately up to each trader. However, I strongly urge you to look closely at the current market conditions and make an informed decision based on your risk tolerance.

Btc trade Well with the whole chaos going in the crypto space then it's safe to say they isn't a buying force and don't forget we are still in a bear market so expect btc to drop off to 24k region if support doesn't hold 😉

BTC Correction going to $24KBINGX:BTCUSDT.PS BINANCE:BTCUSDT KUCOIN:BTCUSDT OKX:BTCUSDT BYBIT:BTCUSDT COINBASE:BTCUSDT
BTC correction will continue to $24K (Fibonacci level 0.681).
That will be PRZ for a long entry.

BTCUSDT AnalysisWe saw big bullish of BTC. end of the week we have interesting moment of BTC, its 19th day BTC is in flat we had a lot of touches and lot of liquidations, at least we are in bear and its showing us Trend Line and 200 MA, our trend is below of this 2 thing and its continue moving, what I need to see here is brake support or resistance for make sure which way will chose market to go, but in my opinion BTC bearish because USDT Dominance is going up, on USDT Dominance 1D chart we saw double bottom and broken trendline, ( I have analysis of USDT Dominance you can see that in my ideas) I am going to short BTC for 3 reason, First - last month we have bearish scene, Second - we saw aggressive touch of Bearish Trendline and Resistance zone, Third - USDT Dominance bullish scene.
