BTC/USD Potential Reversal & Bullish Breakout SetupBTC/USD Potential Reversal & Bullish Breakout Setup 🔄🚀
Technical Analysis Overview:
🔹 Pattern Formation:
The chart displays a potential Triple Bottom pattern (🟠), a classic reversal signal forming at the $104,870–$100,000 support zone 🛡️. This structure suggests a strong base is being established for a potential upside move.
🔹 Support Zone:
📉 The price has consistently bounced off the major support area around $100,000–$104,870, indicating strong buying interest.
🔹 Resistance Zone:
📊 The key resistance level lies around the $114,000–$115,000 range 🔵, which has been tested multiple times in the past (🔴 arrows) and could act as a future profit target.
🔹 Price Action & Projection:
Currently, price is trading near $107,025 and is showing signs of bullish continuation after forming a higher low. If the price consolidates above the $104,870 zone and holds support, we could see a potential breakout targeting the $114,000 resistance 📈.
📌 Key Takeaways:
✅ Triple Bottom formation signals trend reversal.
🔄 Bullish structure confirmed above $104,870.
🎯 Next target: $114,000 if breakout holds.
⚠️ Watch for potential consolidation before continuation.
Btcusdanalysis

Bitcoin - Will Bitcoin Reach Previous ATH?!Bitcoin is above EMA50 and EMA200 on the four-hour timeframe and is in its short-term descending channel. We can look for Bitcoin short positions from the specified supply range. If this range is broken, the path to the rise and a new ATH for Bitcoin will be presented.
It should be noted that there is a possibility of heavy fluctuations and shadows due to the movement of whales in the market and capital management in the cryptocurrency market is required, more than we would like. If the downtrend continues, I can buy in the desired range.
Bitcoin is now approaching its all-time high, yet unlike previous bullish cycles, we have not seen widespread profit-taking so far. The market’s whales currently seem uninterested in large-scale selling at these levels and appear to be waiting for higher price targets.
Since the start of January 2024, cumulative inflows of over $60 billion have poured into crypto-related investment products in the U.S., including ETPs and ETFs. In addition, retail investor futures trading volumes have recently surpassed their one-year average. Indicators of retail activity suggest that a significant number of smaller investors have become active in the futures markets.
The total assets under management by crypto investment funds surged to an unprecedented $167 billion in May. This impressive growth was fueled by net inflows of more than $7 billion into these funds. Meanwhile, global equity funds recorded $5.9 billion in outflows, and gold funds, for the first time in 15 months, also saw capital leaving.
The year 2025 could turn out to be the most dangerous year yet for cryptocurrency holders. Already, more than 25 incidents involving physical attacks on crypto owners have been reported, and the year isn’t even over. These attacks have targeted individuals whose digital asset information or identities were compromised, leading to thefts, kidnappings, physical threats, or assaults.
On another front, the total value of circulating stablecoins has surpassed $250 billion, more than doubling from its mid-2023 low of $123 billion. USDT remains the market leader with a 62% share, followed by USDC at 24%, while other stablecoins such as USDe, DAI, and BUIDL are also expanding their presence.
It is worth noting that average spot trading volumes on centralized exchanges have dropped to their lowest levels since October 2020.This kind of pattern typically precedes a significant price move—whether that’s a sharp rally or a deep correction. It’s also possible that this phase of uncertainty could persist for several more weeks.

Bitcoin Bounce & Breakout PlayChart Analysis:
🔹 Support Holding Strong:
BTC is respecting a key support area (~$105,600), which previously acted as resistance (marked by recent ATH).
🔹 EMA 70 (Blue Line):
Price is hovering above the EMA, adding bullish confirmation.
🔹 Bullish Projection Path:
The chart shows a projected bullish move toward the sell zone near $113,200 – $113,300, representing a potential 4.4% gain from the breakout.
🔹 Key Zones:
Support Zone: $105,600
Supply Zone: $100,500
Sell Zone (TP Zone): $113,200+
📌 Outlook:
If BTC breaks and holds above the resistance (~$107,000), a strong upward rally could follow. Entry near support or on breakout, with tight risk management, offers a favorable risk/reward.
✅ Entry Options:
Breakout Entry:
Trigger: Break and close above $107,200
Confirmation: Retest and hold above the breakout zone
Entry: $107,300 – $107,500
Support Bounce Entry:
Trigger: Pullback to support zone (~$105,600) with bullish reversal candle
Entry: $105,600 – $105,800
🎯 Target Zones (TP):
TP1: $110,400 (minor resistance)
TP2: $113,200 – $113,300 (major sell zone)
TP3 (aggressive): $114,000+
🔻 Stop Loss (SL):
For breakout entry: SL below $106,200
For bounce entry: SL below $105,200 or $104,800 (structure break)
📈 Risk–Reward Ratio:
Approx. 1:2.5 to 1:3+ depending on entry and target
🧠 Trade Management:
Move SL to breakeven after hitting TP1
Partial profit booking at TP1
Trail remaining with manual or dynamic SL (e.g., below EMA or recent low)
⚠️ Risk Notes:
Avoid chasing price without breakout confirmation
Watch for fakeouts and heavy selling near TP zones
Adjust position size based on your risk tolerance

BTC “Golden Cross” Looms, but Geopolitics Could Delay ItBitcoin’s “Golden Cross” Looms, but Geopolitical Shocks Could Delay the Breakout
Deep dive into price action, derivatives, on-chain data, and the tug-of-war between Middle-East risk and crypto bull-run momentum
________________________________________
Table of Contents
1. Executive Summary
2. Scene-Setter: BTC at $105 K in a World on Edge
3. Technical Spark: What a Golden Cross Really Means
4. Price Action: From $103 K Dip to $106.8 K Hurdle
5. Options Market: A Sudden Lurch Toward Puts
6. Macro Overhang: Why Israel–Iran Turmoil Matters to Bitcoin
7. On-Chain Pulse: 656 % Cycle Gain, Yet Supply Is Tighter Than 2021
8. Mining Fundamentals: Difficulty Eases, Margins Improve
9. Corporate Treasuries: The Quiet, Sticky Bid
10. Targets & Scenarios: $97 K Downside vs. $229 K Upside
11. Strategy Playbook for Traders & Investors
12. Conclusion: Delayed, Not Derailed
13. Disclaimers
________________________________________
1. Executive Summary
• Bitcoin (BTC) is trading in a tight $103 K–$108 K band, unable to confirm a breakout as Middle-East tensions push investors into hedging mode.
• A Golden Cross—the 50-day SMA crossing above the 200-day—could flash within 10 trading sessions, historically adding +37 % median upside over the subsequent 90 days.
• Options flow has flipped decisively toward puts, with the 25-delta skew hitting –10 %, its most bearish since the FTX collapse, signaling short-term anxiety even as long-term bets remain bullish.
• On-chain metrics (exchange balances at six-year lows, HODLer supply at all-time highs) reveal structural demand; Glassnode notes a 656 % cycle advance despite a trillion-dollar market cap.
• Analysts’ upside targets range from $140 K (Q3) to $270 K (October) and even $229 K based on the Golden Cross fractal. Yet a clean break of $104 K support opens room to $97 K first.
________________________________________
2. Scene-Setter: BTC at $105 K in a World on Edge
Bitcoin entered 2025 with a blistering rally—spot ETFs hoovered nearly 200 K coins in four months, miners sold aggressively into strength, and macro tailwinds (Fed easing, USD weakness) fueled risk appetite. Then two macro curveballs hit:
1. Sticky U.S. core inflation revived “higher-for-longer” rate fears.
2. Israel–Iran hostilities spooked global markets, sending Brent crude to $76 and sparking a dash for USD liquidity.
BTC, once heralded as “digital gold,” behaved like a high-beta tech stock: it slipped 7 % in 48 hours, tagging $103,200 before bargain hunters stepped in. As of this writing, price sits near $105,800—right on the 100-hour SMA. Whether we escape the range depends on which force proves stronger: geopolitical dread or the long-term structural bid.
________________________________________
3. Technical Spark: What a Golden Cross Really Means
A Golden Cross occurs when the 50-day simple moving average (SMA-50) crosses above the 200-day (SMA-200). In Bitcoin’s 14-year history, we have logged nine such events:
Year Days to Cross 90-Day Return 180-Day Return
2013 51 +88 % +202 %
2015 73 +34 % +67 %
2019 46 +193 % +262 %
2020 38 +77 % +112 %
2023 59 +29 % +48 %
Median 90-day gain: +37 %
Median drawdown post-cross: –12 %
We are ~$700 shy of triggering the cross (SMA-50 at $97.9 K, SMA-200 at $98.1 K and rising). Assuming volatility stays muted, the lines converge within two weeks, potentially firing a widely watched buy signal. But remember: the cross is lagging; smart traders anticipate, not react.
________________________________________
4. Price Action: From $103 K Dip to $106.8 K Hurdle
Key intraday levels (Kraken feed):
• Support 1: $104,000 – prior weekly low + bullish order-block
• Support 2: $101,200 – 0.786 Fib retrace of the Feb–Mar impulse
• Bear Pivot: $97,000 – 200-day EMA + high-confluence volume node
• Resistance 1: $106,800 – last week’s swing high; three failed probes
• Resistance 2: $108,500 – May monthly open
• Bull Pivot: $113,000 – neckline of the March distribution range
Monday’s bounce broke a declining trend-line from $110 K, printing a higher low—constructive, yet bulls require a daily close >$106.8 K to invalidate the short-term bearish structure.
________________________________________
5. Options Market: A Sudden Lurch Toward Puts
Deribit data (largest BTC options venue):
• Put/Call Ratio: 0.62 last Friday → 0.91 today
• 25-Delta Skew (1-month): –10 %, lowest since Nov-2022
• Max-Pain for April 26 expiry: $104 K (huge open interest)
Translation: traders rushed to buy protective puts as Iran war headlines crossed. Market-makers, short those puts, delta-hedged by shorting spot or perpetual futures, adding downward pressure—classic gamma feedback loop.
Yet term structure remains contango; June and September IVs price higher topside. Institutions appear to sell near-dated panic, accumulate long-dated calls—a bullish medium-term stance.
________________________________________
6. Macro Overhang: Why Israel–Iran Turmoil Matters to Bitcoin
1. Risk-Off Correlation: Despite “digital gold” narratives, BTC’s 30-day correlation with the Nasdaq-100 sits at 0.64; equities slide → crypto follows.
2. USD Liquidity Drain: War premium lifts oil, stoking inflation and forcing the Fed to delay cuts; higher real yields pressure non-yielding assets.
3. Regulatory Optics: Heightened national-security chatter emboldens lawmakers keen to scrutinize crypto, a perceived sanctions-evasion channel.
4. Regional Flows: The Middle-East hosts some of the largest sovereign-wealth pools; risk aversion could pause their crypto allocations.
5.
Hence, every missile headline becomes a volatility catalyst. Still, flash-risk events fade quickly if energy supply stays intact, offering windows for BTC to re-assert its secular trend.
________________________________________
7. On-Chain Pulse: 656 % Cycle Gain, Yet Supply Is Tighter Than 2021
Glassnode frames Bitcoin’s ongoing bull as “one of the most explosive relative to market cap gravity.” Highlights:
• Cycle Return: 656 % from the $14 K November-2022 bottom—impressive given the asset is now >$2 T in free-float value, dwarfing 2017’s sub-$100 B base.
• Exchange Balances: Just 2.02 M BTC on centralized venues—13-year low.
• Realized Price (short-term holders): $92,500—suggests marginal buyers remain well in profit.
• Entity-Adjusted Dormancy Flow: At 275 K BTC/day vs. 2021’s 550 K—implying HODLers are less willing to spend.
Put simply: even after a seven-fold rally, supply scarcity persists.
________________________________________
8. Mining Fundamentals: Difficulty Eases, Margins Improve
The April 20 adjustment saw difficulty dip 1.2 %, the first contraction since January. Why it matters:
• Post-Halving Breathing Room: Block subsidy fell to 1.5625 BTC; a difficulty rollback cushions miner profit margins, lowering forced selling risk.
• Hashrate Plateau: Network hashrate hovers at 640 EH/s, only 3 % off the ATH—miners remain confident.
• Transaction Fees: Average fee per block = 0.37 BTC, still elevated by historical standards thanks to BRC-20 activity.
Miners thus appear cash-flow stable, reducing downside pressure on spot markets compared to previous post-halving eras.
________________________________________
9. Corporate Treasuries: The Quiet, Sticky Bid
Since MicroStrategy cracked the dam, 68 public companies now hold BTC on balance sheets, totaling 412,000 coins (~$43 B). Recent newcomers:
Company Purchase Date BTC Added Avg Cost
SemiconX Feb-2025 2,500 $94,800
Nordic Logistics Mar-2025 800 $98,200
Atlantech Energy Apr-2025 1,200 $101,500
Traits of corporate treasuries:
• Long-Dated Liabilities: Align with Bitcoin’s four-year halving cadence.
• Low Turnover: None of the 68 have sold core holdings despite 80 % drawdowns in 2022.
• Regulatory Transparency: SEC filings broadcast purchases, inviting copycat demand.
This sticky bid stabilizes spot markets during macro squalls.
________________________________________
10. Targets & Scenarios: $97 K Downside vs. $229 K Upside
Bearish Path (30 % probability)
• Trigger: Israel–Iran broadens, Fed signals no cuts in 2025.
• Price Action: Break $104 K, bulls capitulate at $97 K (200-day).
• Depth: Could wick to $88–90 K (0.618 retrace) if macro gloom persists.
Base Case (50 % probability)
• Trigger: Skirmishes contained; oil cools, Fed cuts twice by December.
• Price Action: Golden Cross confirms, BTC grinds to $128 K by September.
• Highs: $140 K tap as ETF inflows resume.
Bullish Path (20 % probability)
• Trigger: Middle-East cease-fire + ETF FOMO round two + dovish Fed pivot.
• Fractals: Prior Golden-Cross extensions averaged +120 % at extreme.
• Price Action: $150 K by summer, $229 K (Fib 2.618 from 2022 low) by year-end.
• Blow-Off: $270 K October spike before the next cyclical bear begins.
________________________________________
11. Strategy Playbook for Traders & Investors
Horizon Bias Instruments Risk Management
Intraday (0–48 h) Range scalp $104–$107 K Perp futures (5× max), options gamma scalping Hard stop $103 K; position <1 % equity
Swing (2–8 wks) Buy pullbacks ahead of Golden Cross Spot, dated futures roll, 1-month $110 K calls Stop $97 K daily close; size 5–10 %
Position (3–6 mo) Accumulate for $140–150 K target Spot, June/Sept call spreads ($120/150) Hedge via 25 % put collar
Long-Term (1–4 yr) Maintain core stash; ignore noise Cold storage, DCA Re-balance only when price doubles
Optional hedge: Long Gold / Short BTC ratio spread as a geopolitical shock absorber; ratio 1.3 currently, mean-reverts to 1.1 post-crises.
________________________________________
12. Conclusion: Delayed, Not Derailed
Bitcoin stands at a crossroads: a textbook Golden Cross beckons, ETF inflows smolder, miners relax, and corporate treasuries drip-feed demand. Yet war headlines and a cautious options market act as sandbags on the balloon. History says macro shocks slow, not stop secular bull cycles. Unless Middle-East conflict strangles global liquidity or the Fed slams the brakes far harder than priced, BTC’s higher-time-frame structure remains bullish. Expect turbulence, embrace risk controls—but don’t mistake a weather delay for a busted engine.
________________________________________
13. Disclaimers
This article is for educational purposes only and does not constitute financial advice. Cryptocurrency investing involves substantial risk; never invest more than you can afford to lose.

BTCBTC is in a consolidation, we need this to protect 100K level, if it drops 100K then further downside will follow otherwise its good to go up.
Disclosure: We are part of Trade Nation's Influencer program and receive a monthly fee for using their TradingView charts in our analysis.

ARPAUSDT Forming Falling WedgeARPAUSDT is currently presenting a classic falling wedge pattern, which is widely recognized as a bullish reversal formation in technical analysis. This setup suggests that the recent downtrend may be losing momentum, with lower highs and lower lows converging toward a breakout point. The narrowing wedge, combined with consistent volume, indicates that a strong move could be imminent once resistance is broken. Based on the structure and historical behavior, traders are eyeing a potential gain in the range of 80% to 90%+ in the upcoming sessions.
The volume profile remains healthy, reflecting strong investor interest and growing participation around these price levels. This is often a precursor to breakout rallies, especially when the broader market sentiment is shifting toward altcoins. The wedge pattern, if confirmed by a breakout above the resistance line with strong bullish candles, could trigger a significant upside momentum as technical traders and algorithms enter long positions.
ARPAUSDT also benefits from strong community backing and increasing mentions across social and trading platforms, signaling that sentiment is tilting positive. With fundamentals aligning and technicals pointing to a breakout, this pair stands out among mid-cap altcoins for traders looking for potential explosive setups. Key levels to watch include the breakout point and subsequent resistance zones, which, if cleared, may lead to a sustained bullish move.
As the pattern develops and market dynamics unfold, ARPAUSDT could become one of the more attractive opportunities in the short term. Be prepared for increased volatility and monitor the breakout closely for confirmation.
✅ Show your support by hitting the like button and
✅ Leaving a comment below! (What is You opinion about this Coin)
Your feedback and engagement keep me inspired to share more insightful market analysis with you!

DUSDT Forming Falling WedgeDUSDT is displaying a well-defined falling wedge pattern, which typically signals a strong bullish reversal once a breakout occurs. The structure of this chart suggests that selling momentum is waning while accumulation is gradually increasing. A breakout above the upper resistance of the wedge can unlock a sharp upside move, with a target gain in the range of 90% to 100%+. This projection is consistent with historical price behavior following similar wedge formations.
Volume remains steady, a critical sign that smart money may be quietly building positions before a potential breakout. Technically, DUSDT is positioned at the final stage of the wedge structure, and traders are watching closely for a confirmation candle that could validate the bullish setup. If momentum carries forward, the next resistance levels could be broken swiftly, leading to a fast rally as short positions unwind and new buyers step in.
Investor sentiment toward this project is showing renewed strength, with increasing chatter on social platforms and consistent mentions in altcoin analysis circles. The asset remains underpriced relative to its potential, attracting speculative interest from traders looking for high upside opportunities in smaller-cap pairs.
With bullish technicals aligning and market conditions favoring risk-on plays, DUSDT is worth watching closely. A confirmed breakout could trigger a substantial trend reversal in the coming sessions.
✅ Show your support by hitting the like button and
✅ Leaving a comment below! (What is You opinion about this Coin)
Your feedback and engagement keep me inspired to share more insightful market analysis with you!

BTC/USDTWhenever Bitcoin goes above 106k, we can enter a long position at the target I specified on the chart. What do you think? Tell me.

BTC/USDT Bullish Reversal Zone AnalysisSupport Zone:
The horizontal purple box (~104,000 USDT area) has acted as a strong support/resistance flip zone multiple times.
Falling Wedge Breakout:
The price action broke out of a falling wedge pattern earlier, confirming bullish momentum.
Flag Formation (Current):
A smaller bullish flag/pennant appears to be forming, and a breakout above could trigger a strong upward move.
Projected Move:
The black arrow indicates a potential bounce from this support zone, with the price targeting the 111,000–112,000 USDT zone (highlighted in the top purple box).
Volume Spike:
Notable volume spike near the bottom supports the idea of accumulation and possible reversal.
📈 Conclusion:
If the support zone holds and price breaks above the minor flag, a bullish continuation is likely toward the 111,000–112,000 resistance area. Traders should watch for confirmation of a breakout and volume increase for validation.

Bitcoin/US Dollar 1-Hour Price Chart (June 15, 2025)a 1-hour candlestick chart for Bitcoin (BTC) priced in US Dollars (USD), showing a recent price of $105,154.79 with a slight decline of -0.30% (-$311.19). The chart highlights a price range between $103,501.84 and $106,000.00, with a notable support level around $105,154.79 and a resistance zone shaded in pink between $105,217.91 and $105,767.97. The time frame spans from 10:00 to 20:00, with the current time at approximately 15:00.

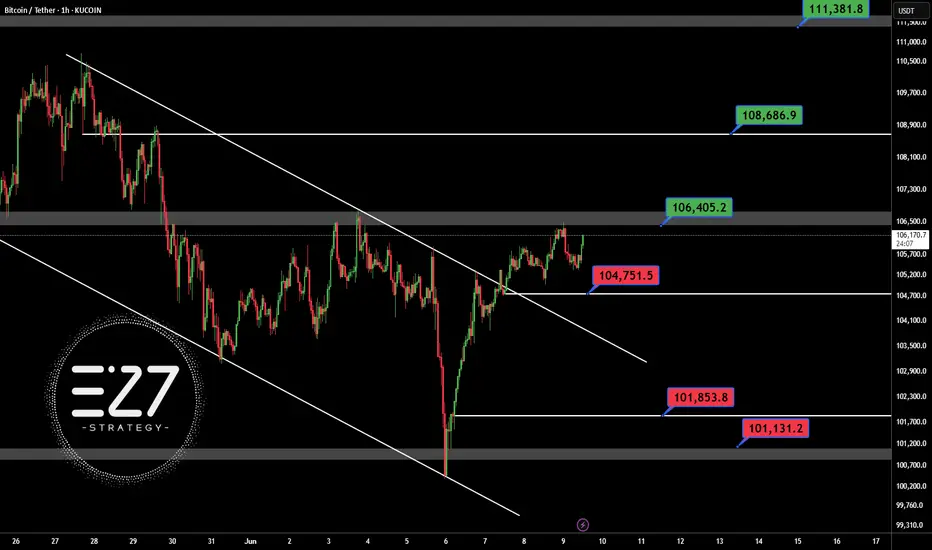
BTCUSDTSafe for open long position in BINANCE:BTCUSDT abow 106.400$ in H1 time frame.
First support: 104.750$
Best support: 101.850 - 101.131 $
First resistance: 106.400$
Best target this chart: 108.700 - 111.381$
Contol money management
BTC-----Sell around 100500, target 103500 areaTechnical analysis of BTC contract on June 14:
Today, the large-cycle daily level closed with a small negative line yesterday, the K-line pattern continued to fall, the price was below the moving average, and the attached indicator was dead cross. The decline in the big trend was still very obvious. We should pay attention to the breakout and pressure signal of the high point of yesterday's correction and pullback in the 106200 area; the short-cycle hourly chart yesterday's price rebounded and corrected after hitting the low point, and retreated under pressure in the Asian morning today. The current K-line pattern continued to fall, and the attached indicator was dead cross. Then the trend is likely to fluctuate downward during the day, but the strength is not expected to be great over the weekend, so it is still short-term.
BTC short-term trading contract strategy:
Directly short in the 100500 area, stop loss in the 105500 area; target is 103500 area;

Bitcoin Sentiment Slips Below Neutral As Price Hovers Near $105KBitcoin sentiment drops to 46.1% as market shows hesitation despite price rebound.
Trading volume remains flat, weakening support for BTC’s move above $105K.
Sentiment must exceed 60% with rising open interest to avoid retest of $102K support level.
According to the latest Advanced Sentiment Index data, Bitcoin sentiment has weakened despite the asset making a small recovery. As of June 13, the index recorded a reading of 46.1%, falling below the neutral 50% mark. This shift indicates a cautious market environment where investors remain hesitant to drive further gains without stronger confirmation signals. While Bitcoin has rebounded from recent lows, sentiment metrics and trading volume suggest limited conviction behind the price move.
According to the Bitcoin Advanced Sentiment Index, the current reading has fallen to approximately 46% just below the neutral 50% threshold. The chart shows that after bullish sentiment peaked above 80% in early June, the index has gradually declined; despite the recent TELEGRAM /(@TradeWithARZ) June 14, 2025
Data from the Advanced Sentiment Index shows that market optimism peaked above 80% in early June but has steadily declined since. The chart, tracking activity from May 16 to June 13, shows that sentiment dropped below 20% on multiple occasions, including June 5 and June 13, both aligning with short-term declines in Bitcoin’s price. Although the asset has since bounced back from those levels, investor confidence remains subdued.
The bell curve model used in the chart emphasizes that the majority of sentiment readings have clustered between 40% and 65%, showing a lack of extreme bullish or bearish positions. This distribution suggests uncertainty, as traders hesitate to take strong directional bets.
Recent price action within the $103,000 -$105,000 area has, however, not been accompanied by new volume inflow as net buy volume and volume delta show almost no change. The stagnation of these indicators suggests that the market participants did not support the rise to a sufficient degree.
Price Volatility Contains Within Narrow Range
According to CoinMarketCap, Bitcoin was trading at $104,950.96 at the time of writing, reflecting a 0.31% decrease over the past 24 hours. The price surged above $106,000 but faced resistance and returned to a tighter trading band. A major dip occurred around 6 PM on June 13, followed by a rebound during the early hours of June 14. Despite these fluctuations, the asset has not broken out of its recent consolidation pattern.
Source: CoinMarketCap
The volume-to-market cap ratio over the last 24 hours is 2.38%, which indicates moderate trade. The total circulating supply of bitcoin has now grown to 19.87 million BTC and is getting ever closer to the protocol-imposed limit of 21 million. Despite the stability seen in price action, analysts are monitoring bigger signs before calling a directional change.
According to analysts, the sentiment index needs to exceed 6065 percent to validate a sustainable uptrend. An increase in open interest and net taker volume is unlikely to achieve that level. In the absence of those conditions, the market is vulnerable to retesting lower support areas between $102,000 and $103,000.

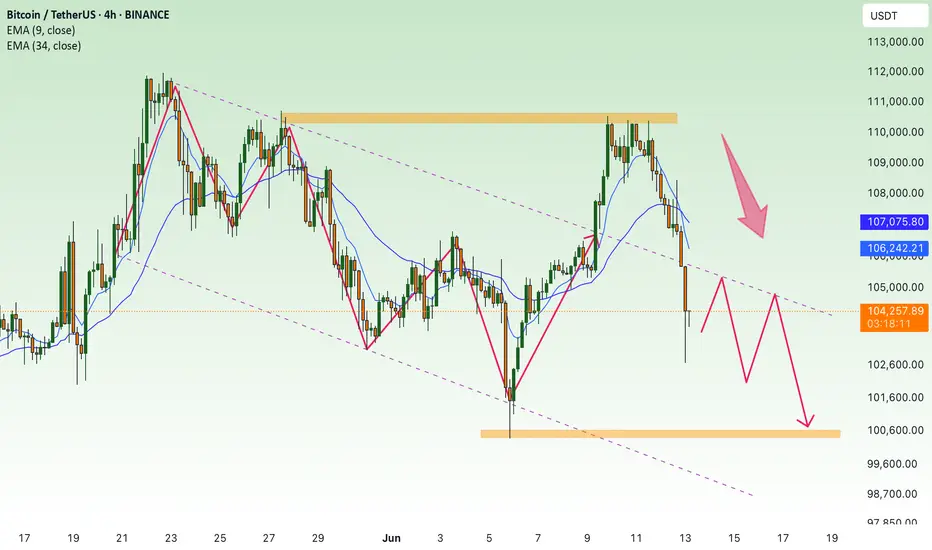
BTC/USD – Bearish Continuation from Rising Channel BTC/USD – Bearish Continuation from Rising Channel 🚨🧱
This chart indicates a bearish market structure with the following key technical features:
🔍 Chart Analysis:
Change of Character (CHoCH) 🔄
A shift from bullish to bearish was confirmed by a strong breakdown after the CHoCH marked at the top.
This breakdown invalidated previous bullish structure.
Bearish Flag Formation 📉📐
After the impulsive drop, price formed a bearish flag (rising channel), suggesting a potential continuation move to the downside.
Resistance Rejection 🚫
Price is currently testing and rejecting the 105,800–106,500 resistance zone, previously a support turned resistance.
The rejection from this level adds further bearish confluence.
Downside Projection ⬇️📍
If the pattern plays out, the projected move shows a potential drop toward the major support zone at 100,000–101,000.
📌 Key Levels:
Resistance Zones:
105,800–106,500 🧱
109,500–111,000 🧱
Support Zone:
100,000–101,000 💚
🧠 Conclusion:
The chart suggests that BTC/USD is in a bearish continuation phase, with strong rejection from key resistance and a confirmed breakdown from a bearish flag. Traders should watch for confirmation of continuation below 104,500 to target the 100k support level. Risk management is crucial near volatile zones.

₿ Bitcoin: SlippedAfter holding steady for two days, Bitcoin broke lower yesterday, confirming a setback within green wave B. This countertrend move delays the anticipated climb, which we still expect to reach its peak in the upper blue Target Zone (coordinates: $117,553 – $130,891). From there, bearish wave C should take over. The upper blue zone remains a tactical area for partial profit-taking or hedging long positions with shorts. Wave C is expected to drive the price sharply lower into the blue Target Zone (coordinates: $62,395 – $51,323), where we anticipate the completion of orange wave a. Orange wave b may trigger a corrective bounce, but ultimately, renewed downside should wrap up the intermediate correction of blue wave (ii). Still, there’s a 30% chance that Bitcoin forms a higher high as part of blue wave alt.(i)—temporarily breaching the upper blue zone.
📈 Over 190 precise analyses, clear entry points, and defined Target Zones - that's what we do.

DeGRAM | BTCUSD correction from the 110k level📊 Technical Analysis
● Price has reclaimed the rising-channel median at ≈106.8 k and immediately made a higher-high on expanding volume; hourly RSI also pierced its two-week bear trend, flagging fresh upside energy.
● An ascending triangle is forming between 107 k support and a 109.5 k ceiling; its measured move coincides with the red supply/upper rail at 111.6-112 k.
💡 Fundamental Analysis
● Softer US PPI (-0.1 % m/m) dragged real 2-yr yields to one-month lows, easing dollar pressure, while spot-ETF desks soaked up another ≈4 600 BTC this week, signalling renewed institutional demand.
✨ Summary
Stay long above 107 k; triangle break over 109.5 k unlocks 111.6 k then 115 k. Long view invalidated on a 4 h close beneath 103 k.
-------------------
Share your opinion in the comments and support the idea with a like. Thanks for your support!

PAXGUSDT Forming Bullish FlagPAXGUSDT, the tokenized version of gold on the blockchain, is displaying a bullish setup supported by healthy trading volume and growing investor interest. As market uncertainty persists, more investors are rotating capital into assets with tangible backing like PAXG, which is pegged to physical gold. This makes it not only a strategic hedge in volatile markets but also a compelling crypto instrument for portfolio diversification. The chart shows a stable uptrend formation, indicating that price is coiling for a potential breakout with a near-term gain target of 10%+.
Technically, PAXGUSDT is holding above key support levels and showing signs of strength after a recent consolidation phase. The market structure remains intact, and any break above the immediate resistance zone could propel the price higher, aligning with traditional bullish continuation patterns. The increasing volume suggests institutional interest, which could be driving demand for stable, commodity-backed crypto assets amid broader market swings.
As investors seek low-risk, high-reliability crypto assets, PAXGUSDT is emerging as a preferred choice due to its gold backing and consistent performance. It provides a strong alternative for both traders and long-term holders who want crypto exposure without the extreme volatility seen in other altcoins. The alignment of both technicals and fundamentals reinforces the bullish case for PAXG.
Overall, with a solid foundation, bullish momentum, and growing adoption in both traditional and digital finance spaces, PAXGUSDT is positioned to deliver steady gains. It’s one of the most reliable plays in the current market structure, offering a safe entry for conservative crypto investors.
✅ Show your support by hitting the like button and
✅ Leaving a comment below! (What is You opinion about this Coin)
Your feedback and engagement keep me inspired to share more insightful market analysis with you!

Ethereum (ETH/USDT) Breakout Watch ! Hello traders here is KingPro's analysis on Ethereum
📈ETH is at the critical resistance level strong closing above it could tiger a bullish move.
Current Price: $2,628
EMA 70 Support: Price is holding above the 70-period EMA ($2,577), showing bullish structure.
Support Zone: The area around $2,320–$2,400 is acting as a strong historical support, confirmed multiple times.
Supply Zone: Consolidation occurred near $2,570–$2,620, but price has broken above it — indicating accumulation.
Critical Resistance Area: Around $2,780–$2,800. This is a key level — a breakout above could lead to strong bullish continuation.
Next Target: $2,782.93 – price may retest this resistance as indicated by the projection arrow.
📊 Trade Idea:
If ETH sustains above $2,620 and breaks the short-term channel resistance, a move toward $2,782+ is likely.
🔒 Risk: A breakdown below the EMA or the supply zone (~$2,570) could invalidate the setup.

BTC Short-term selling pressure due to war news💎 BTC PLAN UPDATE (June 13)
NOTABLE NEWS ABOUT BTC:
Prices of Bitcoin (BTC), Ethereum (ETH), and Ripple (XRP) slipped as rising geopolitical tensions between Israel and Iran sparked a wave of risk aversion across crypto markets. As uncertainty deepens, the three largest cryptocurrencies by market capitalization are on track to close the week in the red, with current price action signaling the potential for a deeper correction.
Bitcoin bears regain control
After failing to reclaim its all-time high of $111,980 earlier in the week, Bitcoin lost upward momentum and began a steady pullback, slipping below key support at $106,406 on Thursday. As of Friday, BTC continues its downward trajectory, hovering near the 50-day Exponential Moving Average (EMA) at $102,447.
TECHNICAL ANALYSIS PERSPECTIVE:
We successfully identified the peak at the 110K resistance level. As predicted, BTC dropped $7,000 following disappointing CPI and PPI reports. Currently, the price has fallen back into a descending channel pattern and is expected to decline further.
Bitcoin’s upward trend is under threat as funding rates become more constrained.
Earlier this week, Bitcoin hovered near its all-time high of $111,980, but market sentiment remained alarmingly cautious—likely due to uncertainty in the macroeconomic environment.
The path of least resistance is gradually shifting downward, especially as the Relative Strength Index (RSI) falls to the midline at 50 from a recent high of 64 on the daily chart. Traders will look for bearish confirmation signals from the Moving Average Convergence Divergence (MACD) indicator—signaled when the blue MACD line crosses below the red signal line.
Watch for long positions around the 100K price area, with a target back to 103K. If the price breaks below the 100K support level, we should avoid holding onto a bullish bias.
At this time, whether you’re a newcomer or experienced trader, it’s advisable to spend time practicing and reinforcing technical analysis knowledge. Explore educational posts on the channel to build a stronger foundation and avoid potential losses.
==> This analysis is for reference only. Wishing all investors successful trades!
50x leverage no brainer short trade (easy profits)
Keep in mind:
With a big daily bearish engulfing candlestick we are most likely to continue the downtrend for the coming days. Looking at the RSI (daily timeframe) it is clear that we now are in a downtrend from previously being in overbought territory. We are most likely to go from overbought to oversold on the RSI and are now looking for a big downward movement! The MACD is showing weakness on the buy signal it has printed on the daily timeframe and is showing a strong sell signal on the 4 hourly timeframe.
Most important information:
Price action is the most important information you can get and trading on price action is what the pros do!
What we can see is that the price of BTC now is inside a strong key resistance area. Combining this with the huge rising wedge we are most likely to fall back down to the 75k area. Keep in mind that we didn’t really get a good backtest of the 69k-75k support zone so we could be looking to make a good backtest of this zone before continuing the macro uptrend.
I can also identify a failed bullish ascending triangle followed by a trend with lower highs. When the second lower high formed on the hourly I entered the 50x leverage trade at 108528,7 and placed the stop loss above that lower high. Keep in mind that the trend is your friend and that we most likely wont hit the SL. At least not before moving the SL into the profit zone (preferably above a lower high that will form). I have currently put my TP at 75950 (a long way down) because I want to ride this short as long as I possibly can. I also think that we are most likely to keep consolidating (until proven otherwise) between the given ranges (from 69k all the way up to 112k).
What about the news?
I think what president Trump does is the most important news we have to consider while trading. At the time of writing it is still unclear if the Musk VS Trump drama will continue. Bringing negativity into the market. The latest trade agreement with China was also not in favor of the United States (The relation between the two countries can strengthen but at a core financial view this ain’t good). Trump also kind of acted like a dictator in the Los Angeles event (this could bring negative energy into the markets). All in all I think that the news is a bit unstable and this strengthens the hypothesis that the price of BTC will consolidate until better times is around.
Conclusion:
I can always be wrong with either my complete analysis or parts of it. But I think that we at least is going to see a 1,65% move to the downside from my entry point. This move is extrapolated from the failed ascending triangle and seeing this move will give me the opportunity to make the trade risk free (I will keep you updated when this happens)!

BTC/USDTDo you think Bitcoin has just formed a double top, or is it showing a different pattern? Personally, I think we might range a bit from here and then possibly continue the uptrend. I'm not really into pattern trading—so you tell me, are we bullish or bearish?"

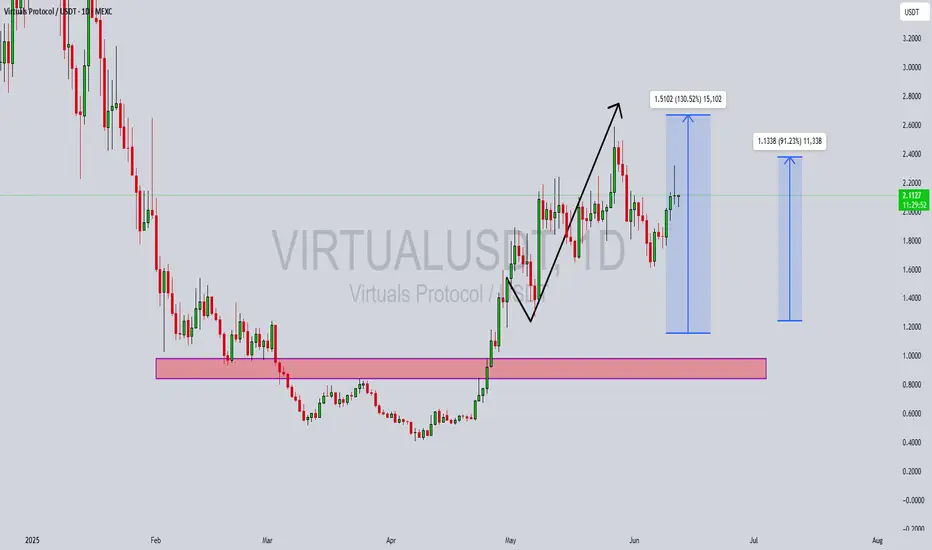
VIRTUALUSDT Forming BullishVIRTUALUSDT is showcasing a powerful bullish structure after a prolonged accumulation phase near the $0.80 to $1.00 support zone. The breakout from this accumulation base has resulted in a parabolic move, confirming a strong shift in trend. Currently, the pair is forming a bullish continuation pattern, with high volume inflows suggesting increasing investor confidence. The recent consolidation above previous resistance is a positive signal for trend continuation, and technical targets show potential for a 120% to 130% upside in the coming sessions.
The setup aligns with classic market psychology, where a strong move is often followed by a period of profit-taking before the next leg higher. The technical projection zones around $2.60 to $3.00 are realistic based on the depth of the prior impulse move. Furthermore, VIRTUALUSDT is gaining traction in the DeFi and virtual asset space, with its protocol generating buzz in 2025's altcoin resurgence. This combination of narrative and chart structure makes it a potential top mover.
From a risk-reward perspective, this pair presents a favorable long entry with minimal downside if stop losses are positioned just below recent swing lows. As the broader market recovers, strong technicals like these could deliver amplified gains compared to average tokens. It's worth noting that smart money often positions itself before explosive runs—and this chart suggests accumulation has already occurred.
Investors and swing traders should keep this pair on their radar as it continues to carve higher highs and higher lows. If momentum persists, VIRTUALUSDT could become one of the standout performers in the altcoin space this quarter.
✅ Show your support by hitting the like button and
✅ Leaving a comment below! (What is You opinion about this Coin)
Your feedback and engagement keep me inspired to share more insightful market analysis with you!
ASRUSDT Forming Falling WedgeASRUSDT is gaining strong bullish traction after a successful breakout from a falling wedge pattern. This setup is widely recognized in technical analysis as a bullish reversal structure, and the breakout here is backed by consistent price action above the key resistance zone highlighted in red. ASR has now flipped this zone into support, and the trendline structure suggests a continuation move is underway.
The recent candles are forming a clear uptrend, and the momentum is being supported by healthy volume flow, indicating that accumulation might be happening behind the scenes. With the breakout fully confirmed, a potential 40% to 50% upside move is projected based on the measured target approach, aligning with price ranges between $2.5 and above. Traders should watch for continuation patterns or bull flags as the uptrend evolves.
The ASR token is part of a growing fan-token economy that has started to attract fresh attention in 2025. As investor interest increases, demand for utility-driven and fan-based tokens could fuel further upside. This positions ASR as a strong candidate for both speculative and long-term plays. If the broader altcoin market continues to move positively, ASR could outperform thanks to both technical strength and thematic interest.
With its current setup, ASRUSDT looks set to rally further and may present a compelling opportunity for traders who position early. Keep an eye on pullbacks to key support levels as potential re-entry zones if missed on the initial breakout.
✅ Show your support by hitting the like button and
✅ Leaving a comment below! (What is You opinion about this Coin)
Your feedback and engagement keep me inspired to share more insightful market analysis with you!
