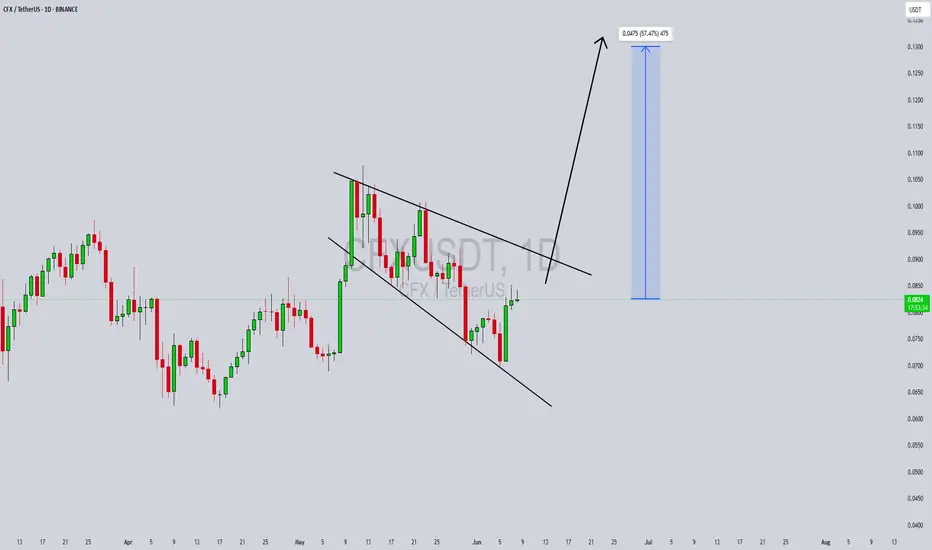
CFXUSDT Forming Falling WedgeCFXUSDT is showing signs of a strong bullish continuation as it emerges from a falling wedge pattern — a setup often considered a reliable reversal signal in technical analysis. As depicted in the chart, the price has been compressing within the wedge, gradually forming higher lows and now attempting a breakout from the resistance trendline. The recent green candles and growing volume suggest bulls are taking control, setting the stage for an upside move. With momentum building, traders could be looking at a potential 40% to 50% surge if the breakout sustains.
Conflux (CFX) has been gaining attention due to its unique position as a high-throughput, scalable blockchain that facilitates cross-border data and value transfer, particularly between China and the global crypto community. As regulatory clarity improves and Conflux continues to expand its ecosystem through partnerships and integrations, market sentiment has shifted in favor of the project. This renewed investor confidence is visible in the technical structure forming on the CFXUSDT chart, as smart money begins to accumulate.
The breakout target aligns with a previous high, indicating that this could be more than just a short-term rally. If volume continues to support the price action, CFX could rally toward the $0.12–$0.13 zone, which marks a critical resistance area. This creates a favorable risk-reward environment for both swing traders and position holders eyeing medium-term gains. Technical traders should watch for confirmation above the wedge and continuation candles backed by volume to validate the move.
Overall, CFXUSDT looks primed for a strong upward movement, supported by bullish technicals and increasing investor interest in the Conflux network. As the project remains fundamentally strong and gains traction in the Web3 space, this may be an opportunity to capitalize on a promising mid-cap altcoin.
✅ Show your support by hitting the like button and
✅ Leaving a comment below! (What is You opinion about this Coin)
Your feedback and engagement keep me inspired to share more insightful market analysis with you!
Btcusdanalysis
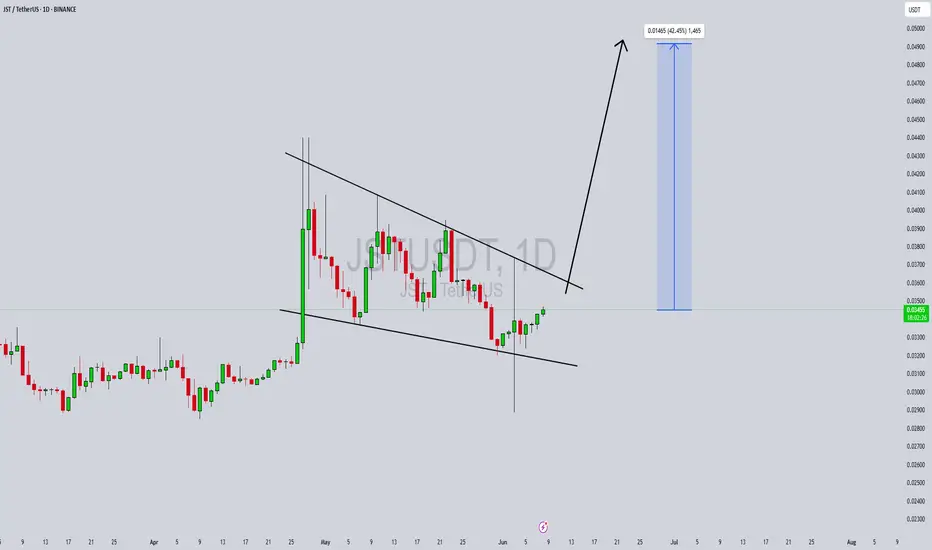
JSTUSDT Forming Bullish WaveJSTUSDT is exhibiting a classic bullish wave pattern, signaling the potential for a trend reversal and a significant upward price movement. Recent price action suggests a solid base has been formed, with higher lows indicating growing buying pressure. As volume picks up, this adds weight to the bullish setup, and momentum indicators are aligning with a possible breakout. Traders and investors are beginning to take interest in JST due to both its technical positioning and the increasing engagement around the Just Network ecosystem.
Just (JST), a DeFi platform built on the TRON network, continues to gain traction for its lending, stablecoin, and yield farming features. This utility, combined with its integration across various TRON-based applications, has helped the project build a consistent user base. As DeFi projects regain attention in the broader crypto market, JST stands out with its established infrastructure and increasing usage metrics. These fundamentals support the potential for a 30% to 40% gain in the near term, especially if market sentiment stays bullish.
Technically, JSTUSDT is moving within a bullish wave formation, suggesting impulsive buying followed by controlled retracements. This pattern typically leads to further upward movement, particularly when supported by increasing trading volume. If price manages to break key resistance levels and hold above them, the next targets could be quickly achieved, offering traders attractive risk-reward opportunities.
In conclusion, JSTUSDT is setting up for a potential rally driven by a combination of bullish technicals and strong project fundamentals. As the DeFi narrative strengthens again, JST could see renewed momentum, especially if broader market conditions remain favorable. Keeping an eye on volume surges and breakout confirmations could offer timely entries for both short-term and mid-term strategies.
✅ Show your support by hitting the like button and
✅ Leaving a comment below! (What is You opinion about this Coin)
Your feedback and engagement keep me inspired to share more insightful market analysis with you!
Pay close attention to LMACD in the weekly!Once we cross LMACD in the weekly it would be dangerous to stay in. Make sure to take some profits once we are getting close to October and before LMACD crosses to the downside

Last 133 days of the bull market!This idea gives more details about the pint in the cycle we are at right now. When measuring the duration between halving and tops we usually see the best in ~500 days after the halving. Following my previous idea about topping in October you can find the same pattern translating in 546 days after last halving. If this proves right , we are about 133 days before top. At this point we should see fireworks till October. In blue is price action in those 133 in 2017 and in yellow 2021, according to the btc nature of diminishing returns we should see peaks bellow those years.Cheers

Trend Base Fib Time suggesting getting out before October 2025!I have been warning you that time is running and a few months left before things start cooling off. This tool is trend base fib time , measured from one halving till the next one. I assumed halving in 2028 at some point in march so this result in a target of October to be the month matching with the 0.382 when peaks use to be found. The 0.618 would be the one for catching the bottoms around Sep 2026. Secure some gains and buy back at next bear market lows close to 40k. Cheers
Technical analysis of BTC contracts (outlook for next week)Technical analysis of BTC contract on June 7 (next week outlook):
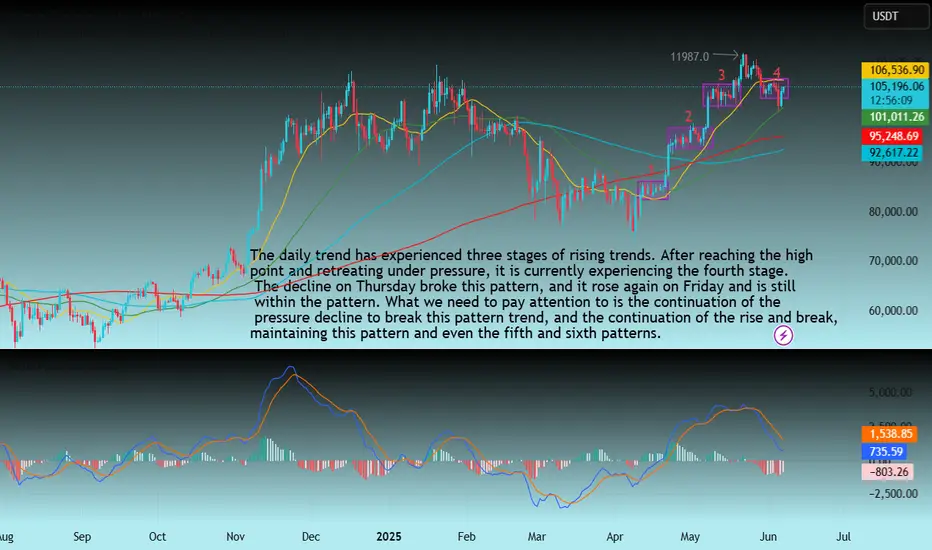
The weekly trend, after the price hit the high point of 112000 area, it retreated under pressure. The current K-line pattern is negative, but the price is still at a high level, which also exacerbates the overall trend of volatility. The daily price was fluctuating downward before Friday. The impact of yesterday's data caused the price to rise, which seemed to break this trend, and it also became contradictory. The technical indicators of the four-hour chart and the hourly chart changed very quickly, and there was no reference signal for the medium and long term; in general, the current trend will continue the oscillating pattern, with the upper pressure position in the 107000 area and the low point support position in the 100600 area;
The Unraveling of an Empire: How Bitcoin Could Break the DollarFor decades, the U.S. dollar has reigned supreme, an undisputed king in the global financial arena. It is the world's primary reserve currency, the bedrock of international trade, and the safe-haven asset investors flock to in times of turmoil. This dominance has afforded the United States what has been called an "exorbitant privilege," allowing it to borrow cheaply and exert significant influence over the world economy. But the ground beneath this financial empire is beginning to shift. A confluence of mounting debt, shifting geopolitical sands, and the rise of a revolutionary technology is creating the conditions for a challenger to emerge. That challenger is Bitcoin.
Born from the ashes of the 2008 financial crisis, Bitcoin represents a radical departure from the centrally controlled monetary systems that have governed economies for centuries. It is a decentralized, digital currency, free from the whims of governments and central banks. While initially dismissed as a niche interest for tech enthusiasts and a tool for illicit activities, Bitcoin has steadily gained traction, evolving into a trillion-dollar asset class that is now capturing the attention of institutional investors, corporations, and even nation-states. The question is no longer whether Bitcoin is a fleeting fad, but whether it possesses the power to fundamentally disrupt, and perhaps even break, the long-standing hegemony of the U.S. dollar.
A Hedge Against a Failing System
One of the most compelling arguments for Bitcoin's ascendancy lies in its inherent properties as a store of value, particularly in an era of unprecedented monetary expansion and soaring national debt. Unlike the U.S. dollar, which can be printed at will by the Federal Reserve, Bitcoin has a finite supply capped at 21 million coins. This predictable scarcity is a powerful antidote to the inflationary pressures that erode the purchasing power of fiat currencies. As governments around the world, and particularly the United States, continue to accumulate staggering levels of debt, the temptation to devalue their currencies through inflation grows. The U.S. national debt, now standing at tens of trillions of dollars, raises serious questions about the long-term sustainability of the dollar's value. In this environment, Bitcoin's unalterable monetary policy makes it an increasingly attractive safe haven for those seeking to preserve their wealth.
The trend of "de-dollarization" is already underway, with several countries actively seeking to reduce their reliance on the U.S. dollar in international trade and reserves. Geopolitical rivals like China and Russia have been at the forefront of this movement, but even traditional allies are beginning to explore alternatives. The weaponization of the dollar through sanctions has further accelerated this trend, prompting nations to seek financial systems that are not subject to the political whims of a single country. Bitcoin, being a politically neutral and borderless currency, offers a compelling solution. It allows for direct, peer-to-peer transactions across the globe without the need for intermediaries, thereby circumventing the traditional, dollar-dominated financial system.
The Rise of a New Reserve Asset
The ultimate test of a global currency is its acceptance as a reserve asset by central banks. While this may have seemed like a far-fetched idea just a few years ago, it is now a topic of serious discussion in financial circles. A handful of nations have already taken the pioneering step of adding Bitcoin to their reserves, signaling a potential paradigm shift in how countries manage their sovereign wealth. For central banks, the appeal of Bitcoin lies in its potential for diversification. By holding an asset that is not correlated with traditional stocks and bonds, they can better hedge against various economic and geopolitical risks. As more central banks begin to explore this option, even a small allocation to Bitcoin could have a significant impact on its price and legitimacy.
The development of a robust financial ecosystem around Bitcoin is also paving the way for its broader adoption. The emergence of regulated exchanges, custody solutions, and investment products has made it easier for institutions to gain exposure to the asset class. This growing infrastructure is crucial for building the trust and liquidity necessary for Bitcoin to function on a global scale.
The Hurdles on the Path to Dominance
Despite its disruptive potential, Bitcoin faces a number of significant challenges that could hinder its ability to supplant the dollar. The most frequently cited concern is its price volatility. Wild swings in value make it a difficult medium of exchange for everyday transactions and a risky asset for conservative central banks to hold in large quantities. While volatility may decrease as the market matures, it remains a major obstacle to widespread adoption.
Scalability is another critical issue. The Bitcoin network can currently only process a limited number of transactions per second, making it unsuitable for the high volume of payments required of a global currency. While second-layer solutions are being developed to address this, they have yet to be proven at a massive scale.
Furthermore, the regulatory landscape for cryptocurrencies is still in its infancy. Governments around the world are grappling with how to approach this new technology, and the lack of clear and consistent regulations creates uncertainty for investors and businesses. The U.S. government, in particular, is unlikely to cede its monetary authority without a fight, and could impose stringent regulations that stifle Bitcoin's growth.
Finally, no currency in history has achieved global dominance without the backing of a major economic and military power. The U.S. dollar's reign is underpinned by the strength of the American economy and its military might. Bitcoin, by its very nature, is decentralized and lacks the support of any single nation-state. This could be both a strength and a weakness. While it provides neutrality, it also means that there is no central authority to backstop the currency in times of crisis.
A New Financial Order
The notion that Bitcoin could completely break the U.S. dollar and become the sole global reserve currency in the near future remains a speculative one. The dollar's incumbency advantages are formidable, and the challenges facing Bitcoin are substantial. However, to dismiss the potential for a seismic shift in the global financial order would be to ignore the powerful forces at play.
What is more likely than a complete replacement is a gradual transition to a more multipolar currency world, where Bitcoin coexists alongside the dollar, the euro, and other major currencies. In this scenario, Bitcoin could serve as a neutral reserve asset, a check on the inflationary tendencies of fiat currencies, and a parallel financial system for those who are excluded from or wish to opt out of the traditional one.
The rise of Bitcoin is a clear signal that the world is yearning for a more resilient, equitable, and decentralized financial system. Whether it ultimately breaks the dollar or simply forces it to become more disciplined, one thing is certain: the future of money will look very different from its past. The quiet revolution that began with a single whitepaper is now a global movement, and the foundations of the old financial empire are beginning to tremble.

RSI suggesting a bear market comingThis is BTC and it's RSI. Bellow you can see LMACD applied on the RSI indicator to see the trend more clearly. We might be on the stage that we can see higher prices like in 2021, but the bear trend is already printed. Sell some now and buy back at 40k next year. Cheers

FLOKIUSDT Forming Bullish waveFLOKIUSDT is currently showcasing a strong bullish setup, supported by growing volume and technical confirmation. The recent price movement indicates accumulation at key support levels, followed by a tightening range that often precedes a significant breakout. This structure suggests high probability for a powerful upward move, aligning with the projected 80% to 90% gain. With market sentiment turning positive around meme tokens and community-driven coins, FLOKI is positioned for potential explosive growth.
The FLOKI project continues to capture attention across crypto communities due to its expanding ecosystem, including FlokiFi, NFT integrations, and utility within the DeFi space. This has helped build confidence among investors, especially as FLOKI has transitioned from a meme coin narrative to one with real-world use cases. As volume builds around this consolidation, technical traders may interpret this as a bullish continuation pattern, setting the stage for aggressive price expansion.
Technically, FLOKIUSDT is attempting a breakout from a downward channel, with recent candles showing strong rejection of lower prices and momentum starting to shift upward. Once this breakout is confirmed with sustained volume, the rally could accelerate quickly, as price targets move into the 0.000015–0.000016 range. This aligns with the 80–90% gain expectation highlighted on the chart, providing a favorable setup for swing and position traders alike.
Overall, FLOKIUSDT offers a compelling combination of bullish technicals, increasing investor interest, and narrative momentum. It’s a chart worth watching closely for breakout confirmation, especially for those looking to capitalize on mid-cap altcoin volatility during this phase of the market cycle.
✅ Show your support by hitting the like button and
✅ Leaving a comment below! (What is You opinion about this Coin)
Your feedback and engagement keep me inspired to share more insightful market analysis with you!

EDUUSDT Forming Descending TriangleEDUUSDT has recently broken out of a descending triangle pattern on the daily timeframe, which is typically a bullish signal when confirmed with volume. The breakout has occurred with notable strength and solid green candle momentum, indicating a potential trend reversal and the beginning of a strong upward move. With price currently trading near $0.1499, this technical breakout opens the door for a projected gain of 60% to 70%+ in the coming days or weeks.
EDU, the native token of the Open Campus project, is gaining attention as the Web3 education narrative grows stronger. As traditional sectors like education integrate blockchain, EDU stands out as a project with real-world utility and adoption potential. The fundamentals are aligning well with the technical picture, and the increased investor interest is starting to reflect in both volume spikes and social media chatter.
If EDUUSDT maintains support above the breakout trendline, traders could see a continuation toward the $0.25 to $0.27 region — aligning with the chart projection of nearly 80% upside. This setup is further supported by increasing market sentiment, and EDU’s strategic partnerships in the education sector make this move fundamentally sound.
This is a high-potential setup for traders looking to ride breakout momentum in trending altcoins. EDU is not just riding the wave of hype but is backed by utility, strong technical structure, and market interest — making it a standout in the current altcoin rotation.
✅ Show your support by hitting the like button and
✅ Leaving a comment below! (What is You opinion about this Coin)
Your feedback and engagement keep me inspired to share more insightful market analysis with you!

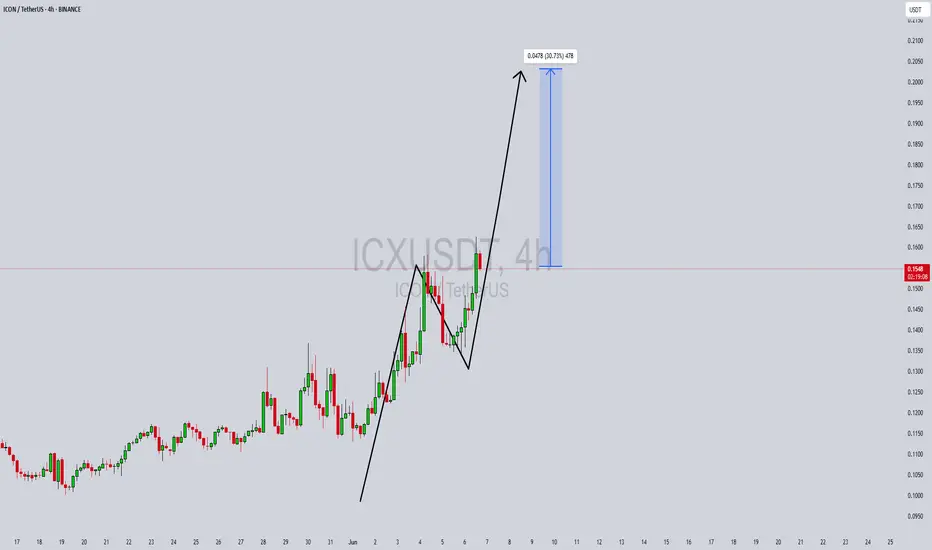
ICXUSDT Forming Bullish impulseICXUSDT has recently shown a strong bullish impulse, followed by a healthy pullback forming a classic bull flag or V-shaped recovery pattern. This setup often signals continuation of the uptrend, especially when supported by solid trading volume, as seen in the recent sessions. The consolidation and subsequent breakout reflect growing investor confidence, making ICX an attractive short-term trading opportunity with an expected gain of 20% to 30%+.
ICON (ICX) is one of the older blockchain projects that has managed to maintain its relevance through consistent updates and ecosystem expansion. As the altcoin market shows signs of revival, mid-cap coins like ICX are starting to attract attention from both retail and institutional traders. The recent price action confirms that ICX is gaining traction, with the breakout targeting a significant resistance zone in the $0.19-$0.21 range.
Traders looking for momentum plays should watch ICXUSDT closely. If the price sustains above the $0.1550 breakout level with increasing volume, it could mark the beginning of a new leg upward. Additionally, the current structure on the 4H chart is providing clean technical entries with tight risk, making this trade setup highly favorable for swing and day traders.
This move is backed by both technical pattern recognition and on-chain interest metrics, which hint at potential accumulation. With sentiment improving and key resistance levels within reach, ICX could deliver a rapid upside move in the coming days.
✅ Show your support by hitting the like button and
✅ Leaving a comment below! (What is You opinion about this Coin)
Your feedback and engagement keep me inspired to share more insightful market analysis with you!
Crypto bull market might be ending pretty soonI am warning you that we might seeing the last days of the bull market. SO FAR histogram is printing the first red candle(we need to verify once June ends). Look what happened with btc once LMACD crossed above 0. Winter is coming.

Bitcoin Prediction - WARNING - Short Set-up Looming? We are spectating something serious on Bitcoin looming right now! Confirmations explained in the video!

₿ BTC: Delay Tactics in Wave B Bitcoin dropped hard yesterday, throwing a wrench into the expected climb toward the top of green wave B. This bounce was supposed to stretch into the upper blue Target Zone between $117,553 and $130,891, which we flagged as a smart area to take partial profits or layer in short hedges. That zone still stands—BTC just isn’t ready to hit it yet. The current pullback suggests we’ll see more sideways-to-lower price action before green wave B wraps up. Once it does, green wave C should drag Bitcoin into the lower blue Target Zone between $62,395 and $51,323. That’s where we’re looking for orange wave a to complete. After that, a countertrend rally in wave b could pop up—before wave c wraps the entire corrective cycle and finishes blue wave (ii). We’re also watching an alt.(i) breakout scenario (30% probability). In that case, BTC would blow through the $130,891 level early, bypassing the expected dip and reaching new highs faster than projected.
📈 Over 190 precise analyses, clear entry points, and defined Target Zones - that's what we do.

BTC-----Sell around 104000, target 102000 areaTechnical analysis of BTC contract on June 6:
Today, the large-cycle daily level closed with a big negative line yesterday, the K-line pattern continued to fall, the price was below the moving average, and the attached indicator was dead cross. The large trend of falling again appeared to be advantageous. The price continued to break the previous low position, and the upward stage trend was also broken, so the market outlook will also fluctuate downward; the short-cycle hourly chart of the US market fell sharply, and the low point touched the 100300 area. The price supported the rebound in the morning. The current K-line pattern continued to rise, and the attached indicator was golden cross, but the price was already close to the moving average resistance of the four-hour chart. Today, the decline continued to break the low, and the rebound strength could not be large. This is a rule.
BTC short-term contract trading strategy:
Sell at the 104000 area, stop loss at the 104500 area, and target the 102000 area;

2️⃣ Who's Next? Or: Operation: "Saving Private Saylor2️⃣ Who's Next? Or: Operation: "Saving Private Saylor"
❗️ Disclaimer: This idea is only a part of an article with a forecast for Bitcoin and the cryptocurrency market for 2025-2028. To fully and completely understand what is being discussed here, please refer to the root idea via the link:
1️⃣ Main Idea: Analysis of US Treasury Documents
📰 Forbes: Your Cover – Our Margin Call. Saylor, Get Ready!
You've heard it, haven't you? Those stories about Forbes covers and the subsequent fall of crypto empires? It's no longer a superstition; it's, damn it, statistics:
Changpeng Zhao (CZ), Forbes, February 2018: "Binance's Crypto King!" – the headlines screamed. And what then? He served four months in prison. Well, not immediately, of course, but the "seed" of the curse was sown.
Sam Bankman-Fried (SBF), Forbes, October 2021: "The New Warren Buffett of Crypto!" – the fanfares shrieked. And what was the result? He's sitting pretty now, enjoying prison romance.
And now, our incomparable Michael Saylor enters the stage! Forbes puts him on the cover in January 2025 "Michael Saylor: The Bitcoin Alchemist"!
Why a Forbes cover is not glory but a warning for Michael Saylor (and a signal for the US government): This is not just a coincidence; it's a systemic pattern. Forbes, whether out of naivety or, conversely, subtle calculation, acts as an unwitting harbinger. They choose those who are at the peak of hype, those who have "believed in themselves" and are ready to tell the whole world about their "brilliant" strategy. And the peak of hype, as we know, is the beginning of a fall. And this is where it gets interesting. The US government, which carefully reads such magazines (after all, they write about "financial stability" and "national interests" there), sees Michael Saylor on the cover and thinks: 💭 "Well, well, this guy has accumulated half a million Bitcoins. And he's currently at the peak of self-admiration. Excellent! Get ready for 'Operation: Coercion to Stability'!"
❌ Why this cover for Saylor is not just a photoshoot, but a "liquidation marker" for the US government:
"The Forbes Curse" as a "Market Overheat" Indicator: For our financial strategists from the Treasury and the Fed, Saylor's appearance on the cover is not just a signal of "overheating"; it's a green light for activating the "Crypto-Reserve" plan. They see: "Oh, this guy got too relaxed. He has too much 'digital gold' at an average price of $74,000. And we love to buy at a discount, especially if the discount can be 'arranged'!"
Recession and Crash as "Natural Selection": Remember that TBAC in its documents constantly reminds us of Bitcoin's "volatility" and the "necessity of hedging." The perfect storm for Saylor is an "unexpected" recession in the US and a sharp stock market crash. At this moment, Bitcoin, which has always historically behaved as a "high-beta" asset (DA&TM, p. 5), will fall even faster. When BTC is in the range of $30,000 - $40,000, this will not just be a "loss" for Micro Strategy – it will be absolute financial hell for their leveraged positions, which they so "cleverly" accumulated.
Margin Calls: Music to Regulators' Ears: Saylor's average purchase price of $74,000, and Bitcoin has fallen to $30-40k? This is not just "oh, we're in the red" . These are massive margin calls and the threat of liquidation of MarginCallStrategy MicroStrategy's positions, which mortgaged its shares and Bitcoin itself to buy even more Bitcoin. The banks holding them as collateral (and which are, of course, "friendly" with the Fed) will start to get nervous. And then, as if by magic, the "saving hand" of the government will appear.
"Humanitarian Aid" (at a Bitcoin price of $30-40k.): They won't come waving checkbooks to buy Bitcoin for $100,000. They will come when Saylor is on the verge of collapse, and they will say: 💬 "Michael, we see your pain. To avoid 'systemic risk' and 'protect investors' (who are in your fund because you bought so much Bitcoin), we are ready to 'help'. We will 'acquire' your Bitcoin at a 'fair' price (which, of course, will be significantly lower than Saylor's purchase price) to 'stabilize' the situation. Naturally, this is not a purchase, but 'crisis prevention'."
Bitcoin in the "Crypto-Reserve": Mission Accomplished! Thus, the government, without directly buying a "speculative asset," will receive half a million BTC at a "bargain" price, using market crashes and financial pressure. And then they will be able to proudly declare: "We have 'digital gold' that will protect our financial system from external shocks. And yes, it is now in our hands, not some 'Alchemist's'."
✖️ The Forbes Curse: When a Magazine Becomes a Catapult for Crypto-Kings
The cover of Forbes magazine is not just paper and ink; it's the financial equivalent of an "X" on your back, appearing exactly when "Big Brother" decides you've gotten too big for your "digital gold" britches. Let's recall the chronicles of this "curse" to understand what awaits our Michael Saylor:
1. CZ (Changpeng Zhao), Binance:
▫️ Forbes Cover: Feb. 2018. Headlines trumpeted "crypto-king."
▫️ BTC Price: $11,500. The entire crypto-brotherhood rejoiced, thinking the moon-run was endless.
▫️ What happened next: By the end of 2018, Bitcoin plummeted to $3,000. A -73% drop. And Changpeng, after several years of legal battles, eventually ended up behind bars for 4 months.
2. SBF (Sam Bankman-Fried), FTX:
▫️ Forbes Cover: Oct. 2021. "The Billionaire Saving the Crypto World!" indeed.
▫️ BTC Price at the time: Around $60,000. The market was at its peak; everyone was talking about $100k, "diamond hands," and a "new financial era."
▫️ What happened next: A year later, by the end of 2022, Bitcoin was already around $16,000. A -75% drop. And Sam? Sam is enjoying government cuisine and the company of cellmates, sentenced to 25 years (but according to recent data, the term may be reduced by 4 years).
3. Michael Saylor, Micro Strategy:
▫️ Forbes Cover: Jan. 2025. Our "Alchemist" Michael, with brilliance and faith in his eyes, has concocted somewhere around half a million bitcoins and has finally received this "honor."
▫️ BTC Price: As of today, around $100k. Imagine the hype! Saylor tells everyone that "we've only just begun," that Bitcoin is "financial sovereignty" and "the future of humanity," whose price is about to fly to $500k without you! Buy now, don't miss out!
▫️ What will happen next (according to the "Big Brother" scenario): If history is not just a collection of boring dates, but a cyclical performance with notes of tragicomedy, then the following awaits us. A year after the Forbes cover, by early 2026, the price of Bitcoin in this scenario could plummet by -70% from its ATH. This means Bitcoin would be in the range of $30-40k. dollars. And what about Michael? I don't want to jinx it, but if CZ served four months, Sam will likely serve 4 years, then how long will our BTC-prophet and "crypto-Moses" get? Forty?
In conclusion: The Forbes curse is not magic; it's a harbinger of a systemic blow. So, when you see another crypto-hero on the cover of Forbes, don't rush to rejoice for him. Most likely, it's the last call before the "system" begins its complex, multi-step plan for "coercion to cooperation."
So, let's dream. No, not about flights to Mars, but about much more down-to-earth, but far more probable scenarios, where Washington finally gets its hands on "digital gold." After all, as stated in DA&TM, Bitcoin is "a store of value, aka 'digital gold' in the decentralized world of DeFi" . Well, since it's "gold," it should be in our "gold reserve," right? But to buy it directly? Oh no, that's a "speculative asset," it's "volatile" ! But "acquiring" it at a discount – that's a whole different song.
📝 The "Digital Couping" Scenario (or how to take Bitcoin without buying it on the open market):
◻️ Phase 1: Deflation of the US Stock Market Bubble
▫️ "Recession? Stock market crash? Perfect time for 'healing'!" The government and banksters will always find a way to "help" the market. If the American economy, as many are whispering now, faces a serious recession, and the stock market tumbles, then Bitcoin, as a "high-beta" asset, may well follow suit. Remember how Bitcoin reacted to "crashes" in 2017, 2021, 2022 (DA&TM, p. 5, chart). If Michael Saylor's average purchase price is $74,000 today, then a drop into the $30,000 - $50,000 range is not just a "correction"; it will be an absolute financial hell for his margin positions, which he so "cleverly" accumulated.
▫️ Margin-call for Micro Strategy. Michael Saylor didn't just buy Bitcoin; he bought it with borrowed funds, collateralizing his shares and even Bitcoin itself. In the event of a deep market downturn and, consequently, a fall in BTC's price, Micro Strategy will face serious problems servicing its debt and maintaining collateral. The banks that issued them loans (and these are, most likely, banks very "friendly" to the government) will start to get nervous. And then the most interesting part will begin.
◻️ Phase 2: "Operation: Buyout"
▫️ "An offer you can't refuse." When Micro Strategy is on the verge of default or bankruptcy due to its Bitcoin positions, "saviors" will appear on the scene – perhaps some specially created "Digital Asset Stability Fund" or even directly "government-friendly" large financial institutions that have received a "green light" and, possibly, even funding from the Fed (naturally "to ensure financial stability").
▫️ "We are not buying; we are 'stabilizing'!" They won't say: "We are buying Bitcoin." They will say: 💬 "We are preventing systemic risk! We are providing liquidity to the market during a crisis, buying back their 'high-beta' asset at a 'fair' price (which, of course, will be significantly lower than Saylor's purchase price)." And this is where the "digital gold" narrative, which has already permeated even official documents (DA&TM, p. 2), will come into play. "It's gold, and gold should be in the state reserve, shouldn't it? "
◻️ Phase 3: Nationalization of 'Digital Gold' and control over the narrative
▫️ "Congratulations, Michael, you've become a 'pioneer'!" After most of Saylor's Bitcoins are "saved," they will end up in the hands of, say, a "special depository" or a "strategic digital asset reserve." At the same time, the government will not "own" them in the traditional sense, but will "manage" them for "national interests."
▫️ "Now we have 'digital gold,' and it will work for us!" With this significant reserve of Bitcoins (576k "taken" from Saylor + 200k "confiscated" Bitcoins earlier – that's no joke), the US government suddenly becomes the largest sovereign holder of an asset that they will now officially recognize as "digital gold." This will allow them to:
▫️ Influence the market: If necessary, they will be able to use this "crypto-reserve" to "stabilize" prices, intervening in the market (for example, by selling small portions to curb too much growth, or conversely, by buying if the market falls sharply, but through their affiliated structures).
▫️ Legitimize "digital gold": If the US government has a Bitcoin reserve, then it's no longer "speculative nonsense," but part of the official financial system. This will open doors for broader institutional adoption, but on their terms.
▫️ Pump capitalization through stablecoins for national debt: A crucial strategic step will be to use this new "digital gold standard" to address the growing national debt. By aggressively legitimizing Bitcoin as "digital gold" and creating controlled mechanisms for its storage and trading (e.g., through regulated ETFs and tokenized assets), the US government will create a powerful incentive for capital inflow. In parallel, by strengthening regulation and encouraging the growth of fiat-backed stablecoins, collateralized by short-term US Treasury bonds (T-Bills), a colossal "cushion" of demand for US national debt will be created. The larger the capitalization of stablecoins, the greater the need for T-Bills to back them. The goal is to first build up a large BTC reserve, then, by boosting stablecoin capitalization, inflate the overall crypto market capitalization and the price of Bitcoin itself, to ultimately create a new powerful tool for "monetizing" or, at least, facilitating the servicing of US national debt. This will look like a brilliant financial maneuver, turning "wild" cryptocurrency into a tool for strengthening US financial stability and national security.
◽️ A rescue that looks like a robbery. So the scenario is not that the US government will "pump" Bitcoin by buying it expensively; the scenario is that they will create conditions and wait for the market to "drown" the most ambitious hodlers, and then come to the rescue to "save" their assets. And this "help" will look like the acquisition of a strategic asset at a bargain price, using existing market pressure mechanisms and crisis phenomena. This is a classic "good cop, bad cop" game, where the "bad cop" is an "unexpected" market recession, and the "good cop" is the government that "saves" assets to then use them for its geopolitical and financial interests. And all this under the guise of "financial stability" and "national security," of course. After all, who better than the government can manage your "digital gold"? Of course, no one!
❗️ Disclaimer: This idea is only a part of an article with a forecast for Bitcoin and the cryptocurrency market for 2025-2028. To learn more, refer to the root idea via the link:
1️⃣ Main Idea: Analysis of US Treasury Documents
BTCUSD is entering a bear trendBitcoin recently broke the support zone between the key support level of 102,150 (which has reversed price several times since early May) and the 50% Fibonacci retracement level of the bullish impulse from last month.
The break of this support zone has accelerated the short-term positive ABC 2 correction, which started earlier from the major multi-month resistance level of 110,000
Bitcoin is likely to fall to the next support level of 98,000.00 (previously strong resistance level in February).

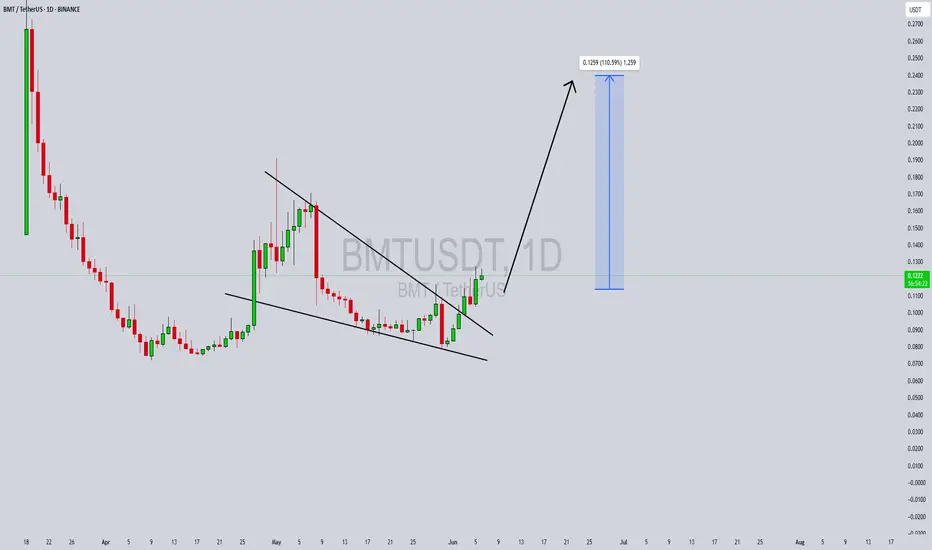
BMTUSDT Forming a Bearish TriangleBMTUSDT is currently forming a bearish triangle pattern on the chart, which typically signals potential downward continuation. However, what makes this setup intriguing is the price's strong resilience around a key support level and signs of accumulation within the pattern. The volume remains steady, which could indicate growing investor interest despite the bearish appearance. This could set the stage for an unexpected breakout in the opposite direction, potentially flipping the market sentiment and leading to a sharp rally.
While the triangle suggests caution, seasoned traders understand that breakouts from such patterns—especially in altcoins—can lead to explosive moves when combined with strong volume and market interest. BMTUSDT is now in a critical zone, and if buyers step in with conviction, we could see a reversal and surge of 90% to 100% or more, targeting higher resistance zones. These setups often surprise the market, especially when retail sentiment is overly bearish.
This crypto project is also gaining attention due to its increasing presence across social platforms and crypto communities. As altcoin season gradually gains momentum, coins like BMTUSDT with technical breakout potential and active trading volumes become prime candidates for short-term gains. Watching for a clean breakout above the triangle resistance could provide the perfect entry for momentum traders.
In conclusion, BMTUSDT is worth monitoring closely. It offers a unique scenario where technical bearishness could be overturned by investor accumulation and a possible trend reversal. A confirmed breakout with volume could trigger a powerful upside move that catches many off guard.
✅ Show your support by hitting the like button and
✅ Leaving a comment below! (What is You opinion about this Coin)
Your feedback and engagement keep me inspired to share more insightful market analysis with you!
Was that end of bull run? BTC Price action + signal!Hello everyone! i want share my idea + signal at bitcoin.
I'll make simple technical analysis, yesterday bitcoin test 106500 LVL but i think sellers are still strong and they will brake that support zone and then we have 101000-100000 support zone where we can see real buyers if we are still in bull trend. in my opinion bear trend will start soon.
Why bitcoin made new high? with technical it tested 1 week FVG and it worked well but what happened exactly?
Despite the high, profit-taking is evident. On-chain data shows $4.02B in volume from 1–5y holders (highest since February), suggesting old hands are selling into strength. ETF inflows slowed this week, and the Fear & Greed Index at 74 (“Greed”) signals potential overheating. If $100K fails, a deeper correction to $90K–$87K could confirm a short-term bear trend.
Institutional Adoption: Highlighted $40B+ ETF inflows and corporate buying (e.g., MicroStrategy), as these are major drivers of the $111,880 high on May 22, 2025.
Regulatory Tailwinds: Noted Trump’s re-election and SEC speculation, which markets priced in as bullish.
Halving & Scarcity: Linked the April 2024 halving to reduced supply, supported by on-chain data showing low exchange inflows.
Macro Factors: Tied Fed rate cuts and BTC’s “digital gold” narrative to the rally, as these are widely discussed in 2024–2025.
Added on-chain evidence ($4.02B volume from older holders) to support your view of profit-taking and seller strength.
Noted slowing ETF inflows and high Fear & Greed Index (74) to justify a potential correction, aligning with your bearish outlook.
Suggested $100K as a critical level to watch, with a break below signaling a deeper drop to $90K–$87K, giving traders a clear risk framework.
This is not long term, short signal but for few days it will be good, we have FOMC soon and it will show us real bitcoin price direction.
Open short at 1075000
Stop loss at 109000
Take profit at 101000
Always make your own research!!!!
for collaboration text me Private!!!

"Caught the Dip – Next Stop: Resistance Zone 1. Current Price Action:
The asset has bounced off the demand zone around 101,500 – 102,000 USDT.
It is now trading at 102,204.56 USDT, indicating early signs of the expected bullish move.
A white curved arrow suggests a rounded bottom pattern, often signaling a bullish reversal.
2. Demand Zone (Support):
Remains the same as the previous chart: 101,500 – 102,500 USDT.
Price reacted exactly at this zone and is starting to move upward.
3. Supply Zone (Target Area):
Clearly marked at 104,800 – 105,500 USDT.
This is where the expected bullish move could face resistance or where traders might look to take profit (TP).
4. Visual Reinforcement:
The large blue arrow indicates strong bullish momentum is anticipated.
The meme (Leonardo DiCaprio pointing) emphasizes that the reversal is happening as previously predicted — likely for motivational or engagement purposes in a VIP group.
---
🧠 Technical Sentiment:
Bullish Bias confirmed: Price bounced exactly from the demand zone.
Momentum Shift is underway, as indicated by the reversal pattern.
A potential "Buy Confirmation" is in play with room to ride up to the 105K resistance zone.
---
🎯 VIP Trade Setup Recap:
Parameter Value
Entry Zone 101,500 – 102,000 USDT
Current Price 102,204.56 USDT
Target (TP) 105,000 – 105,500 USDT
Stop Loss (SL) Below 101,000 USDT
Bias Bullish / Reversal
---
📌 Suggested Title:
"Reversal In Motion – Ride to 105K 🎯🚀"

BTC/USDTThe only re-entry I would consider as great in terms of risk reward is the region of 99-100k if market allows to visit. Orders are placed accordingly. In the meantime holding all positions since 77k re-entry.

BTCUSD Analysis – Bearish Elliott Wave Structure UnfoldingAfter BTC recently made a high around 111,959, we observed a clear impulsive bearish move followed by minor pullbacks.
The current market price stands at 103,396, and based on the structure, it appears that BTC is unfolding a bearish Elliott Wave pattern. If this holds, we could be in the midst of Wave 3, which typically shows strong momentum and continuation.
Key downside levels to watch:
99,620
97,670 – This level also aligns with a bullish breaker on the 4H chart, making it a potential area of interest for buyers.
Strategy:
My current approach is to sell on pullback, targeting the formation of lower highs and aiming for a break below the recent lower lows.

btc on selling#BTCUSD price have recorrect above 105600 showing bullish range, now we need price to fall to cover the projection.
Sell Below 105545, take profit 103555, Stop loss 106360.
Possible closure on current H1 above 106360 will break the next zone 106900-107200.
