BTC-----Buy around 104800, target 106000 areaTechnical analysis of BTC contract on June 5:
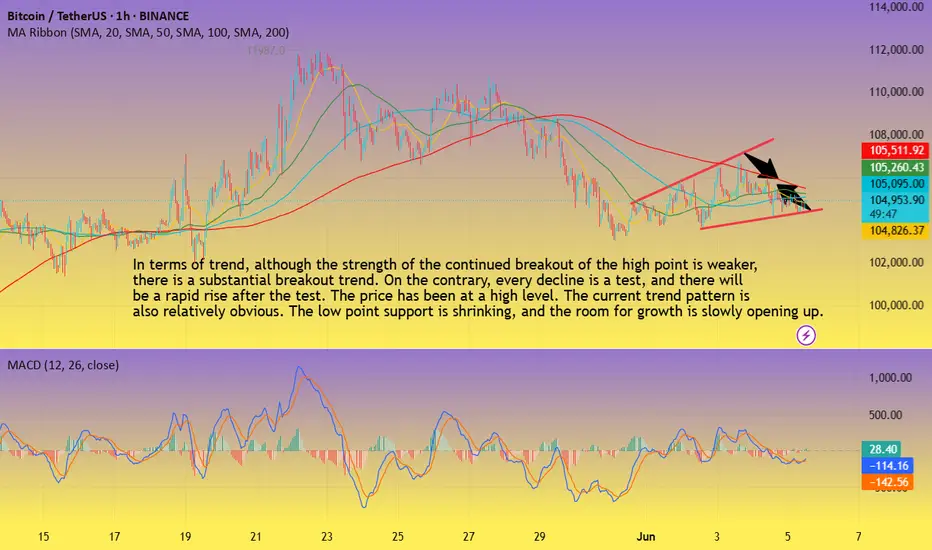
Today, the large-cycle daily line level closed with a small positive line yesterday. The K-line pattern has continuous positive and negative lines, but if we look carefully, we will find that the price has been at a high level, and every retracement trend is testing support, and the rise is breaking the high, although it has not continued, so in this case, it is still very easy to pull up and break; the short-cycle hourly chart price is oscillating in a small range, and the upward channel is slowly opening in the trend pattern, and the support for the decline is moving up. This is relatively clear. The current K-line pattern is continuous positive, and the attached indicator is golden fork, so there is a high probability of rising during the day. Whether the European session can break the high is to focus on.
BTC short-term contract trading strategy:
The current price is more in the 1048000 area, the stop loss is in the 1043000 area, and the target is in the 106000 area;
Btcusdanalysis
$BTC 2025: The road to $444,000As predicted by @JoshMandell6 on X earlier this year, this chart is an entirely theoretical exercise (a pure hopium mind-burp if you will) to explore the remote possibility that a CRYPTOCAP:BTC price of $444K might even be achievable in any scenario. I simply drew a line from the Pi Cycle top in 2017/18, to the top in March 2021 and projected on to now (June 2025). I then marked off the $444K prediction made earlier this year by @JoshMandell6 (the yellow horizontal, dashed line). I then checked prior BTC cycles to see there are any examples where BTC was able to climb this distance within 2 monthly candles. Interestingly, if you take the last 2 monthly candles from the 2017/18 cycle (before and including the topping candle), it does line up pretty well. This suggests it is theoretically possible for BTC to reach $444k by August 1st 2025 - I know this is highly unlikely of course; but interesting all the same.
For additional context to this theory: the specific post I'm referring to was made by Josh Mandell (@JoshMandell6) on X (formerly Twitter) on November 5, 2024. In this post, Mandell presented a poetic prediction stating that Bitcoin would reach $84,000 on March 14, 2025, and subsequently surge to approximately $444,000. The prediction included symbolic phrases like “three four, times a thousand,” suggesting a target price of $444,000.
Mandell's forecast gained significant attention when Bitcoin indeed closed near $84,000 on March 14, 2025, aligning with his prediction. This accuracy bolstered his reputation, especially considering his background as a former trader at Salomon Brothers and Caxton Associates. He has also been transparent about his trading activities, publicly sharing his portfolio, which reportedly grew from $2.1 million to over $22 million by March 2025.
en.bitcoinsistemi.com
For a more in-depth understanding of Mandell's prediction and its implications, you might find this video insightful: youtu.be

DeGRAM | BTCUSD retesting the $105k📊 Technical Analysis
● Triple bounce at 104.8 k-105 k and the violet trend-line created fresh higher-lows while keeping price above the May demand block.
● A two-week falling trend-line has just been cleared and retested, unlocking the next pivot at 108 k; flag depth from 105 k projects to the 111.7 k supply/upper channel rail.
💡 Fundamental Analysis
● FXStreet highlights US job openings at a 3-yr low, pressuring yields, while CoinShares tracks another $450 m spot-ETF inflow and exchange balances at a 4-yr trough, signalling a tightening float.
✨ Summary
Buy 104.8-106 k; clearance of 107 k aims for 111 k, stretch 115 k. Long thesis void on a 2 h close < 103 k.
-------------------
Share your opinion in the comments and support the idea with a like. Thanks for your support!

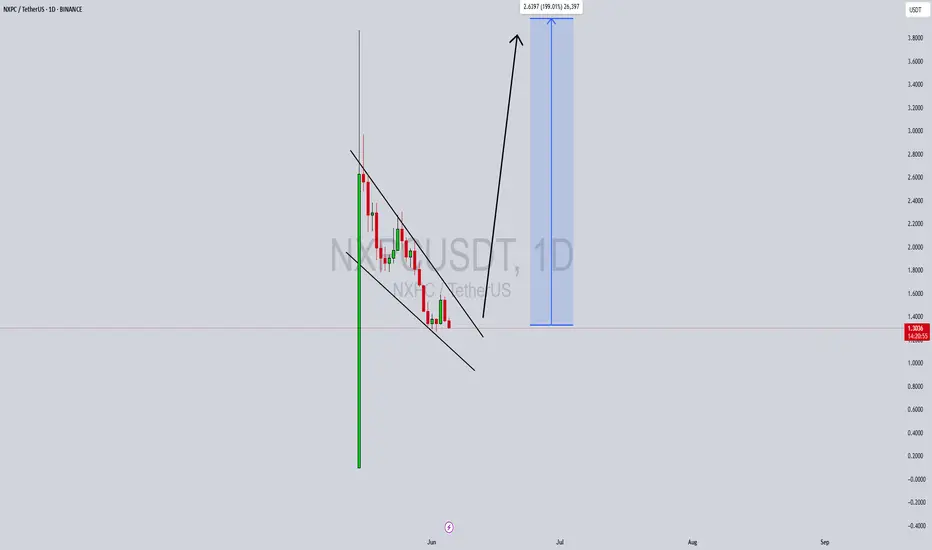
NXPCUSDT Forming Falling Wedge NXPCUSDT is currently exhibiting a classic falling wedge pattern on the daily timeframe—a pattern known for its bullish breakout potential. After a massive upward surge that brought strong attention to the pair, the price began a structured pullback within converging trendlines. This healthy correction, coupled with consistent buying interest, indicates a potential setup for another explosive move. The technical breakout projection signals a possible 190% to 200% upside from the current levels, making it one of the most promising altcoin setups in the short term.
The volume profile supports the bullish scenario, with a gradual reduction in sell pressure suggesting that sellers are exhausting. This kind of price action following a parabolic move is often seen as a base-building phase before another leg higher. The convergence near a key support zone only strengthens the likelihood of a breakout, attracting smart money and swing traders looking for early entries into high-reward positions.
NXPC has recently gained visibility due to its innovative approach and unique use cases in decentralized applications. As investor sentiment grows around low-cap, high-potential tokens, NXPC is becoming a serious contender among emerging altcoins. Coupled with its Binance listing, the project is attracting not only retail attention but also speculative volume from more experienced traders who recognize wedge breakouts as lucrative opportunities.
This chart setup, combined with rising fundamentals, makes NXPCUSDT one to watch very closely. If the wedge breaks out with strong volume confirmation, a rapid move toward the projected target range could unfold quickly. Timing the breakout with proper risk management can lead to exceptional gains in this type of market environment.
✅ Show your support by hitting the like button and
✅ Leaving a comment below! (What is You opinion about this Coin)
Your feedback and engagement keep me inspired to share more insightful market analysis with you!
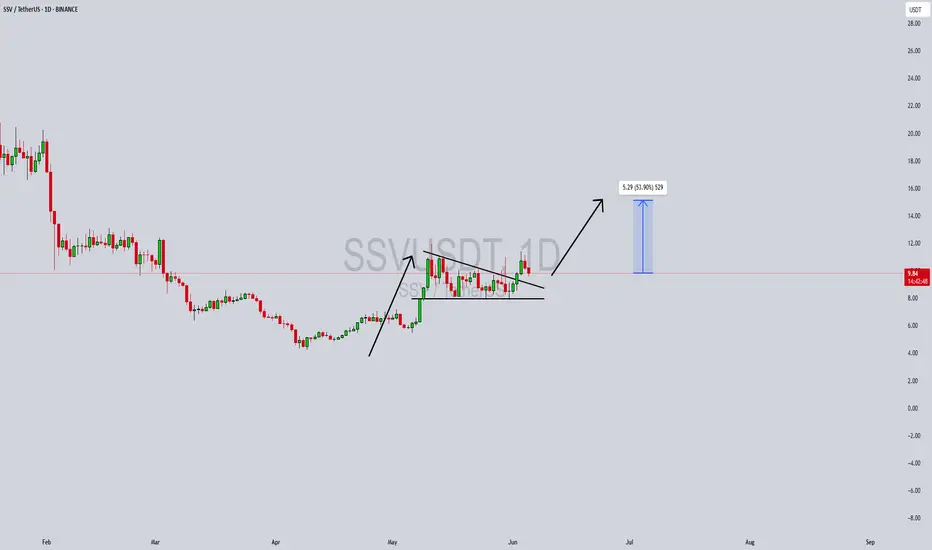
SSVUSDT Forming a Bullish PennantSSVUSDT is currently forming a bullish pennant pattern, which is typically a continuation formation that appears after a strong upward impulse. The pair recently experienced a significant breakout to the upside, followed by a consolidation phase forming a symmetrical triangle or pennant structure. With good volume maintaining support and bulls defending key levels, this setup is signaling that a strong breakout could be imminent.
SSV Network (SSV) plays a vital role in the Ethereum ecosystem by enabling decentralized staking infrastructure. As Ethereum’s staking market continues to grow, projects like SSV are drawing significant interest from investors due to their utility and real-world staking applications. With more ETH validators looking for secure and decentralized staking solutions, SSV is well-positioned for organic growth in the coming months.
The technicals support the bullish bias, with the chart projecting a potential 40% to 50% gain once price breaks out from the current consolidation zone. The bullish momentum building over the last few weeks, combined with strong investor sentiment and healthy volume, adds confidence to this projection. The breakout target aligns with prior resistance zones, making this a high-conviction setup for swing traders.
This pattern, in conjunction with the underlying fundamental strength of the SSV protocol, presents a compelling opportunity for traders watching altcoins with real utility. A successful breakout could attract more retail and institutional attention, especially as staking continues to trend in the broader crypto narrative.
✅ Show your support by hitting the like button and
✅ Leaving a comment below! (What is You opinion about this Coin)
Your feedback and engagement keep me inspired to share more insightful market analysis with you!
$ANIME Brreakout Ahead?- BINANCE:ANIMEUSDT is breaking out of a key resistance zone after weeks of higher lows.
- If this breakout holds, a move of 200% or more toward $0.09505 could be next.
- Watch for a retest. This could be the start of something big. 👀
DYRO, NFA

BTC: Maintaining Strength Bitcoin continues to hover around the $105,000 level. In line with the primary scenario, we expect the advance in green wave B to extend toward the upper blue Target Zone between $117,553 and $130,891. This zone can be used to lock in partial gains or establish hedges via short positions. From there, a corrective wave C is likely to follow, driving prices lower into the blue Target Zone between $62,395 and $51,323 — marking the end of the larger wave a. A corrective bounce should unfold next, ahead of the final selloff completing blue wave (ii). The alternative scenario, with a 30% probability, envisions a breakout above $130,891 and the establishment of a new high as part of blue wave alt.(i).
📈 Over 190 precise analyses, clear entry points, and defined Target Zones - that's what we do.

BTC-----Sell around 105200, target 104500 areaTechnical analysis of BTC contract on June 4:
Today, the large-cycle daily level closed with a small negative line yesterday, the K-line pattern was a single negative with continuous positive, the price was consolidating at a high level, and the attached indicator was dead cross running. The general trend of falling is still advantageous, and attention should be paid to the strength and continuation of the falling trend; the short-cycle hourly chart retreated under pressure yesterday morning, and the US market supported the rebound and broke the high point of the previous day, but the time was wrong, so the continuation was not seen in the early morning. It was under pressure again in the morning. The current price is at a low level, and the attached indicator is dead cross running. The four-hour chart is obviously suppressed, so there is probably still a need to continue the decline during the day.
BTC short-term contract trading strategy:
Sell at the current price of 105200, stop loss at 106000, and target the 104500 area;

Possible Bear MoveCurrently monitoring its bearish trend and identifying additional potential zones for shorting opportunities.

Price tapped the low — but didn’t break structure. That’s all I BTC delivered a clean sweep into the 15M low, filled the imbalance, and now it’s reclaiming. If you’re still wondering whether it’s valid — you’re not reading structure. You’re chasing candles.
Here’s the setup:
Price swept a key low at 104,870.98, tapping into a precision FVG
That move also kissed the edge of a lower BPR — institutional order flow at work
Now we’re rotating back toward the 15M OB near 106,438.94, with the first real reaction zone at 105,779.08
Above that, fib confluence and the OB offer a decision point: either distribute from 106.4 or break higher into premium inefficiency zones.
If price stalls at 0.5 (105,831) and rejects hard, I’ll expect a revisit to the low. If we blow through with displacement — we’re heading higher.
Execution bias:
Longs are valid as long as price holds above 104,870
TP1: 105,779
TP2: 106,438
Failure to reclaim FVG = scenario invalid, stand down
This isn’t a “setup.” It’s a replay of logic. The market does this every day — if you know how to listen.
More trades like this? No noise, just precision — check the profile description.

BTC Bitcoin Warning: No Clear Setup — Don’t Get Trapped!🚨 BTC Market Outlook: Analysis & Key Warning for Traders 🧠💡
Currently keeping a close eye on Bitcoin (BTC) 🔍. Previously, we saw strong bullish momentum propelling price upward 📈. However, that momentum is now under pressure — especially when you zoom into the 4-hour timeframe. We've seen a clear break in market structure, with lower highs and lower lows forming 🔻.
Right now, there’s no clean trade setup on the table. Price has pulled back, and we’re at a key inflection point — either we see a bullish breakout, or further downside could unfold 📉.
This video is more of a technical warning ⚠️ for traders feeling the urge to jump in early. The current structure is risky, and taking impulsive trades here could do more harm than good.
In the video, I also cover how to identify the highest-probability setups — particularly when price consolidates in a range and then breaks out in the direction of the prevailing trend. These continuation setups offer far better odds than guessing mid-range.
📌 Be patient. Let the setup come to you. Don’t force trades when conditions are unclear.
💬 If you’ve watched the analysis or have thoughts on BTC’s next move, comment below — I’d love to hear your view.
❗️Disclaimer: This is not financial advice. Everything shared is for educational purposes only. Always do your own analysis and trade responsibly. Risk management is key.

Price is coiled. Expansion is near. The setup is clean — if you BINANCE:BTCUSDT has reclaimed its 4H range low and is now driving into the midpoint of a prior leg. This isn’t random — it’s the prelude to a move Smart Money has been framing for days.
Here’s the breakdown:
Price respected the 0.618 (105,780) and rotated upward — that level is now the line between structure and noise
First objective: OB 4H at 107,839, aligning with 0.5 → 0.382 retracement
If that gets cleared with displacement, we extend into 109,621 — final premium zone before HTF liquidity is satisfied
The upper wick at 111,897 is still untouched — a long-term draw that only unlocks if we break 109k with intent
But if price fails and flips below 105,780, that signals fading momentum — and opens the door for a sweep toward the 4H OB at 104,116 or even the FVG 4H down near 101,998
Execution mindset:
Longs are valid above 105,780
Targeting: 107.8 → 109.6 → possibly 111.9
Invalidation: Daily close below 104,116
Liquidity lies above — Smart Money is already positioned
You don’t need signals when structure tells the story. You just need precision.
More entries, levels, and logic? They’re in the profile description — not in the crowd.

Price isn’t reacting — it’s delivering.BTC just tapped into the 4H FVG with surgical precision.
If you’ve been watching price the way Smart Money does, this wasn’t a surprise. It was the setup.
Here's the structure:
After reclaiming the 4H OB below, price expanded upward into the Fair Value Gap (FVG 4H)
That delivery aligns with the 0.0 fib at 106,770.4 — a premium zone engineered for liquidity harvesting
The next level above is the RB — Reversal Block — where I expect displacement to either fade or accelerate
What matters now is how price reacts on the pullback into the 0.382 → 0.618 fib range (105,338.9 to 104,454.6).
If we see structure hold, I’ll target 107,082.6 next.
If that zone fails — all eyes go back to the OB 4H at 103,023.2.
Execution clarity:
Holding above 104,454 → Long bias continues
Breaking 103,825 with follow-through? Reversal confirmed
Clean invalidation, clean targets — no guessing
The chart’s not lying. It's just speaking in algorithm.
Want trades like this before they hit the box? Check the profile description. Clarity doesn’t need noise. Just rules.

Bitcoin Looks Set for a Dip Before Its Next Big MoveRight now, Bitcoin is showing signs of cooling off after a solid run-up over the past few weeks. Looking at the chart, it seems like BTC is struggling to break through that descending trendline—it’s been rejected there more than once, and now it's likely heading lower in the short term.
Here’s what seems most likely: price pulls back toward the $99,000 support zone (highlighted in purple on the chart). That area has acted as a solid floor before, so it wouldn’t be surprising to see buyers step in again.
After that? If support holds and we see some momentum return, BTC could start climbing again. the chart suggests a potential breakout to the upside, maybe even pushing toward a new all-time high (ATH) above $114,000.
In simple terms: expect a short-term dip, but keep an eye out for a strong bounce—this could just be a healthy pullback before the next big leg up.
for summary:
Short-term dip likely, targeting ~$99K
Strong support there—watch for a bounce
If it holds, BTC might push toward new highs

btc on sell#BTC on bullish retracment but price won't hold long, possible we await for decline around the rectangle before selling.
Between 107200-106900 sell, TP 104642, SL 108175.
Bullish range can be consider on multiple breakout at 108300.

BITCOIN LONG TRADE IDEAI'm looking forward to buying BTC in this price level if I see a good bullish price action which confirm my trade idea.
Market structure on 4HR is currently bullish.
Looking at the monthly and weekly time frame, BTC is extremely bullish and it's clear that BTC is not done with it's bullish run.
I expect to see BTC give another good run to the 120k-150k price level

Wedge pattern - Bullish Strategy (MSTR)My expectations for June for Microstrategy stock aka Strategy. Ofc, It all depends heavily on BITSTAMP:BTCUSD

DeGRAM | BTCUSD fixed above the $104,000 level📊 Technical Analysis
● Bulls twice defended the 103-105 k demand and purple trend-line, turning the zone into a springboard; price also reclaimed the inner grey trend-median, preserving higher-lows in the 7-week rising channel.
● A fresh ascending triangle is coiling under 111 k; pattern height projects to the red 112-115 k supply/channel roof once 111 k gives way, while invalidation rises with the trend-line at 103 k.
💡 Fundamental Analysis
● CoinShares reports a third straight week of spot-ETF inflows (+US$1 bn) and the BTC exchange reserve just printed a new 3-year low, signalling supply squeeze. Meanwhile, ISM manufacturing slipped back below 50, cooling U.S. yields and the DXY and reviving crypto appetite.
✨ Summary
Long 104-106 k; triangle break >111 k targets 112 k → 115 k. Bull view void on a 16 h close beneath 103 k.

Bitcoin Dominance, BTC ATH and ALT Seasons since 2017-some facts
There is little doubt now, that this Crypto cycle is very different from previous cycles and the main reason for this is the Bitcoin Dominance ( BTC.D) of the Market.
The reasons for this Dominance is complicated but we can certainly point towards the arrival of ETF's as one of the principle factors.
Corporations simply Buy Bitcoin, Hold it and Trade the ETF's - The Key Principle here being that the Coins are HELD Long term.
As we can see from the main chart, we have a key point in the BTC cycle called the Bitcoin Halving. To many extents, the explanation of this is not relevant right now.
But what you can see is how, previously, after the BTC Halving, we saw a drop in BTC.D,
This was due to the money Flow out of BTC and into ALT coins.
As more ALT coins were bought up, the demand drove the price higher and so their dominance increased, driving BTC.D down
This has not happened this cycle due to bulk buying of BTC for ETF's and BTC being Held Long term.
We can also see how , as we approached a certain time span After the Halving, we saw a sharp rise in BTC.D as we headed towards the next BTC ATH as the BTC buying picked up.
Again, this is not happening this cycle as the Bitcoins are being held long term.
What we can also see on the main chart is how we would normally be approaching a period of expected BTC ATH ( green vertical box )
And the HUGE question is, Will we get a Bitcoin ATH in this period ?
This is, to many extents, impossible to answer but as demand for Bitcoin continues and coins become harder to find, the price should continue to rise.
The tricky bit is, now, with a Bitcoin costing over 100K usd, it becomes harder to move the price. Only Corporations can afford to bulk buy.
So, again, things are different.. Retail is struggling to find a foot hold in the Bitcoin market, seeming to think that a Bitcoin is too expensive for them.....forgetting that they can buy a bit and that will also increase in price by the same %.
And so they look to the ALTs, fast volatile price rises and high returns,
This is seen very clearly in this chart that shows us when we had previous ALT seasons after the Halving
See how, after a period of time after Halving, the ALT Seasons appeared when the BTC.D dropped.
And that has simply just NOT happened this time.
It has to be said, it did try to appear. ALT season tried to happen.
See how after 210 days after halving this cycle, BTC.D did drop sharply but, it found a line of support and bounced back, Killing the ALT season dead in its tracks
There have been a lot of attempts since but the Market has been Bloody for ALTS, with sharp rise and Falls destroying confidence..... And Bitcoin continues to Rise.
So, where are we now ?
This Daily BTC.D chart may offer some ideas
BTC.D PA is currently at TOP of long Term range and finding it hard to get over that line of resistance.
BTC.D Weekly MACD , while not overbought, is curling over Bearish
BTC ATH's have previously been attained from Oversold areas as MACD Rose back higher.
The Volatility has gone and MACD is ranging smooth
SO, in conclusion, it is anybodies Guess right now if we will ever see an ALT season again.
Technically, on many fronts, we are poised, ready for it, even if it is a mini one.
But as we have seen on many occasions this cycle, Bitcoin is a very desired asset now and Demand drives price.....and so the Sell off that we need to drive an Alt season just may not occur.
One thing that is Absolutely certain though, we are highly likely to see another Bitcoin ATH
Stay safe everyone and Love one another. It is Free to do and is worth more than anything

BTCUSDT – Ready for the next downward move🚀 Trade Setup Details:
🕯 #BTC/USDT 🔽 Sell | Short 🔽
⌛️ TimeFrame: 15m
--------------------
🛡 Risk Management:
🛡 If Your Account Balance: $1000
🛡 If Your Loss-Limit: 1%
🛡 Then Your Signal Margin: $1369.86
--------------------
☄️ En1: 104838.38 (Amount: $136.99)
☄️ En2: 105096.3 (Amount: $479.45)
☄️ En3: 105280.29 (Amount: $616.44)
☄️ En4: 105464.61 (Amount: $136.99)
--------------------
☄️ If All Entries Are Activated, Then:
☄️ Average.En: 105190.14 ($1369.86)
--------------------
☑️ TP1: 104215.87 (+0.93%) (RR:1.27)
☑️ TP2: 103752.49 (+1.37%) (RR:1.88)
☑️ TP3: 103166.5 (+1.92%) (RR:2.63)
☑️ TP4: 102425.86 (+2.63%) (RR:3.6)
☑️ TP5: 101614.34 (+3.4%) (RR:4.66)
--------------------
❌ SL: 105957.69 (-0.73%) (-$10)
--------------------
💯 Maximum.Lev: 75X
⌛️ Trading Type: Swing Trading
‼️ Signal Risk: ⚠️ High-Risk! ⚠️
🔎 Technical Analysis Breakdown:
This technical analysis is based on Price Action, Elliott waves, SMC (Smart Money Concepts), and ICT (Inner Circle Trader) concepts. All entry points, Target Points, and Stop Losses are calculated using professional mathematical formulas. As a result, you can have an optimal trade setup based on great risk management.
⚠️ Disclaimer:
Trading involves significant risk, and past performance does not guarantee future results. This analysis is for informational purposes only and should not be considered financial advice. Always conduct your research and trade responsibly.
💡 Stay Updated:
Like this technical analysis? Follow me for more in-depth insights, technical setups, and market updates. Let's trade smarter together!

Liquidity was the excuse. Expansion was the goal.This BINANCE:BTCUSDT.P move was written before it happened — clean sweep, BPR fill, and now the setup is primed. You either knew where price was going, or you reacted late.
Price expanded aggressively into a clear 1H IFVG. That wasn’t just a push — it was a calculated run into a premium imbalance.
Now? We're retracing. Right into the EQ of the breaker block and the 0.5 fib (105,039). Exactly where the market wants you uncertain. I’m not.
Here’s the logic:
1H IFVG is filled. That’s done.
Price retraced directly into the 0.382 and 0.5 fib zone.
We have a defined BPR, and price is now hovering around its midpoint — ideal zone for reaccumulation.
As long as 104,999–105,039 holds, I expect a continuation back into 105,891 → 106,478.
If that range breaks clean, the low-hanging liquidity below 104,359 becomes a magnet.
But the narrative right now? HTF is still aligned bullish. We're in the phase where most traders get shaken out before the real move starts.
Trade idea: If I’m in, my invalidation is clean — under 104,699. Target is north of 106,000. I’ll scale partials at 105,799 and let the rest ride.
You want more trades like this? Check the account description. I don’t just post setups — I build conviction.
Let the influencers scream. I prefer precision.


LMACD running out of timeTime for the LMACD is ending soon. Once we reach 800 of the bull days BTC might be starting to change its trend. If we dont see irregular tops like in 2021 this might be the toping prices for this cycle. Let that sink in.
