No breakout. Just engineered liquidity. Watch how I step in.This setup didn’t need noise. Just clarity.
We took sell-side liquidity below the FVG FF with precision, tapping into a 4H OB nested at a deeper 78.6% retracement. That’s where the mispricing ends. That’s where I step in.
Price didn’t reverse because of “oversold.” It reversed because Smart Money engineered the imbalance, swept stops, and delivered into a value zone. Nothing more. Nothing less.
The rejection from that 102,067 level formed the base. From there, I expect delivery up into the 104,953 handle — where the 0.618 confluence and the upper OB sit. That’s the decision point.
Above that, we’ve got unfinished business at 107,614. If price pierces through 106,955 — where the 0.5 lines up with a previous supply — expect the full expansion into the 109,500s.
But I’m not rushing it. Liquidity above that OB at 108,122 has weight — and may serve as distribution before another push lower.
What I’m watching:
✅ Buy-side liquidity resting above 104,953
✅ OB rejection zone at 108,122
❌ 102,067 invalidation if price closes with displacement through the low
🔻 If that fails — price wants the inefficiency down near 102,051
I’m not here to catch every move.
I’m here to catch the right one.
I don’t need confirmation. I am the confirmation.
Btcusdanalysis

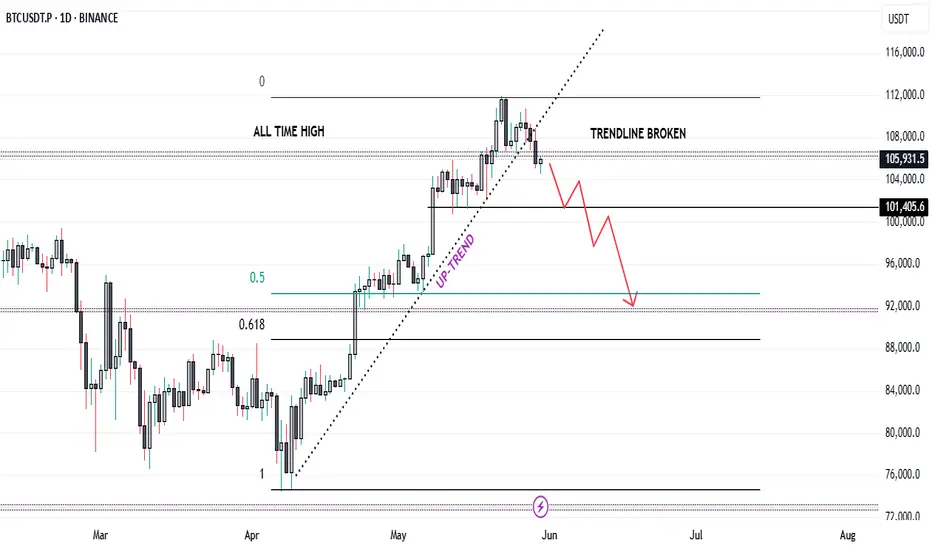
BTC/USD – Double Top Breakdown Signals Bearish Wave- 4H chart. 🧨
🔍 Chart Analysis:
🟢 Recent Price Action:
Bitcoin formed a double top pattern near the Recent All-Time High (ATH) 📈 — a strong bearish signal 🔔.
A trendline break occurred right after the second peak, confirming potential weakness ⚠️.
🟠 Supply Zone:
Price re-entered a previous supply zone (resistance area) and failed to hold above it 🧱 — indicating sellers are active again.
🔵 EMA 70 (Blue Line):
The price has dropped below the 70 EMA, signaling momentum shift from bullish to bearish 📉.
🔴 STOP LOSS ZONE:
Positioned above 110,555 🚫 — risk level for this short setup if bulls reclaim control.
🟡 Bearish Pathway (Expected Move):
Price may retest the broken zone 🔁.
Followed by a sharp drop to the 1st support near $101,503 🎯.
Confirmed by large bearish volume spikes 📊.
💥 Trade Idea:
Entry: Near 106,000 (on retest of supply zone).
Stop Loss: Above 110,555 🔺.
Target: $101,500 🎯.
Risk/Reward Ratio: 🔥 Favorable setup for swing short sellers!
📛 Pattern Breakdown:
⚠️ Double Top = Reversal Signal.
🔻 Trendline Break = Shift in Market Structure.
🧊 Supply Zone Rejection = Bearish Confirmation.

BTC HTD Demand zones for longBTH HTF Demand Zone are marked,
when price hit these levels you can take long if you want,
trading is risky, Do-your-own-research, Follow risk management

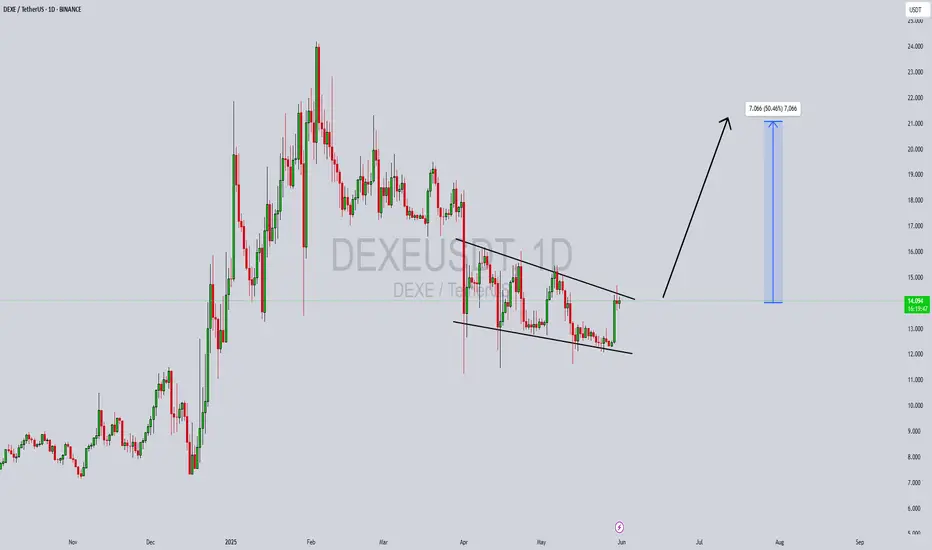
DEXEUSDT Forming a Bullish Wave DEXEUSDT is currently forming a bullish wave pattern, which indicates a strong continuation trend following a previous impulsive move. This technical formation, characterized by a series of higher highs and higher lows, reflects growing investor confidence and buying momentum. With good volume supporting the price structure, the likelihood of a breakout continuation is high, targeting an expected gain of 40% to 50% in the medium term.
DeXe (DEXE) has been gaining traction within the decentralized finance (DeFi) sector. As a governance and staking token for the DeXe network, it offers a unique proposition in decentralized asset and portfolio management. This aligns with the growing demand for transparency and user empowerment in financial decision-making, which enhances its fundamental appeal. The recent bullish wave setup complements this strong narrative, making DEXEUSDT a compelling asset on both technical and fundamental fronts.
From a chartist’s perspective, confirmation of this pattern with a breakout above recent swing highs could attract both momentum and position traders. Supporting indicators such as RSI trending upward and MACD crossover point to increasing bullish strength. The combination of technical alignment and rising on-chain activity for DEXE fuels a high-probability trade setup for bullish continuation.
In conclusion, DEXEUSDT is on the radar of many smart money traders looking to ride the next impulsive leg. If this bullish wave completes as anticipated, we could see significant upside in the coming weeks, especially as DeFi regains momentum across the crypto space.
✅ Show your support by hitting the like button and
✅ Leaving a comment below! (What is You opinion about this Coin)
Your feedback and engagement keep me inspired to share more insightful market analysis with you!
PHAUSDT Forming a Bullish Flag PatternPHAUSDT is currently displaying a classic bullish flag pattern on the daily chart, which is often considered a strong continuation signal in technical analysis. After a sharp upward move, the price has entered a consolidation phase within a descending channel—forming the "flag" portion of the pattern. With good volume backing the previous rally, this consolidation suggests that the bulls are simply taking a breather before the next leg higher. A breakout above the upper boundary of the flag could potentially trigger a 40% to 50% gain in the coming sessions.
From a market sentiment standpoint, PHA is gaining increased traction among crypto investors due to its underlying fundamentals and the growing use case of privacy-preserving technologies. As part of the Phala Network, which focuses on decentralized cloud computing with built-in privacy, the token has positioned itself well in the Web3 and privacy niche. This unique narrative is attracting more attention, and it reflects in the technical setup that's ripe for a breakout.
Traders should closely monitor the breakout zone near the flag's resistance. If PHAUSDT pushes through with strong volume confirmation, it could mark the beginning of a new bullish wave. Price action, along with volume spikes, RSI crossover, and MACD bullish alignment, further support this scenario. The potential risk-to-reward ratio favors strategic long entries for both swing traders and mid-term investors.
This pattern is a compelling opportunity for those looking to capitalize on breakout moves in trending altcoins. If market conditions remain favorable, PHAUSDT could easily exceed expectations, offering a solid gain for those positioned early.
✅ Show your support by hitting the like button and
✅ Leaving a comment below! (What is You opinion about this Coin)
Your feedback and engagement keep me inspired to share more insightful market analysis with you!

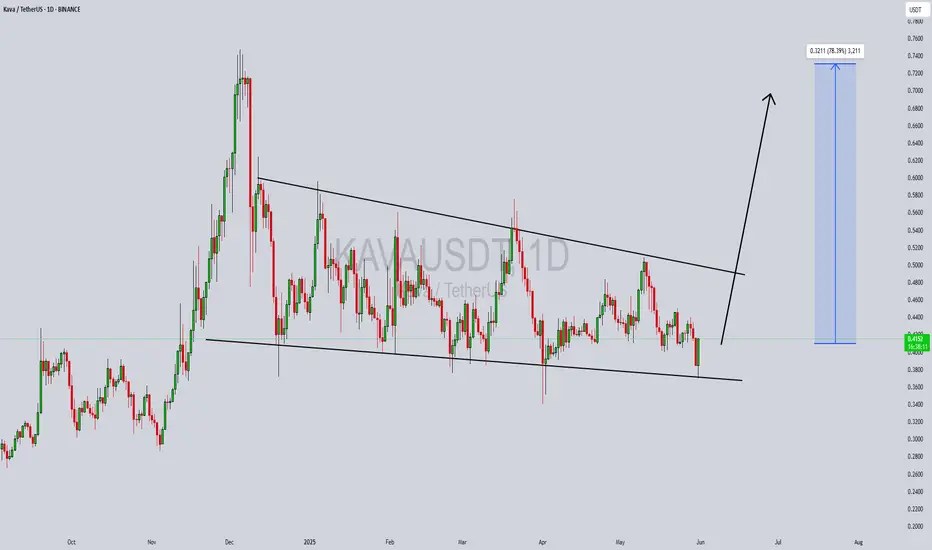
KAVAUSDT Forming a Bullish WaveKAVAUSDT is currently presenting a strong bullish wave pattern formation on the daily timeframe, hinting at a potential continuation of the upward trend. After a period of consolidation, KAVA has started to push higher with increasing bullish momentum. This movement is accompanied by solid volume, suggesting that the current wave could be the beginning of a larger impulse leg. The structure is favorable for swing traders and position traders looking to capture mid-term gains in the range of 60% to 70% or more.
From a technical perspective, the price has respected key support zones and is now forming higher highs and higher lows—a classic sign of a bullish trend in development. The overall market sentiment around KAVA is improving, and this is reflected in its rising trading volumes and increased mentions across crypto discussion platforms. If the bullish wave continues to unfold as expected, KAVA could challenge previous resistance levels and break into a new bullish phase.
KAVA also benefits from growing investor interest due to its strong fundamentals in the DeFi ecosystem. As a cross-chain DeFi platform, KAVA provides lending and stablecoin services, making it an attractive asset in a maturing crypto market. Technical indicators such as RSI and MACD are showing bullish signals, further supporting the case for a significant upside move. With volume surging and structure aligning, KAVA appears well-positioned to deliver a strong breakout rally.
Keep an eye on price levels around recent breakout zones as potential entry points. A successful retest could provide a good risk-reward setup for traders aiming to ride the bullish wave. Continued buying pressure and sustained volume would be key signs of strength in the coming days.
✅ Show your support by hitting the like button and
✅ Leaving a comment below! (What is You opinion about this Coin)
Your feedback and engagement keep me inspired to share more insightful market analysis with you!
$CRO Breakout ConfirmedGETTEX:CRO Breakout Confirmed
OKX:CROUSDT has broken out of a symmetrical triangle after weeks of consolidation. A bullish MACD crossover and a reclaim of the 50-day EMA support the breakout. A potential 125% move is in play, targeting the $0.235 zone.
The chart shows that strong momentum is building.
DYRO, NFA

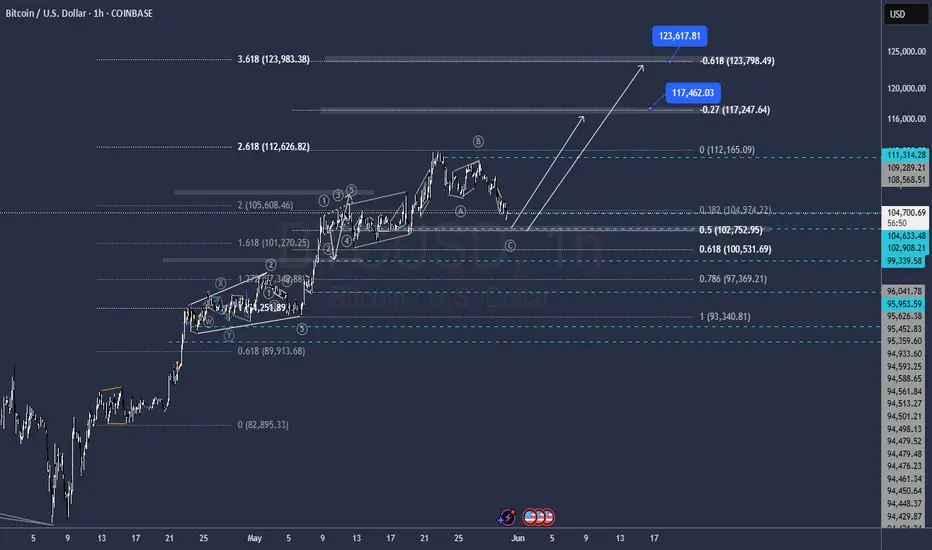
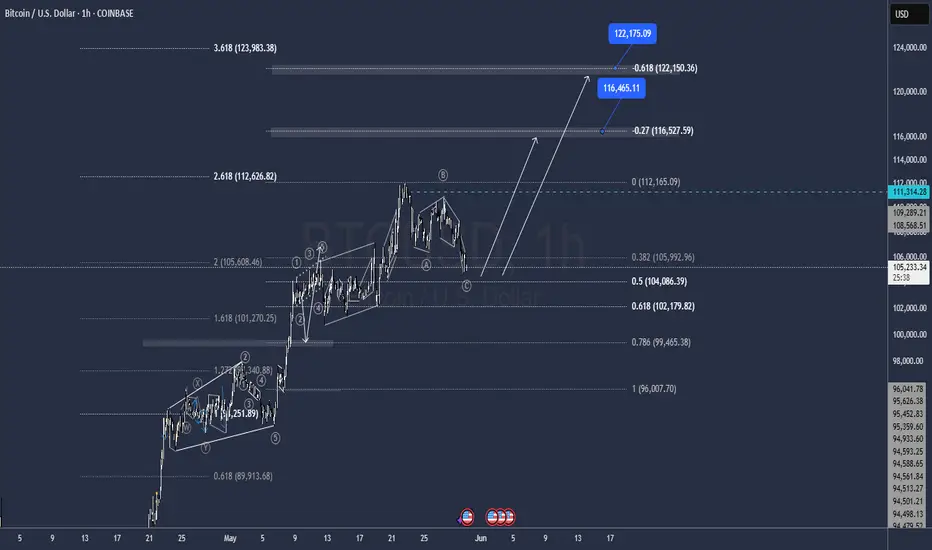
BTC UPDATERegarding the Reaction to 104.000 level it is still possible to get one more mmove down to 103.000 level before the next Rally Up Towards 117.000 / 123.000 and further
Bitcoin Is Entering Into Very Difficult TimesHello, Skyrexians!
I have been thinking what will happen next with BINANCE:BTCUSDT and it was obvious that correction has been started, you can easily find my recent update on Bitcoin and check it, but what will happen after. Today I decided that the first impulse has not been finessed yet and we need one more small leg up to complete this growth before significant correction.
Let's take a look at the yellow Elliott waves cycle. Awesome Oscillator gave me an idea that only wave 3 has been finished above $110k. Now price is printing wave 4. Wave 4 has a target between 0.38 and 0.5 Fibonacci, but this time it will be definitely 0.38 at $101k. Here was the smaller degree wave's 4 bottom. Wave 5 will be shortened because wave 3 was extended, it's very logically. After $111k retest the major wave 2 will go to $90k approximately. Difficult times ahead for crypto, I think this period will be finished only at the end of June.
Best regards,
Ivan Skyrexio
___________________________________________________________
Please, boost this article and subscribe our page if you like analysis!

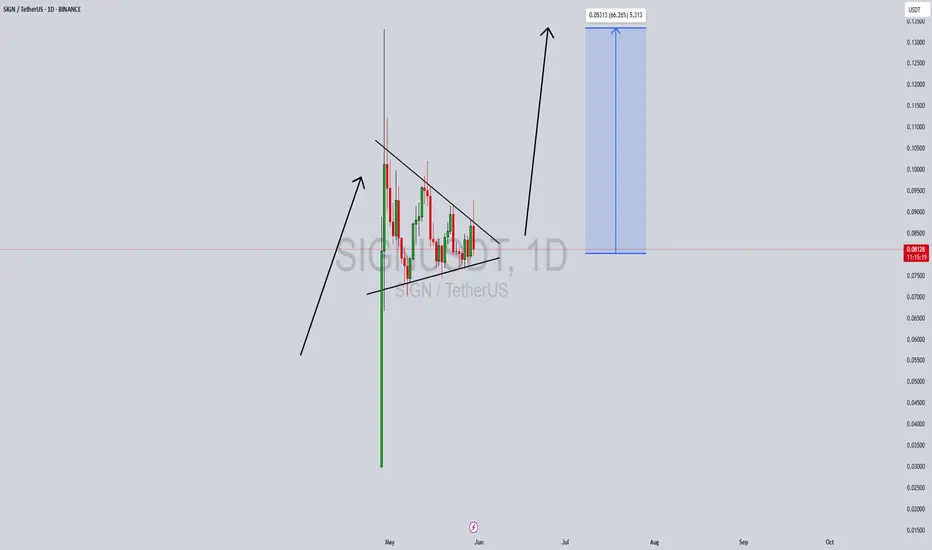
SIGNUSDT Forming Bullish Pennant SIGNUSDT is currently exhibiting a strong bullish pennant pattern on the daily timeframe—a continuation setup that often precedes substantial upward movement. Following an aggressive price surge, the pair has entered a brief consolidation phase within converging trendlines, suggesting that bulls are simply regrouping for the next leg higher. This is typically a bullish signal, especially when paired with increasing volume and positive sentiment surrounding the project.
The volume has remained healthy during the pennant formation, indicating sustained interest and participation from investors. With a clean technical structure and no major overhead resistance in the immediate zone, SIGN has positioned itself for a breakout move. Based on the height of the flagpole and the pattern formation, a price surge of 40% to 50% is anticipated, with targets aligning near the $0.13 zone. Such a move would mirror the breakout potential we’ve seen in similar setups across the altcoin market.
From a sentiment perspective, market participants have shown growing confidence in the SIGN project. Social mentions, trading volume, and overall engagement metrics are on the rise. This kind of grassroots enthusiasm often precedes strong rallies, and with Bitcoin and Ethereum holding steady, the stage may be set for altcoins like SIGN to shine. Technically and fundamentally, the alignment for an upward push appears to be falling into place.
Traders should watch for a clean breakout with volume confirmation above the resistance trendline. A decisive candle close above the pennant could act as a strong bullish catalyst. Risk management is key, but the risk-reward profile currently leans heavily in favor of the bulls.
✅ Show your support by hitting the like button and
✅ Leaving a comment below! (What is You opinion about this Coin)
Your feedback and engagement keep me inspired to share more insightful market analysis with you!
ORCAUSDT Forming Symmetrical Triangle ORCAUSDT is currently forming a symmetrical triangle pattern on the daily chart, a technical setup that often signals strong breakout potential. This type of consolidation pattern typically indicates a period of indecision that could lead to a significant price move once a breakout occurs. With ORCA trading at the apex of the triangle and volume gradually increasing, a bullish breakout looks increasingly probable in the near term.
The volume profile supports the idea of a coming rally, as we see accumulation within the pattern and recent volume spikes suggesting renewed investor interest. ORCA’s fundamentals and recent market developments are also attracting attention from both retail and institutional players. If the upper trendline of the triangle is broken convincingly, we could expect a 40% to 50% upward surge, potentially reaching near the $4.50 zone.
Technical traders are watching closely, especially with broader market sentiment improving across altcoins. ORCA’s formation of higher lows within the triangle adds confidence to the bullish thesis. The symmetry of the pattern and breakout projection aligns with historical moves in similar market conditions, reinforcing the anticipated gain targets.
Given its current technical posture, ORCAUSDT presents a high-reward setup. A confirmed breakout could trigger momentum buying, driving price rapidly toward the target. Stay vigilant and watch for confirmation signals like increasing volume and a strong close above resistance.
✅ Show your support by hitting the like button and
✅ Leaving a comment below! (What is You opinion about this Coin)
Your feedback and engagement keep me inspired to share more insightful market analysis with you!

DeGRAM | BTCUSD reached the strong trend line📊 Technical Analysis
● Bulls defended 105 k again: a bullish inside-bar formed on the green demand band and purple trend-line, keeping price glued to the rising-channel median.
● 4 h RSI reset to mid-40s while OBV held flat, signalling dip absorption; pattern projects a swing back to the channel roof/-red supply near 112-115 k if 111 k neckline is cleared.
💡 Fundamental Analysis
● The Coinbase premium flipped positive for the first time in two weeks, reflecting fresh US spot buying just as soft Chicago PMI dragged the DXY lower, easing macro head-winds.
✨ Summary
Buy 105-108 k dips; break above 111 k eyes 112 k then 115 k. Trend intact while price closes above 104 k.
-------------------
Share your opinion in the comments and support the idea with a like. Thanks for your support!

Bitcoin's Breakout Fizzles: Is a Major Reversal in Play...?Bitcoin Technical Analysis – In-Depth Breakdown
Over the past two months, Bitcoin has exhibited a strong bullish trend, appreciating by approximately 51%. The sustained rally was primarily driven by bullish momentum, increased investor confidence, and broader market sentiment.
Recently, Bitcoin broke through its all-time high (ATH) of 106,500, surging to a new peak near 112,000. However, this breakout was short-lived as the price failed to sustain above this level, indicating significant profit-taking activity by traders and long-term holders. This inability to hold the ATH region highlights a potential liquidity pocket where sell orders accumulate, resulting in a rejection wick and a subsequent reversal.
From a Technical perspective:
The price has now fallen back below 106,500, turning this key level into a major resistance zone. Historically, once a strong resistance level (like an ATH) is breached and subsequently reclaimed, it often acts as a formidable barrier to upward price movement unless there’s renewed bullish momentum.
Additionally, Bitcoin has broken its ascending trendline (drawn from the lows of the uptrend) and has already retested this trendline from below. The retest was successful in confirming the breakdown, which further strengthens the bearish bias.
The price structure is now forming a potential lower high pattern near the 106,500 resistance. This could signal a shift in market sentiment from bullish continuation to consolidation or correction.
In terms of market psychology, the all-time high region represents a crucial psychological barrier. Traders and investors often exhibit heightened caution near such levels. Many choose to lock in profits due to fear of a double top or a false breakout. This behavior can create increased volatility, especially when combined with institutional and retail order flows.
Trading Strategy and Risk Management
Given the technical breakdown and the psychological factors at play:
✅ A short position can be considered, particularly around the 106,500 resistance, with confirmation from the trendline retest.
✅ However, exercise caution due to the high volatility typically observed near ATH levels. Whipsaws and fakeouts are common as both bulls and bears battle for control.
✅ Avoid high-leverage positions unless you have a strict stop-loss in place. Ideally, place the stop-loss just above the 106,500 - 107,000 zone, where a decisive breakout would invalidate the short setup.
✅ For profit targets, initial supports are seen around 100,000 - 98,000, and a deeper correction could test the 94,000 - 92,000 zone.
✅ Wait for clear confirmation, such as a strong bearish candle on the retest of the resistance, before entering the trade.
BTC , 1D BTC has Break Down in 4Hr and Retest the lower Trendline in 1Hr , SO we think that it will Fall in Future , If BTC is Sustaining below its 1,05,600 then we confirm that it will be Fall Drastically
if BTC is falling then remaining coins , which are giving Breakdown of Patterns they will give Very Good Profit
Risk - 3% and Aim for 20 % .
Follow for More Swing Idea Like this

BTCUSDT Analysis: Bullish Intent Building on Higher TimeframesTaking a look at BTCUSDT. My analysis points to this current level as a significant support zone, with my overall target being higher.
While the low timeframe (LTF) action hasn't yet shown a strong influx of buyers, the picture on the higher timeframes is quite compelling. The upward movement we're seeing there is displaying solid support, indicating sustained buying interest at a larger scale.
This divergence between the LTF and HTF suggests a potential build-up of bullish momentum. We might see some consolidation or sideways movement on the lower timeframes as buyers accumulate before a more decisive push upwards.
As always, I'm keeping a close eye on the volume footprint. The sustained buying volume on the higher timeframes lends credence to this bullish outlook. I'll be waiting for the low timeframe to catch up, looking for those clear signs of buyer entry – breakouts above smaller resistances with increasing volume, and successful retests as support. CDV (Cumulative Delta Volume) on both timeframes will also be crucial in confirming this directional bias.
Remember, I focus on coins showing sudden and significant increases in volume, and while the immediate LTF might be quiet, the HTF volume profile is definitely noteworthy here.
My bias for BTCUSDT right now is upwards, given the supportive structure on the higher timeframes. However, as always, I'll be waiting for that low timeframe confirmation before considering any entries. Patience and confirmation are key, even when the higher timeframe picture looks promising. Let's see if the lower timeframes will soon echo the bullish intent we're seeing on the higher ones.
📌I keep my charts clean and simple because I believe clarity leads to better decisions.
📌My approach is built on years of experience and a solid track record. I don’t claim to know it all but I’m confident in my ability to spot high-probability setups.
📌If you would like to learn how to use the heatmap, cumulative volume delta and volume footprint techniques that I use below to determine very accurate demand regions, you can send me a private message. I help anyone who wants it completely free of charge.
🔑I have a long list of my proven technique below:
🎯 ZENUSDT.P: Patience & Profitability | %230 Reaction from the Sniper Entry
🐶 DOGEUSDT.P: Next Move
🎨 RENDERUSDT.P: Opportunity of the Month
💎 ETHUSDT.P: Where to Retrace
🟢 BNBUSDT.P: Potential Surge
📊 BTC Dominance: Reaction Zone
🌊 WAVESUSDT.P: Demand Zone Potential
🟣 UNIUSDT.P: Long-Term Trade
🔵 XRPUSDT.P: Entry Zones
🔗 LINKUSDT.P: Follow The River
📈 BTCUSDT.P: Two Key Demand Zones
🟩 POLUSDT: Bullish Momentum
🌟 PENDLEUSDT.P: Where Opportunity Meets Precision
🔥 BTCUSDT.P: Liquidation of Highly Leveraged Longs
🌊 SOLUSDT.P: SOL's Dip - Your Opportunity
🐸 1000PEPEUSDT.P: Prime Bounce Zone Unlocked
🚀 ETHUSDT.P: Set to Explode - Don't Miss This Game Changer
🤖 IQUSDT: Smart Plan
⚡️ PONDUSDT: A Trade Not Taken Is Better Than a Losing One
💼 STMXUSDT: 2 Buying Areas
🐢 TURBOUSDT: Buy Zones and Buyer Presence
🌍 ICPUSDT.P: Massive Upside Potential | Check the Trade Update For Seeing Results
🟠 IDEXUSDT: Spot Buy Area | %26 Profit if You Trade with MSB
📌 USUALUSDT: Buyers Are Active + %70 Profit in Total
🌟 FORTHUSDT: Sniper Entry +%26 Reaction
🐳 QKCUSDT: Sniper Entry +%57 Reaction
📊 BTC.D: Retest of Key Area Highly Likely
📊 XNOUSDT %80 Reaction with a Simple Blue Box!
📊 BELUSDT Amazing %120 Reaction!
📊 Simple Red Box, Extraordinary Results
📊 TIAUSDT | Still No Buyers—Maintaining a Bearish Outlook
📊 OGNUSDT | One of Today’s Highest Volume Gainers – +32.44%
📊 TRXUSDT - I Do My Thing Again
I stopped adding to the list because it's kinda tiring to add 5-10 charts in every move but you can check my profile and see that it goes on..

BTCUSDT Market Analysis UpdateBINANCE:BTCUSDT Hi everyone, I hope you are doing well and I have put my opinion in Bitcoin price on the chart for you. and hope this helps you! Simple, concise, useful
Bitcoin (BTCUSDT) has broken below a key trendline, and we are now seeing a potential retracement towards a demand zone around $66,771.5, which could act as a strong support level.
Breakdown & Retest: BTC has fallen below a significant trendline, confirming a bearish move. A possible retest of this zone before further decline is likely.
Long Entry Consideration: If price stabilizes and shows bullish confirmation at the highlighted demand zone, it could provide a strong long opportunity.
Bearish Scenario: A clean breakdown of this level could signal further downside potential, requiring caution before entering long positions.
RSI Oversold? The RSI is showing a potential reversal area, but confirmation is key before making any trades.
📉 Waiting for confirmation before entering!
Let me know your thoughts in the comments!
Best regards

DeGRAM | BTCUSD continues to move in the channel📊 Technical Analysis
● 108.7-109 k has held for the fourth time, flipping the purple retest line into solid support; each bounce prints a higher low, sketching a rising triangle inside the medium-term channel.
● A 6 h close above the triangle cap at 111.2 k should unleash a measured 13 k thrust toward the channel’s roof / red supply at ≈122 k.
💡 Fundamental Analysis
● Glassnode shows another 24 k BTC left exchanges in May while US spot ETFs recorded five consecutive inflow days, tightening tradable supply even as macro volatility fades.
✨ Summary
Buy 108-110 k; breakout >111.2 k targets 115 k → 122 k. Invalidate on a 6 h close below 105 k.
-------------------
Share your opinion in the comments and support the idea with a like. Thanks for your support!

BTC breakout soon and return to ATH💎 Update Plan BTC (May 29)
Notable news about BTC:
The overall cryptocurrency market capitalization has remained relatively stable over the past 24 hours, hovering near the $3.42 trillion level. Digital assets appear largely indifferent to the recent rally in equities, as gains in traditional markets are driven by corporate earnings and tariff-related developments rather than shifts in monetary policy or liquidity conditions. Meanwhile, the US Dollar is strengthening for a third consecutive session, adding further pressure.
Bitcoin (BTC) has pulled back from the upper end of its recent trading range near $110,000, settling closer to the $107,000 mark. This pause near previous highs has helped ease short-term market overheating. As institutional participation in Bitcoin deepens, its price behavior is increasingly mirroring that of traditional financial instruments like equities and commodities—marked by more tempered momentum and fewer fear-driven surges.
Technical analysis angle
It is still a 107k bumper area that brings profits to Buyer. But the worrying thing here is that the vertices of BTC are lower.
We will have two scenarios for BTC:
) First within the next 1 week, the organizers still go in this flag model and gradually narrow towards the top. If the price line follows this model, it will be negative for BTC and investors
) Secondly: BTC price will breakout area 109k, the target will go straight to 113k-115k and lower boundary if Breakout area 107k will return to 102k-100k
🔥BTC 4H is currently in the adjustment phase, this time will cause a lot of traders, Future - Margin to lose money, this rhythm will last long
At this time, whether new or old, should spend more time to practice, load more knowledge about the PTKT, as well as find knowledge posts at the channel ..., to strengthen the solid foundation, as well as avoid losing money at this time offline
==> Comments for trend reference. Wishing investors successfully trading

GEC gecko inu ready for pump IHNS pattern, volume increase significantly is a sign of reversal 🚀🛰
NFA!DYOR!

#BTC/USDT#BTC
The price is moving within a descending channel on the 1-hour frame, adhering well to it, and is on its way to breaking it strongly upwards and retesting it.
We are seeing a rebound from the lower boundary of the descending channel, this support at 106792.
We have a downtrend on the RSI indicator that is about to break and retest, supporting the upward trend.
We are looking for stability above the 100 moving average.
Entry price: 107234
First target: 108262
Second target: 109748
Third target: 111298

BTC/USDT Technical Analysis and Trade Idea📉 BTC Pullback or Full Reversal? Let's Break It Down 🔍
Looking at the Bitcoin chart right now, we’re seeing more than just a minor pullback. On the 30-minute timeframe, there’s a clear bearish market structure shift setting in. In my opinion, this isn't a quick dip before continuation — we may be in for a deeper retracement. 🧐
When we overlay NASDAQ (which Bitcoin is often closely correlated with), it becomes even clearer — tech stocks look overextended and are showing signs of a potential pullback. 📉
So here’s the plan:
If BTC pulls back into my point of interest, I’ll be watching for a bullish break of structure to consider a long position. Simple, structured, and in line with what the charts are telling us. 🔁💹
⚠️ As always, this is not financial advice — just sharing how I'm reading the market right now.
💬 What are your thoughts? Are you watching the same levels? Drop a comment below 👇 and let’s talk trade setups! 🚀

Bitcoin & Stock Market Rally Together .. My Trade Plan!🚨 Bitcoin Update! 🚨
Taking a look at the BTC chart 🧠📈 — we saw a sharp retracement followed by a strong rally 💥🔥, likely driven by recent tariff policy shifts 🌍📊.
Right now, I’m leaning bullish 🐂 — especially with the stock markets also pushing higher 📈💹. But let’s be clear: my bullish bias depends on the stock market holding strong 🛡️📊.
I’m keeping an eye out for a pullback to the 61.8% Fibonacci level 🌀 for a potential buy opportunity 💸🚀.
⚠️ This is not financial advice — just sharing my outlook!
👇 Let me know what you think in the comments!
