Btcusdanalysis
DeGRAM | BTCUSD holding $104K📊 Technical Analysis
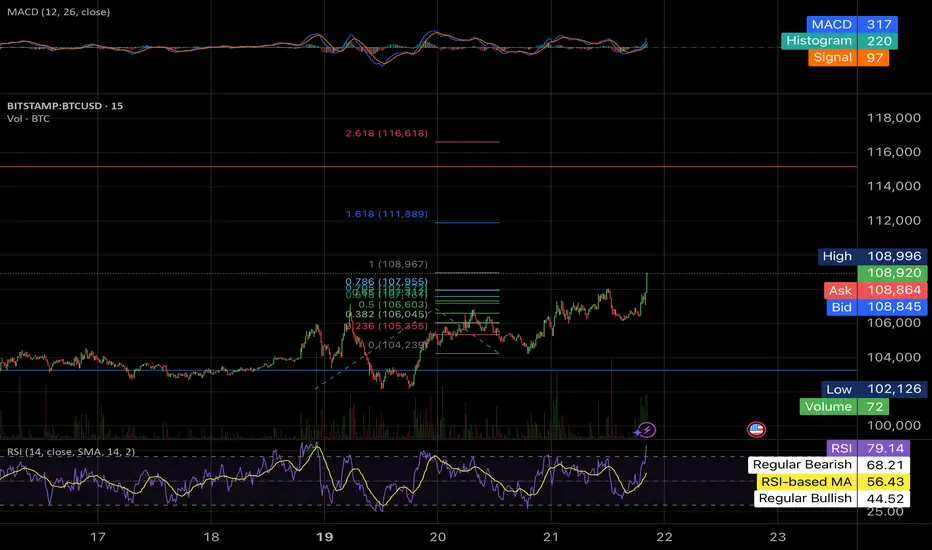
● BTC again defended the 104 k-104.3 k flip-zone and long-term purple trend-line, printing a fourth higher-low inside the 7-month rising channel.
● Price is coiling in a tight bullish pennant beneath April’s high; a breakout aligns with the channel ceiling and projects toward the 112.5 k supply band.
💡 Fundamental Analysis
● CME BTC-futures open-interest hit a record this week, while Glassnode shows exchange reserves at a 6-year low—evidence of both leveraged and spot accumulation supporting upside continuation.
✨ Summary
Higher-low + record OI favour longs: accumulate 104-105 k, objectives 108 k ➜ 112.5 k, risk controlled on a close below 100.6 k.
-------------------
Share your opinion in the comments and support the idea with a like. Thanks for your support!

Bearish Reversal Confirmed – BTC Rising Wedge TrapBitcoin (BTCUSD) on the 1H timeframe is displaying a bearish reversal structure after failing to sustain a breakout above key resistance. The recent price action has formed a Rising Wedge Pattern, which typically precedes a downside correction, especially when formed near a key supply zone. Let’s break down the setup:
🔍 Technical Analysis Overview:
🔹 1. Rising Wedge Pattern (Bearish)
A rising wedge is visible near the top of the recent bullish impulse. This wedge is characterized by converging trendlines with higher highs and higher lows, but with diminishing momentum. It typically signals a weakening uptrend and a potential trend reversal or correction once price breaks below the lower wedge boundary.
The breakout to the downside has already begun, confirming bearish intent.
🔹 2. SR Interchange Zone
The blue zone marked in the chart represents a Support-Resistance Interchange (SR Flip). This was previously an area of consolidation and breakout, acting as a key decision zone. Price is expected to retest this zone after the wedge breakdown before continuing further down.
This creates a perfect "Break → Retest → Drop" scenario, often favored by institutional and swing traders.
🔹 3. Consolidation Structure
Before the wedge formation, Bitcoin was stuck in a prolonged consolidation phase. This type of ranging price action often accumulates orders before a breakout. Once broken, these zones serve as magnets for pullbacks or liquidity grabs, and are frequently retested.
🔹 4. Target Zone
The measured move from the rising wedge pattern points to a target near $101,617, which aligns with a previous structural low and a potential demand zone. This area could serve as the next major support level.
🎯 Trade Strategy & Setup:
Entry: After confirmation of breakdown and a clean retest of the SR zone.
Stop Loss (SL): Just above the wedge high and structural resistance (~$108,020).
Target (TP): $101,617 (downside projection based on wedge height and price structure).
📌 Risk-Reward Setup: 1:3+ possible if retest confirms.
🧠 Trader’s Insight:
This setup reflects a common smart-money behavior where price forms a bullish-looking structure (rising wedge), entices buyers, and then traps them with a swift breakdown. The SR retest provides a low-risk shorting opportunity. Patience is key — let price come to your level before entering.
🚨 Risk Note:
If BTC reclaims and holds above the $108,020 level, the bearish thesis may be invalidated. Always wait for confirmation before execution.

Bitcoin BTC Bullish Setup: Here’s What I’m Watching Next!Bitcoin (BTC) is looking incredibly strong right now on the higher timeframes 🔥. We’re seeing a clear bullish trend with consistent higher highs and higher lows, which keeps my bias firmly to the upside 🚀...
In this video, I take you through my full multi-timeframe analysis, breaking down:
- The macro bullish structure unfolding on the daily chart 🗓️
- My key levels of interest for a potential pullback entry 🎯
- What I’m watching for on the 4H and 1H charts to confirm continuation setups ⏱️
- My target zones, including recent swing highs and areas of liquidity 📍
If Bitcoin gives us a healthy retrace, I’ll be watching closely for a bullish break of structure to confirm a high-probability buy opportunity 🟢.
⚠️ Reminder: This is not financial advice — always do your own research and manage your risk appropriately. 🛡️💼

$BTC 4H Outlook – Holding the Trendline or Losing Momentum?Bitcoin just saw a strong rejection from the upper resistance zone (highlighted in red), forming a sharp wick after a quick pump.
✅ Key support has held for now, aligning with both the ascending trendline and moving average — historically zones of strong buyer interest (green circles).
⚠️ What’s next?
A 4H candle close above the resistance zone is crucial for bullish continuation.
Failure to close above = potential fakeout and downside pressure.
Eyes on the next reaction — will we see the same buying volume kick in again from support?
📌 Watch closely – confirmation will shape the next move.

#BTC/USDT Highest Daily Close! What it Means? $117k on cards?Bitcoin Daily Update – Bulls Take the Lead
Bitcoin just recorded its highest daily close in history at $106,849.99 (Binance), surpassing the previous record of $106,143.82 set on January 21st. While the difference is minor in percentage terms, it's still a meaningful win for the bulls.
The next key level to watch is $113k to $117k, based on the Fibonacci extension target.
For confirmation, we need another solid daily candle close above the current range. The $106K resistance has already been broken, and BTC is holding above it, indicating strong bullish momentum.
To avoid getting trapped in a fakeout, consider adding the 14 EMA to your chart. As long as BTC holds above this EMA, the uptrend is likely to continue.
Once BTC's show is over, Altcoins will likely follow suit.
INVALIDATION OF THIS CHART: A close below $102k in confluence with 14EMA in Daily.
I hope this update gives you actionable insight. If it did, feel free to follow and like. Let me know your thoughts or questions in the comments, I read every one.
Thank you
#PEACE

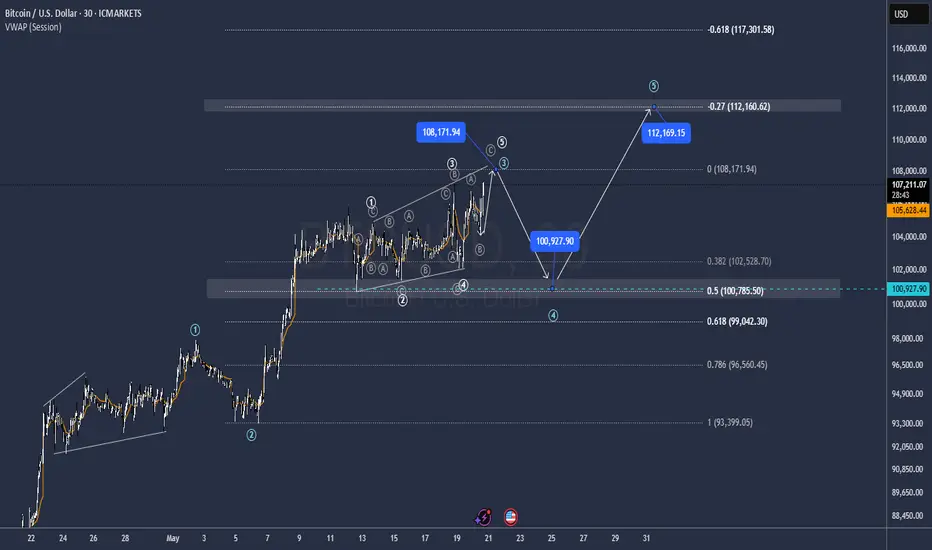
Botcoin Deep Pullback and RebuyNice and Clear entries on the end of this Diagonal
After completion We should get a deep Pullback and then another Push Up
Levels in the Chart
GG
BTC/USDT Long Trade SetupBINANCE:BTCUSDT.P
Entry 104460
SL 104100
TGT 106840
W Pattern Trade with Fibo 0.5 rejection

BTC/USD Eyes Breakout Analysis On Weekly Time Frame.Bitcoin (BTC/USD) Weekly Chart Analysis
After facing a long term resistance at 70,000$ which was significant barrier for Bitcoin in the past, breakout occurred recently, indicating a strong bullish signal and a shift in market structure.
BTC is currently trading around $103,025, facing a new resistance zone.
as the fundamental shows that it may break the resistance again after scalping and we may see the bitcoin at the 120,000$.
But the technical analysis indicates that we may see a retest her to validating the zone now as support.
After the breakout, BTC faced selling pressure around the $105,000–$110,000 range, creating a new resistance zone.
If the resistance is not breached, there is the possibility of a rejection occurring which may result in a retracement down to $79,902, which would be a 28.72% drop.
And i think From there if the resistance isn’t broken out of, then it’s most likely a rejection comes and we can expect a fall back to $79,902 which is a 28.72% retracement.
A breakout above the current resistance could trigger a 46% rally towards the $120,409 target.
This would continue the bullish trend post-breakout, supported by momentum and volume.
we will stay focused here and wait for the breakout of the resistance.

Btc short analysis successfully target reached. Trust on my analysis target 🎯 reached successfully
1000+pips profit booked
Enrty at 83800
Tp at 82300

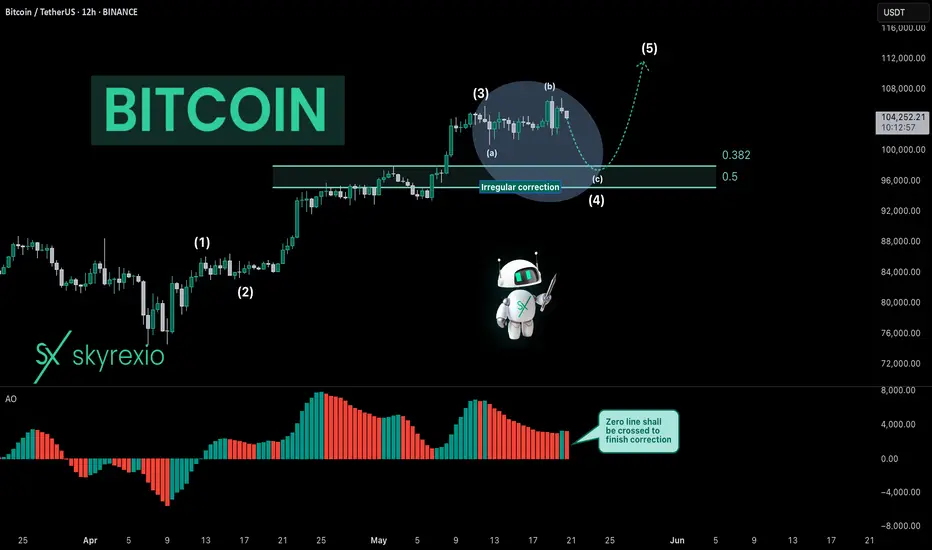
Bitcoin Is Printing Irregular CorrectionHello, Skyrexians!
Despite the negative comments that BINANCE:BTCUSDT will pump instead of my bearish prediction and Saylor's Bitcoin purchases I am going to follow my scenario - nothing has changed. Based on my experience price now is printing the most difficult shape of correction - irregular ABC.
In recent analysis I explained why we shall use now 12 hours time frame. On this time frame Awesome Oscillator shall cross zero line to finish correction. Target for irregular correction usually at 0.38 Fibonacci at $97.5k, but also can touch $95k with the wick.
Best regards,
Ivan Skyrexio
___________________________________________________________
Please, boost this article and subscribe our page if you like analysis!
Bitcoin Short Setup –Supply Zone Rejection Trade Plan (1H Chart)(BTC/USD – Technical Setup)
🔵 Trend Setup:
⬆️ Resistance Line – Price is struggling to break above this level.
⬇️ Support Line – Price bounced several times here before breaking down.
🟢 EMA 70 – Currently around 104,435.9, acting as dynamic support/resistance.
📍 Key Levels:
🔴 Stop Loss Zone:
107,488.4 to 107,402.4
(🚨 Strong resistance, limit losses!)
🟡 Entry Point:
106,026.8
(🟨 Inside the Supply Zone – Ideal for Sell)
🟦 Supply Zone:
106,026.8 to 107,402.4
(⚠️ High selling pressure expected here!)
🔵 Break of Structure (BOS):
Price broke below the rising support line
(📉 Bearish confirmation!)
🎯 Target Point:
99,000.0
(💰 Take Profit Target!)
🔻 Trade Idea:
SELL at 106,026.8
🛑 Stop Loss: 107,488.4
✅ Target: 99,000.0
Risk-Reward looks solid.
This is a short setup expecting a drop after a retest of the supply zone.

BTCUSDT - Smart InvestorPrudent investors observing BTCUSDT will note the blue box I have highlighted on the chart. It represents a particular juncture where, should market action decisively penetrate this upper boundary, we might witness a rather substantial appreciation in price.
Retracement will be lower but I think risk reward is very good.
Now, the intelligent investor does not engage in speculation based merely on lines drawn on a chart. However, such zones can serve as important indicators of potential shifts in market sentiment and buying pressure. A breakout above this defined area, accompanied by what one might term 'significant volume' a confirmation of genuine interest and not mere fleeting enthusiasm would suggest a possible continuation of an upward trend.
It is crucial, of course, to await confirmation. A breach of this resistance level that is not sustained, a 'false breakout' as some call it, can be a trap for the unwary. Therefore, diligent observation of subsequent price action, particularly on shorter timeframes, is warranted. A successful retest of the broken resistance as a new level of support would lend further credence to the bullish thesis.
One should also consider the underlying fundamentals, to the extent that such a nascent asset class allows. However, in the realm of technical analysis, these zones of potential breakout offer a visual representation of where supply may be overcome by demand.
Therefore, should BTCUSDT indeed break through this blue box with conviction, it would suggest a potential for a robust upward movement. But remember, the intelligent approach is one of caution and confirmation, not impulsive action. We observe, we analyze, and we act only when the evidence supports a calculated move.

BTC/USD Bearish Setup – Trendline Retest Before the Fall?🔍 Technical Breakdown – BTC/USD 3H Timeframe
Bitcoin is displaying a textbook Double Top pattern formation on the 3-hour chart, signaling a potential bearish reversal after a strong bullish run. This classic pattern suggests buyer exhaustion and sets the stage for a downward move. Let's break down the analysis:
🧠 Pattern Insight: Double Top Reversal
A Double Top is one of the most reliable trend reversal patterns, especially when it forms after a sustained uptrend — just like we're seeing here.
Top 1 and Top 2 both formed inside a strong Resistance Zone between $106,500 and $107,000, showing repeated rejection from buyers to push price higher.
The formation of lower highs and long wicks near Top 2 further reinforce the weakening bullish momentum.
💥 Neckline Breakdown & Bearish Trigger
The Neckline, aligned with a horizontal Support Zone (~$103,300–$103,800), was decisively broken, confirming the pattern.
This breakdown acts as the trigger for bearish entries, and we are now in the "Retest Phase", where price often pulls back to the neckline or a nearby trendline before continuing lower.
📐 Trendline Confluence – Retest Opportunity
A short-term descending trendline drawn from Top 2 intersects near the neckline zone.
Price is now approaching this confluence area, offering a potential high-probability short entry if bearish price action confirms (e.g., a rejection candle like a bearish engulfing or pin bar).
🎯 Price Targets & Trade Setup
Parameter Value
📍 Entry On bearish confirmation near neckline/trendline retest (~$105,300)
❌ Stop Loss (SL) Above recent swing high / Top 2 (~$107,100)
🎯 Target ~$97,126 (based on measured move from top to neckline projection)
⚖️ Risk:Reward Approx. 1:3 or better (depending on entry timing)
Measured Target Calculation:
Height from neckline to peak (~$107,000 - $103,500 = $3,500)
Target = Neckline break - height = ~$103,500 - $3,500 = $97,000–$97,100
🔥 Market Context & Psychological Edge
This chart structure reflects a shift in market sentiment. What was once strong bullish momentum is now hesitating — with buyers failing to make higher highs and sellers stepping in aggressively. The double top is not just a pattern, it's a narrative of exhaustion and reversal.
“Let price confirm your bias. Don't just predict; react to structure and behavior.”
Being patient and letting the retest play out is crucial. Don’t rush in early — let the market give you a clean signal. This is where technical discipline pays off.
⚠️ Risk Management Notes
Crypto markets are highly volatile — avoid oversized positions.
A failed double top can lead to a bullish continuation, so SL discipline is key.
Wait for confirmation — candlestick patterns, momentum shifts, or bearish volume spikes can add confidence.
📌 Summary
✅ Pattern: Double Top
✅ Confirmation: Neckline Break
🔄 Current Phase: Retesting Neckline/Trendline
📉 Bias: Bearish
🎯 Target: ~$97,100
❗ SL: Above Top 2
💬 What do you think? Are we headed to GETTEX:97K or is this just a fakeout? Drop your thoughts below and don’t forget to like and follow for more trade setups!

$BTC.D : Have we seen the top or a local top in the $BTC.D ? CRYPTOCAP:BTC has been a recent bull run and trying to reclaim the ATH of 107K USD. Currently firmly above 100K the Crypto currency looks very bullish in the near to medium term. But what we have seen is an the CRYPTOCAP:BTC.D chart is having an initial hiccup in this later part of the cycle. For the first time in the last few quarters there has been a back to back 2 weeks where CRYPTOCAP:BTC.D has 2 red candles. CRYPTOCAP:BTC.D reached it local peak of 65.3% which we have closely predicated in this blog space many weeks ago. We said the target for CRYPTOCAP:BTC.D for this cycle is 66%. We came close to 66% and since then we are seeing weakness in the CRYPTOCAP:BTC.D chart.
Now the question comes was that the top in CRYPTOCAP:BTC.D chart ? My take is that this is a local top. We might see some weakness in CRYPTOCAP:BTC.D in the upcoming weeks. Then we will again bounce back to break above the 66% decisively before this cycle comes to an end.
Verdict : CRYPTOCAP:BTC.D achieved a local top. Cycle top taget remains above 66%. Long term bullish on $BTCUSD.

Bitcoin has recently touched its weekly Fair Value GapBitcoin (BTC) Market Update
Bitcoin has recently touched its weekly Fair Value Gap (FVG) and is now showing upward momentum. This price behavior is aligning with a potential transition from an Intermediate Reversion Level (IRL) to an Extended Reversion Level (ERL), suggesting the formation of a structured bullish model.
Given the current positive market sentiment surrounding BTC and the fact that the asset has already absorbed significant sell-side liquidity, the potential for further upward movement remains strong. There is a possibility that the market could aim for the 110K level in the near term if bullish conditions persist.
Investors and traders are advised to monitor the market closely as this structure develops, considering both technical indicators and macroeconomic influences to make informed decisions.
DYOR!

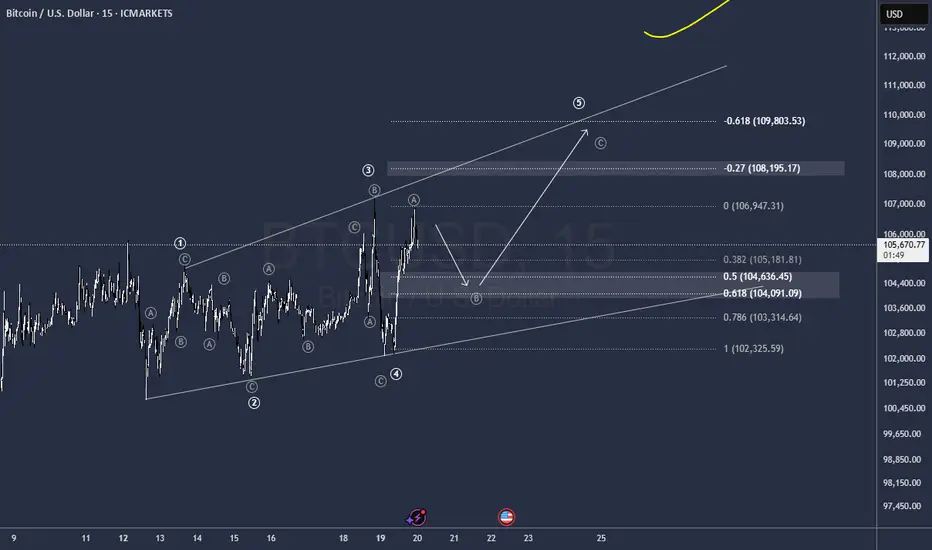
Well pk, Ending Diagonal, still the move is upUnpredictable Ending Diagonal But it is still up
Buy levels 104.600 / 104.100
Take Profits Levels 108.100 / 109.800
$108K BTC ATH in Sight Despite ETF & Moody's HeadwindsBitcoin's Turbulent Ascent: Charting a Course Through Volatility, Institutional Embrace, and the $108,000 Horizon Amid Shifting Economic Sands
The world of cryptocurrency is once again fixated on its undisputed leader, Bitcoin (BTC). The digital behemoth is currently navigating a period of intense market activity, marked by dramatic price swings, a nuanced evolution in institutional engagement, and a striking resilience in the face of macroeconomic tremors. As Bitcoin flirts with the $102,900 threshold and repeatedly tests the crucial $104,000 psychological barrier, the air is thick with anticipation. Market analysts and enthusiasts alike are closely watching for a potential surge that could propel Bitcoin beyond its previous all-time high (ATH) to an ambitious $108,000 within the current month. This intricate dance unfolds against a complex global backdrop: a recent downgrade of US debt by Moody's, significant and strategic Bitcoin accumulation by institutional players like Japan's Metaplanet, and observable shifts in the open interest of Bitcoin Exchange Traded Funds (ETFs).
The narrative for Bitcoin in May 2025 is one of inherent strength and heightened expectation. While a recent, sharp pullback from the $107,000 mark was widely attributed to investors capitalizing on recent gains—a classic profit-taking maneuver—rather than a panicked reaction to Moody's revised outlook on US debt, the digital asset staged a swift and impressive recovery, climbing back towards the $105,000 level. This rapid rebound underscores a complex interplay of market forces, investor sentiment, and perhaps a growing perception of Bitcoin as an asset with unique characteristics. This resilience, buttressed by robust underlying network fundamentals and an increasingly confident institutional presence, paints a compelling and multifaceted picture of Bitcoin's current trajectory and its potential future.
Navigating Price Swings: Profit-Taking, Market Maturity, and a Dismissal of Moody's Downgrade
Bitcoin's recent price journey has been nothing short of a rollercoaster, a testament to its well-documented volatility. However, these fluctuations also hint at a market that is gradually maturing in its response to external economic shocks. The digital currency experienced a notable dip, with some initial commentary linking it to a broader "risk-off" sentiment ostensibly triggered by Moody's downgrade of US sovereign debt. Indeed, Moody's Investors Service adjusted the U.S. government's long-term issuer and senior unsecured ratings from the pristine AAA to Aa1. The agency cited mounting concerns over the nation's escalating debt burden and the sustainability of its interest payments, a move that traditionally sends ripples of caution through global financial markets, often prompting investors to reduce exposure to assets perceived as higher risk.
However, the narrative surrounding Bitcoin's reaction quickly evolved. The sharp sell-off from its recent high near $107,000 was predominantly identified by market observers as a consequence of profit-taking. Investors who had benefited from the preceding upward trend chose to realize their gains, a standard market dynamic in any asset class. This distinction is critically important. It suggests that the selling pressure was primarily an internal market mechanism within the cryptocurrency space itself, rather than a direct, sustained erosion of confidence directly attributable to the US debt downgrade.
In a remarkable display of this independent strength, Bitcoin demonstrated a robust recovery, rallying back towards the $105,000 mark. This price action was widely interpreted as Bitcoin effectively "ignoring" or "shrugging off" the downgrade's potential long-term implications for its own valuation. Some market analysts posit that this behavior lends further credence to Bitcoin's burgeoning role as a potential hedge against instability in traditional financial systems and a perceived decline in the long-term purchasing power of fiat currencies. While Bitcoin's price did exhibit a corrective phase around the time of the downgrade announcement, its capacity to swiftly regain lost ground suggests that the market may have either already factored in such macroeconomic developments or, more significantly, views Bitcoin's fundamental, long-term value proposition as increasingly detached from traditional economic indicators. The market's reaction, characterized by an initial dip followed by a spirited recovery, highlights Bitcoin's complex and evolving relationship with macroeconomic news. It behaves at times like a risk asset, sensitive to global liquidity and investor sentiment, and at other times, it exhibits characteristics of a safe-haven asset, sought after during periods of uncertainty.
The Alluring Prospect of a New Zenith: Is $108,000 Bitcoin's Next Landmark?
Amidst this characteristic volatility, a palpable undercurrent of optimism pervades the Bitcoin market. Strong suggestions and analytical forecasts point towards the possibility that Bitcoin could not only retest but decisively surpass its previous all-time high, potentially charting a course towards $108,000, and perhaps even higher, within the current month. Technical analyses, which scrutinize historical price patterns and market statistics to predict future movements, lend support to this bullish outlook. Some chartists and forecasters have identified take-profit targets for bullish positions clustering around the $109,158.98 region.
Currently, Bitcoin's price appears to be in a consolidation phase, hovering around the $102,957 mark after a retreat from a local peak of $107,115. Market participants are intensely focused on key resistance levels. The zone between $105,000 and $108,700 is viewed as a particularly critical hurdle. A decisive daily trading session closing above the $108,700 level could act as a powerful catalyst, potentially triggering a fresh wave of buying interest and propelling Bitcoin towards the $110,000 milestone. Should this momentum be sustained, a further ascent to $115,000 by the end of May is considered a plausible scenario by optimistic analysts.
This bullish sentiment is further amplified by what some market commentators describe as Bitcoin's "volatile liquidity run." This phenomenon, characterized by rapid shifts in market liquidity and price, is believed by some analysts to be capable of paving the way for new record highs. The market has recently observed unusual trading patterns, such as CME (Chicago Mercantile Exchange) Bitcoin futures contracts leading volatile price action, even during weekend trading sessions when traditional markets are closed. This indicates a dynamic and continually evolving market structure, increasingly influenced by institutional-grade trading venues.
Historically, Bitcoin's price has demonstrated a notable correlation with global liquidity conditions, particularly metrics like the M2 money supply. Expansions in M2, representing a broader measure of money in circulation, have often coincided with upward trends in Bitcoin's price. While current expansions in M2 could theoretically provide a tailwind for Bitcoin, the future trajectory of global liquidity is somewhat clouded by persistent inflation concerns and mixed signals from various economic sectors. Nevertheless, the potent combination of strong technical chart patterns, the potential for favorable liquidity conditions, and a resilient underlying market sentiment keeps the prospect of a new all-time high firmly within the realm of possibility. Analysts are keenly eyeing the $108,000 mark as a significant psychological and technical target. A convincing breakout above this level could potentially unleash further euphoric momentum, drawing in more retail and institutional capital.
The Institutional Equation: ETF Open Interest Moderates, While Metaplanet Intensifies Accumulation
The role and behavior of institutional investors continue to be a pivotal factor shaping Bitcoin's market dynamics and its journey towards mainstream acceptance. Recently, a noteworthy development was observed in the Bitcoin ETF space: open interest saw a 5% dip, settling at approximately $29.47 billion. This occurred even as Bitcoin itself maintained its price position near the $102,900 level. This decline in open interest, which represents the total number of outstanding derivative contracts that have not been settled, coupled with a discernible slowdown in weekly inflows into Bitcoin ETFs (which were reported as the lowest in a month, at $603.74 million for the period of May 12-16), suggests a degree of caution or perhaps a phase of consolidation among ETF investors. This follows a period of particularly heightened activity and significant inflows earlier in the year, often associated with the launch and growing popularity of spot Bitcoin ETFs in major markets. The relatively rangebound trading of Bitcoin, oscillating primarily between $102,711 and $104,971 during this period, likely contributed to this softer, more measured demand for ETF exposure.
However, it would be premature to interpret this dip in ETF open interest as a signal of a broader or sustained institutional retreat from Bitcoin. Activity in the derivatives markets, for instance, paints a more nuanced, and in some aspects, more bullish picture. Strong demand for call options, which give buyers the right but not the obligation to buy Bitcoin at a specific price in the future, indicates that a segment of sophisticated traders is actively positioning for an upward price movement, with some targeting levels around $110,000. In futures markets, when open interest rises in tandem with price, it typically signals that new capital is entering the market, reinforcing the strength and conviction behind the prevailing trend.
Contrasting sharply with the moderation observed in ETF flows is the aggressive and strategic accumulation of Bitcoin by corporate entities, most notably exemplified by Metaplanet. The Japanese investment firm recently captured headlines with its announcement of an additional purchase of 1,004 Bitcoin. This transaction marked its second-largest single acquisition of the cryptocurrency to date. This significant purchase, valued at approximately $104.3 million at the time of execution, increased Metaplanet's total Bitcoin holdings to an impressive 7,800 BTC. This substantial stash is currently worth over $800 million, fluctuating slightly with market prices but generally estimated between $806 million and $807 million. The company disclosed that its average acquisition price for this latest tranche of Bitcoin was around 15.13 million Japanese yen per BTC. Crucially, its overall average cost per BTC for its entire holdings now stands at approximately $91,340.
Metaplanet's Bitcoin strategy is notably ambitious and long-term in its orientation. The company has publicly stated its goals of accumulating 10,000 BTC by the end of 2025 and has even hinted at a more audacious long-term vision of potentially holding up to 1% of the total global Bitcoin supply. This proactive accumulation positions Metaplanet as a significant corporate holder of Bitcoin, particularly prominent within the Asian financial landscape. Its approach has drawn frequent comparisons to that of Strategy (formerly MicroStrategy), the US-based software intelligence firm renowned for its pioneering and substantial investments in Bitcoin as a primary treasury reserve asset.
Such large-scale corporate buying, as demonstrated by Metaplanet and Strategy, can exert considerable upward pressure on Bitcoin's price. By acquiring and holding substantial amounts of BTC, these corporations effectively reduce the freely circulating supply available on exchanges, a phenomenon sometimes referred to as exerting deflationary pressure, especially when corporate and even governmental buying activity is rapid and sustained. Metaplanet's actions, alongside those of other forward-thinking firms, underscore a growing and significant trend: the diversification of corporate treasuries into digital assets. These companies increasingly view Bitcoin not just as a speculative investment, but as a strategic reserve asset, a potential hedge against inflation, and a safeguard against the perceived long-term devaluation of fiat currencies. This movement has seen a notable surge in Bitcoin holdings by businesses globally, particularly since early 2024, signaling a paradigm shift in how corporations manage their financial reserves.
The Bedrock of Bitcoin: Network Health, Hashrate Resilience, and Expanding Mining Margins
Beneath the often-turbulent surface of price charts and the ebb and flow of institutional capital, the fundamental health and security of the Bitcoin network itself remain remarkably robust. Investment banking giant JPMorgan recently reported that the Bitcoin Network Hashrate experienced a slight but discernible rise in the first two weeks of May. The average hashrate during this period was noted at 88.5 Exahashes per second (EH/s), representing a 2% increase. Other data sources from the blockchain analytics community corroborate this trend, showing the daily hashrate reaching even higher levels, such as 831 EH/s as of May 1, 2025, and even peaking at an impressive 921 EH/s earlier in the month. This represents a significant increase from the lows observed in 2024. As of May 15, 2025, the Bitcoin Network Hash Rate was recorded at approximately 864.51 million Terahashes per second (TH/s), which translates to 864.51 EH/s. This continued upward trajectory in computational power dedicated to the network, even in the aftermath of events like the Bitcoin halving (which reduces the block rewards issued to miners), underscores the sustained confidence of miners and contributes directly to the network's formidable security.
Adding to this positive picture, mining gross margins have reportedly expanded sequentially throughout this month. JPMorgan's analysis highlighted that as Bitcoin prices appreciated, miners' gross profit margins also saw a month-on-month expansion, leading to improved economic conditions for those securing the network. The "hash price," a key metric representing daily mining profitability per unit of hash power, increased by a notable 13% when compared to April's figures. In the initial two weeks of May, Bitcoin miners earned approximately $50,100 per EH/s in daily block rewards (which includes both newly minted bitcoins and transaction fees). This figure is up 13% from the previous month and shows a 3% year-on-year increase.
This financial viability is crucial. It enables miners to continue investing in their operations, which includes covering significant energy costs and upgrading their specialized hardware (ASICs – Application-Specific Integrated Circuits) to maintain competitiveness and efficiency. Leading manufacturers like Bitmain and MicroBT continuously release more powerful and energy-efficient mining rigs. The fact that the market price of Bitcoin remains significantly higher than the average cost of mining (estimated by some analyses to be around $36,800 per BTC) indicates a healthy profit margin for the mining industry. These margins are comparable to those observed at the beginning of previous bull market cycles, further fueling optimism. Some publicly traded mining companies, such as LM Funding, have reported improved mining margins in the first quarter of 2025, successfully navigating the headwinds from the halving event through operational improvements, strategic power agreements, and in some cases, diversifying revenue streams like power sales.
The Untamed Frontier: Meme Coins and the Curious Case of BTC Bull Token
While Bitcoin, with its established infrastructure and growing institutional adoption, commands the lion's share of attention, the broader cryptocurrency ecosystem continues to be a fertile ground for innovation, experimentation, and, undeniably, speculation. One of the most prominent and often controversial manifestations of this is the meme coin phenomenon. The question frequently arises in online forums and social media: "Best Meme Coins like BTC Bull Token Next to Surge?" This highlights the persistent allure of these unique digital assets. Meme coins are a distinct category of cryptocurrency, typically inspired by internet memes, viral social media trends, or popular culture. Their value is often driven less by intrinsic utility or underlying technological fundamentals and more by community-generated hype, speculative fervor, and the quest for rapid, exponential gains. They are infamous for their extreme volatility, capable of producing meteoric price surges in short periods, but also equally susceptible to precipitous crashes.
BTC Bull Token ($BTCBULL) has emerged as a specific example within this highly speculative niche. It has positioned itself with taglines such as "the official Bitcoin meme coin" or a "Bitcoin-themed meme coin," attempting to leverage the brand recognition and market sentiment surrounding Bitcoin itself. Its core proposition appears to be a system of rewarding its token holders with airdrops of actual Bitcoin when BTC achieves certain predetermined price milestones (for example, when Bitcoin's price reaches $150,000, $200,000, or $250,000). Additionally, the $BTCBULL project outlines plans for token burn events. These events, designed to reduce the total supply of $BTCBULL tokens and theoretically increase their scarcity, are scheduled to occur when Bitcoin's price increases by specific increments (e.g., for every $25,000 increase in Bitcoin's price, starting from a baseline of $125,000). Currently reported to be in its presale phase, projects like BTC Bull Token aim to capitalize on the excitement and upward momentum of Bitcoin bull runs. They offer a highly leveraged, and therefore highly risky, way for speculators to potentially profit from Bitcoin's upside.
It is absolutely paramount for anyone considering an allocation to meme coins, including those linked thematically to Bitcoin, to thoroughly understand their inherent high-risk, high-reward nature. These assets are, by definition, intensely speculative. They are highly susceptible to "pump-and-dump" schemes, where coordinated buying inflates the price before early holders sell off en masse, leaving later entrants with significant losses. Many meme coins lack long-term viability, tangible real-world applications, or robust development teams. While the allure of quick, life-changing profits can be undeniably strong, the potential for substantial, and often total, financial loss is equally, if not more, significant. Prudent investors should approach such tokens with extreme caution, treating them more as a form of high-stakes gambling or digital entertainment rather than a serious, fundamentally-driven investment. Due diligence, a clear understanding of the risks involved, and an investment amount one can afford to lose are critical prerequisites.
Weaving the Narrative: A Complex Market of Resilience, Adoption, and Speculation
The current Bitcoin landscape presents a fascinating and intricate tapestry, woven from a diverse array of threads. We observe robust price action that seems increasingly capable of defying or quickly recovering from macroeconomic pressures. There is the steady, albeit sometimes fluctuating, march of institutional adoption, most visibly through products like ETFs, but also through direct corporate treasury allocations. The unwavering commitment of long-term corporate accumulators, exemplified by firms like Metaplanet, adds another layer of demand. Underpinning all of this is the fundamental strength and security of the Bitcoin network itself, evidenced by a healthy and growing hashrate. And, at the periphery, the ever-present speculative fervor of the broader crypto market, including the volatile world of meme coins, adds a unique dynamism.
Bitcoin's demonstrated ability to absorb the potential shock of Moody's US debt downgrade and subsequently rally, largely on the back of what was identified as profit-taking, indicates a growing maturity within its market. It also suggests a potential decoupling, at least to some extent, from the reflexive reactions often seen in traditional financial markets. The widespread anticipation of a new all-time high, with many eyes fixed on the $108,000 level, is not without foundation. It is supported by various technical indicators, ongoing positive sentiment, and a persistent bullish undercurrent in many segments of the market. However, the recent dip in ETF open interest serves as a salient reminder that institutional sentiment can be subject to caution and re-evaluation, and that the path to higher valuations is rarely a straight, uninterrupted line. Corrections and consolidations are natural parts of any market cycle.
Metaplanet's aggressive Bitcoin acquisition strategy highlights a different, perhaps more profound, facet of institutional interest. This is not just about short-term trading or exposure to a new asset class; it's about a long-term conviction in Bitcoin's potential role as a strategic treasury reserve asset. Such a trend, if it continues to grow, could have a more sustained and significant impact on Bitcoin's supply and demand dynamics over time. Meanwhile, the healthy hashrate figures and reports of improving miner profitability provide a solid and reassuring foundation for the network's continued secure operation and the confidence of its participants.
The emergence and popularity of meme coins like BTC Bull Token, while arguably peripheral to Bitcoin's core value proposition and its aspirations as a global financial asset, reflect the undeniable speculative energy that often accompanies bull markets in the cryptocurrency space. It serves as a reminder of the diverse and sometimes bewildering ecosystem that Bitcoin anchors – an ecosystem that now ranges from highly sophisticated institutional financial products and regulated investment vehicles to community-driven, high-risk, and often ephemeral digital tokens.
Gazing Forward: A Market Poised for Potentially Defining Movements
As May 2025 continues to unfold, the Bitcoin market stands at a fascinating and potentially pivotal juncture. The confluence of technical factors, institutional behavior, network fundamentals, and macroeconomic influences creates an environment ripe for significant moves. Several key elements will be crucial to watch in the coming weeks and months:
• Price Action Around Critical Levels: Bitcoin's ability to decisively breach and, more importantly, hold above the formidable resistance zone generally identified between $105,000 and $108,700 will be a critical determinant of whether a new all-time high is imminent. A strong breakout could ignite further momentum. Conversely, key support levels, likely around the $100,000 to $102,000 range, must hold firm to maintain the prevailing bullish market structure. A break below these supports could signal a deeper correction.
• Institutional Capital Flows: Continued monitoring of inflows and outflows from Bitcoin ETFs, as well as changes in their open interest, will provide valuable insights into shorter-term institutional sentiment and positioning. Simultaneously, tracking further corporate accumulation by entities like Metaplanet and Strategy will offer signals regarding long-term conviction and the adoption of Bitcoin as a treasury asset.
• Network Fundamentals and Security: Sustained growth in the Bitcoin network hashrate and the maintenance of healthy mining economics will continue to be vital indicators of the network's underlying security, resilience, and the confidence of its core infrastructure providers. Any significant disruptions or negative trends in these areas could impact broader market sentiment.
• Overarching Macroeconomic Influences: While Bitcoin has demonstrated a degree of resilience, the broader global economic climate will undoubtedly continue to exert an influence. Key factors to watch include inflation data from major economies, monetary policy decisions from central banks (particularly regarding interest rates and quantitative easing/tightening), and any further significant developments related to sovereign debt or geopolitical stability.
• Prevailing Market Sentiment: The overall sentiment within the cryptocurrency market, as reflected in metrics like the Fear & Greed Index, activity in derivatives markets (funding rates, options skew), and the tenor of discussions within online communities and social media, will play a significant role in driving short-term price movements. This is particularly true for the more speculative assets within the ecosystem.
Bitcoin's journey is one of perpetual evolution, marked by innovation, debate, and dramatic market cycles. The current phase, characterized by ambitious price targets, strategic institutional chess moves, and robust underlying network strength, suggests that the coming weeks and months could be particularly pivotal in shaping its longer-term narrative. While the prospect of Bitcoin surpassing the $108,000 mark and venturing into new price discovery territory excites many participants, the asset's inherent volatility, coupled with the speculative elements that froth at the market's fringes, necessitates a balanced and informed perspective. Acknowledging both the transformative potential of Bitcoin and the considerable risks that continue to define its unique position in the global financial landscape remains essential for anyone navigating this dynamic space.

BTCUSDT New Analysisthis area, and based on its reaction to this zone, we can look for a buy setup. On the 15-minute timeframe, the price has a bearish order block, which could push it down toward the 4-hour support level. All the key levels and price movements are marked in the chart—you can check them.

DeGRAM | BTCUSD formed the triangle📊 Technical Analysis
● Pullback has tagged the purple mirroring-support / channel median (≈101 K) and printed a hammer inside the green “optimal-buy” box, preserving the sequence of higher lows since 25 Apr.
● Price is coiling in a bull-flag beneath the inner resistance band 104 K; a 1 h close above it activates a measured move to the red 106.9-109 K supply at the channel roof.
💡 Fundamental Analysis
● BlackRock’s IBIT added a net ≈2 900 BTC in two sessions while exchange balances hit a 3-year low (CryptoQuant), signalling renewed spot absorption.
● US 2-yr yield slipped back under 4.70 % after softer Philly-Fed survey, tempering the dollar bid and easing funding costs for crypto leverage.
✨ Summary
Buy dips 101-102 K; confirmation > 104 K targets 106.9 K → 109 K. Invalidate on a sustained break below 97.5 K.
-------------------
Share your opinion in the comments and support the idea with a like. Thanks for your support!

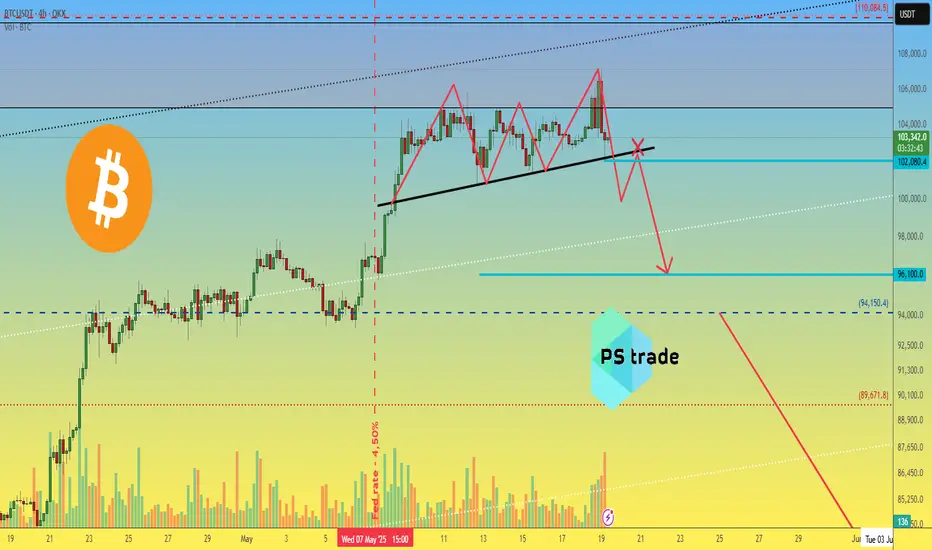
Bitcoin BTC price analysis - be careful📉 The cryptocurrency market is forming an "order" for "Red Monday".
On the OKX:BTCUSDT chart, the "Triple Top" pattern is probably nearing completion - its recognizable feature is the more lower central top and the right “powerful shake out” (for more details, if you are interested, you can read Encyclopedia of chart patterns/Thomas Bulkowski)
🆗 So, the minimum target for this pattern is $96100 per CRYPTOCAP:BTC
❗️ Confirmation of the "Triple Top" pattern development - after the base breakout and the inability to consolidate higher on the retest.
💰 Globally, we wrote our thoughts on the possible price of #Bitcoin in May/June a week earlier 👇
Also, to make trading decisions and determine which direction to trade, you need to analyze the situation on the charts:
1️⃣ BTC.D 👇
and
2️⃣ USDT.D 👇
_____________________
Did you like our analysis? Leave a comment, like, and follow to get more
BTCUSD Rectangle Pattern Breakout + Bearish Retest & Target🧩 Chart Overview
This chart captures a well-defined rectangle continuation pattern forming within a rising channel on the 1-hour timeframe. This setup is a classic combination of horizontal and diagonal price structure interaction, offering valuable insights into potential market behavior and trade opportunities.
🧱 Structure Breakdown
Rectangle Pattern: Price action was trapped in a sideways consolidation phase between the resistance zone (~104,800 - 105,400) and the support zone (~101,200 - 101,800).
This rectangle followed a strong bullish rally, which often implies a continuation pattern. However, the lack of follow-through from bulls near the resistance led to repeated failures to break out, suggesting weakening momentum.
Rising Channel: Within this rectangle, price respected a rising trendline support and resistance structure, forming a parallel ascending channel.
Bearish Breakout: The significant event occurred when BTC broke down below both the horizontal support of the rectangle and the lower boundary of the rising channel, triggering a structural shift from bullish to bearish.
🔁 Retesting Phase – What’s Happening Now
After the breakdown:
Price pulled back toward the prior support zone, which is now acting as resistance (a classic example of the support-turns-resistance principle).
This is commonly referred to as a retest, which validates the breakout and offers a lower-risk entry point for traders looking to short.
The retest area (around 101,500 - 102,000) is crucial. If price fails to reclaim this level and prints bearish confirmation (e.g., rejection wick, bearish engulfing candle), it increases the probability of downward continuation.
🎯 Trade Setup (Short Bias)
Entry Zone: 101,500 – 102,000 (on retest rejection confirmation)
Stop Loss: Above 103,000 (above prior highs and invalidation point)
Target 1 (TP1): 99,347 – key psychological and horizontal support level from prior structure
Target 2 (TP2): 97,277 – measured move of the rectangle height projected downward, aligning with previous demand area
This setup offers an attractive risk-to-reward ratio, assuming proper trade management and confirmation-based entry.
📊 Additional Technical Confluences
Bearish Momentum: The aggressive breakdown candle shows strong seller interest and increased volatility.
Volume: If confirmed with high selling volume during the breakdown and low buying volume during the retest, the move gains more credibility.
Trend Reversal Signals: The break of the channel and the rectangle support indicates potential trend reversal from short-term bullish to bearish.
RSI & Momentum Indicators (optional): Traders may use tools like RSI or MACD to confirm momentum shifts during retest.
📉 Psychological and Price-Level Significance
101,500 was a strong intraday support zone throughout the consolidation phase. Once broken, it flips polarity and acts as resistance.
The round-number level of 100,000 is always a psychological magnet for BTC. It often acts as a bounce or breakout zone, so traders should watch price behavior near this area closely.
Deeper demand may emerge around 97,000 – 96,500, which can serve as an extended target or reaccumulation zone depending on broader market conditions.
⚠️ Risk Management & Final Thoughts
This setup is high-probability only if the retest confirms rejection. Avoid early entries or assumptions before confirmation.
Always use proper stop-loss placement to avoid whipsaws or fake-outs.
Manage position sizing based on account size and risk tolerance.
News events or macro data can override technicals, so be aware of upcoming economic releases or sentiment shifts.
🧵 Conclusion
Bitcoin is showing clear signs of short-term weakness following the breakdown of a long-standing consolidation range within a rising channel. The ongoing retest provides an ideal area for short positioning, with clearly defined invalidation and profit targets.
✅ If bears defend the retest zone, expect downside continuation toward 99.3K and possibly 97.2K.

BITCOIN SCALP?.
here is my famous words to you guys from this book
;>>>Now a lot of people will be looking for sells from here, so if we know that. So
once we have a nice rejection from this double top and nice retrace, this looks
good for the majority of people, because price come up but we failed to break
above this DT or as we know a EQH.
We have got a nice retrace candle, which again retail love retrace candle,
because its showing potential move to the downside, and rejection from an
area.
So now that we have got a rejection from this DT, people are looking to sell
this, and when people are looking to sell at DT, where are their stop losses
going? Well they are going above the DT. But clearly they have going above the
DT.
Retail always put stops above DT or below DB, and then expect to move down.
So that is exactly why there is liquidity this areas. So that basically means that
a lot of stop losses are at this areas..
all traders on bitcoin would longs right. My target would be the 106k only for scalping.
Goodluck traders, see cap and charts. its the same on our EURUSD ideas right?
Grab it and take the trade. don't missed it. pewww
