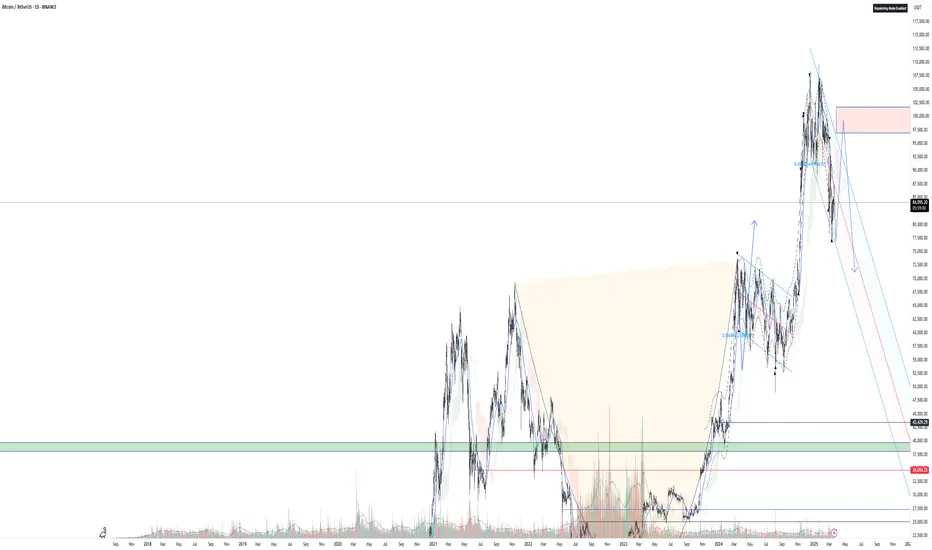
BTC - 180k topBTC - Local bottom was around 74k, now heading towards 180k which will be the top for this cycle.
74 – – – - – – 54 bottom.
Btcusdanalysis

#BTC/USDT Bullish Crossover in Play!CRYPTOCAP:BTC Update: Bitcoin is currently holding support and showing signs of strength with a bullish EMA crossover — the 50 EMA crossing above the 100 EMA, which historically signals upward momentum based on past fractals.
The lower support zone is marked in blue, in case the price dips further.
Immediate resistance remains at the GETTEX:98K level — a confirmed close above this could trigger a move toward $103K.
Stay tuned for more real-time updates.
Do hit the like button if you like it, and share your views in the comments section.
Thank you
SHARE THE IDEA ABOUT BTCUSD BEARISH PATTERNCurrent Market Overview:
Price Action: Bitcoin has rallied approximately 40% from its April lows, reaching a high near $105,525 today.
Support Levels: Key support is identified around $100,000, with additional support near $92,000.
Resistance Levels: Immediate resistance is observed around $107,000, with a potential upside target near $120,000 if bullish momentum continues.
Bearish Pattern Analysis:
While the broader trend remains bullish, certain patterns indicate possible short-term bearish movements:
Head and Shoulders Formation: Some analysts have noted a potential head and shoulders pattern forming, which could signal a reversal if confirmed.
Momentum Indicators: The Relative Strength Index (RSI) is above 70, suggesting overbought conditions that might precede a pullback.

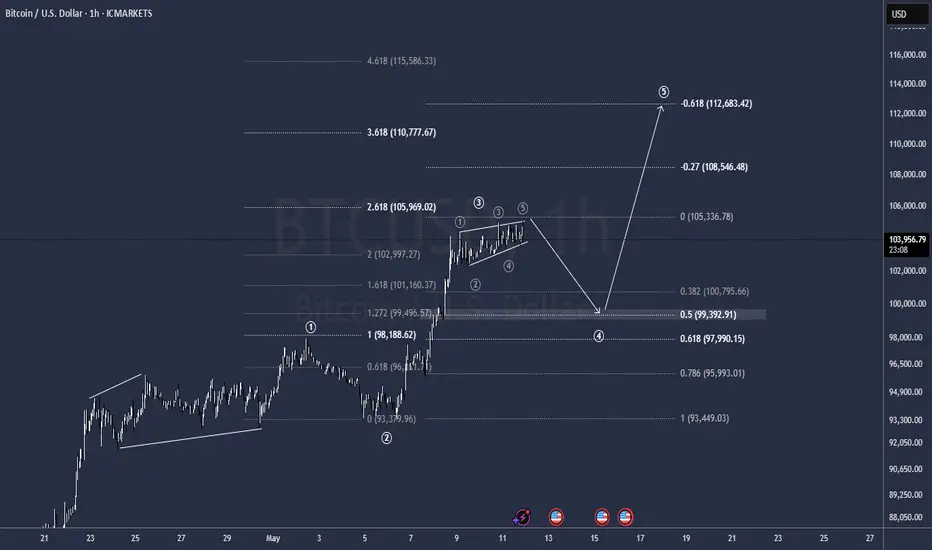
$BTC go to 142000🪙 Bitcoin Analysis - Daily Timeframe
🚀 Entry Point:
The ideal buy entry is at $96,302, where we have a confluence of the 0.618 Fibonacci level, FVG, and a Breaker Block. This zone could trigger buy orders and potentially push Bitcoin towards the first target at its previous all-time high of $109,000, and ultimately to the final target at $142,650.
🔴 Critical Support:
The current support level is $93,947.
If a daily candle closes below this level, a bearish structure will form, opening the door for further decline to the next support at $85,000.
💡 Trading Signal: ❤️
Buy Limit: $96,302
Stop Loss: $93,347
Take Profit Targets: $109,000 - $142,000
🔵 Risk Management:
Risk only 1% of your capital in this trade.
Adjust margin size so that in case the stop loss is hit, your account loss will not exceed 1%.
This is a Swing Trade setup. Stay disciplined and manage your risk effectively. ✅

Update! $BTC range Bound... Consolidation? Breakout? Breakdown? CRYPTOCAP:BTC appears to have formed a range: between approximately between 76800 and 104,300
Current price: 104300
Here are the key observations:
Key resistance zone is around 104300 - Price has tested this level multiple times but failed to close above it decisively.
Clear to say that A break above which will lead to All time highs possibly up to 135k
If #BTC Bitcoin continues to reject this level then expect these layers of support to be tested:
97700 and then 91100
CRYPTOCAP:BTC remains bullish if prices remains above 91100. Further break down will lead to bottom of range 84100 and 76800 (coinciding with 200 EMA )
Trading Implications:
For Longs: Avoid new positions unless there's a breakout with volume above $105,000.
For Shorts: This is a possible scalp opportunity near the top of the range, with a stop slightly above $105,000.
Not financial Advice!

Bitcoin blows up the market: $100,000 broken.Bitcoin (BTCUSD) surged past the key $100,000 mark again on Thursday, May 8, 2025 — for the first time since February this year. During the day, BTC traded between $101,500 and $102,700, posting a daily gain of around 5.3%. Its market capitalization exceeded $2 trillion.
Why Bitcoin is back at $100K — and what’s driving it higher:
Macro tailwinds:
Growing expectations of Fed rate cuts , reinforced by Donald Trump’s calls for lower interest rates, have fueled risk appetite across markets — Bitcoin included.
US – UK trade deal hype : Hints of a potential trade agreement between the US and the UK announced by President Trump added a major boost to market sentiment, sparking a rally.
Institutional demand : Massive inflows into US spot Bitcoin ETFs continue. Over $1.8 billion flowed in last week alone, with some sources reporting $2.68 billion by Thursday — the largest weekly inflow since mid-December 2024. Companies like MicroStrategy are leading the charge with more BTC purchases.
Weaker dollar & falling bond yields : These trends have enhanced Bitcoin’s appeal as a hedge.
Market sentiment & BTC dominance : Breaking above $100K triggered optimism and possible FOMO (fear of missing out). Bitcoin’s market dominance now exceeds 60%, the highest since early 2021, reflecting investor preference for BTC over altcoins in the current phase.
The appointment of Paul Atkins as SEC Chair , along with a softer US regulatory stance and Arizona’s new pro-crypto law, are setting the stage for continued growth.
FreshForex analysts note that the current rally is mainly driven by institutional players, while retail investors have yet to fully engage.

Bitcoin BTC Is Entering Into CorrectionHello, Skyrexians!
I got a lot of comments to analyze BINANCE:BTCUSDT because it has almost reached ATH and people don't understand what is happening. In my opinion last pain ahead and after that likely we see great gains.
Let's take a look at 4h time frame. We can finally notice the full 5 waves cycle which is likely to be finished. If you remember my recent analysis this is just the wave 1 inside higher degree wave 3. Awesome Oscillator has printed divergence, so there is a great chance that correction has been already started. The target for this correction is 0.5 Fibonacci at $90k. I don't recommend you to short this move if you are not experienced because this is trade against the trend.
Best regards,
Ivan Skyrexio
___________________________________________________________
Please, boost this article and subscribe our page if you like analysis!

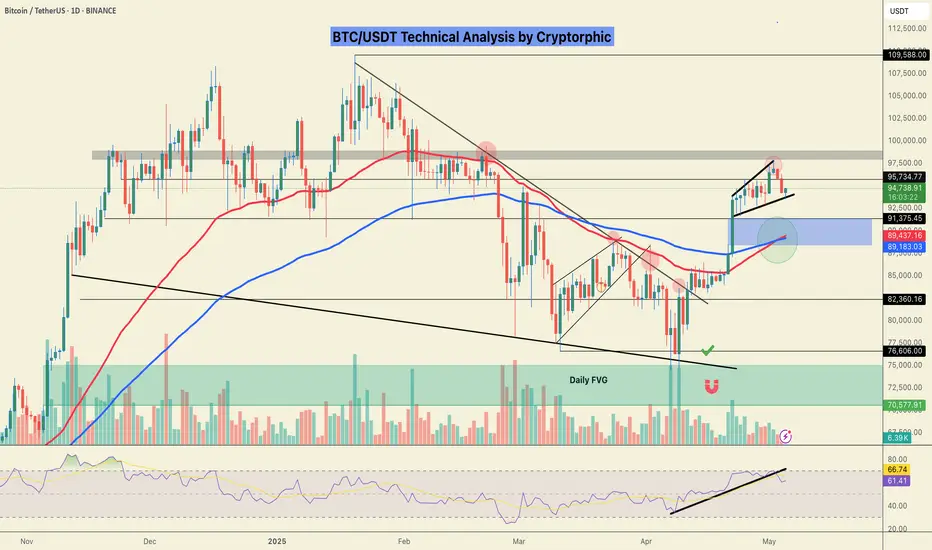
DeGRAM | BTCUSD ended the period below 100k?📊 Technical Analysis
● Price rocketed out of the $91 300 demand zone, snapping the 6‑month descending trend and converting the $99 500 former cap into support.
● A tight bull pennant is forming just above that level; a decisive break targets the marked resistance level/supply band at $108 000. Long bias void below $93 300.
💡 Fundamental Analysis
● U.S. Treasury’s plan to boost quarterly bill issuance is flattening real yields and lifting non‑yielding assets.
● Hong Kong’s new spot‑BTC ETFs amassed >$500 M AUM in two weeks, signalling fresh Asia‑Pacific demand and tightening offshore float.
✨ Summary
Pennant continuation above new support and expanding Asian ETF inflows argue for a push from $99.5 K to $108 K; protect longs if price closes under $93.3 K.
-------------------
Share your opinion in the comments and support the idea with a like. Thanks for your support!


BTC/USDTbtc is up 42% since the 74k bottom. after every pump,we have seen a 4% dip so im expecting another one here.

BTCUSDTHello everyone. Wishing you all a great weekend!
Just because the FX market is closed today doesn't mean we should stay away from trading in the crypto markets.
That’s why I’ve activated a Buy trade on BTCUSDT and wanted to share it with you as well:
🔍 Criteria:
✔️ Timeframe: 15M
✔️ Risk-to-Reward Ratio: 1:1.50
✔️ Trade Direction: Buy
✔️ Entry Price: 103974.98
✔️ Take Profit: 104442.64
✔️ Stop Loss: 103662.77
🔔 Disclaimer: This is not financial advice. It's a trade I’m taking based on my own system, shared purely for educational purposes.
📌 If you're also interested in systematic and data-driven trading strategies:
💡 Don’t forget to follow the page and subscribe to stay updated on future analyses.

Bullish Tide: Are Bears Drowning as $31M Shorts VanishBullish Tide: Are Bears Drowning as FWB:31M Shorts Vanish and "Price Discovery 2" Looms?
The cryptocurrency landscape is once again electric with anticipation, and at the heart of this renewed fervor stands Bitcoin. As of May 2025, the prevailing winds appear to be firmly in the sails of the bulls. A cascade of recent market events, headlined by a dramatic $31 million liquidation of Bitcoin short positions, is sending a stark warning to pessimistic speculators. This, coupled with compelling technical analysis suggesting that Bitcoin must close the week above a crucial level to initiate 'price discovery 2', paints a picture of a market on the brink of a potentially explosive upward trajectory.
This isn't merely about fleeting price surges. Underlying these market dynamics is a growing conviction that Bitcoin doesn’t need to change; the world does. While critics often call for Bitcoin to become "faster, cheaper, greener," a powerful counter-narrative champions its existing, robust design as a solution to the inherent weaknesses of traditional systems. Adding fuel to this bullish fire is the subtle but significant trend of Bitcoin’s Quiet Coup, as wealth funds methodically build up their holdings. Furthermore, market sentiment indicators like Bitcoin funding rates remaining positive on major exchanges like Binance seem to confirm a strong, underlying uptrend. Are Bitcoin bears truly losing out, and are we witnessing the dawn of a new era for the king of cryptocurrencies?
The Cost of Doubt: $31 Million in BTC Shorts Wiped Out
The unforgiving nature of leveraged trading in the cryptocurrency markets was recently laid bare with the news that a staggering $31 million in Bitcoin short positions were liquidated. This event serves as a potent illustration of the risks involved in betting against Bitcoin's momentum, especially in the current climate.
Short selling in the crypto sphere, much like in traditional markets, involves traders borrowing Bitcoin, selling it with the expectation that its price will fall, and then planning to buy it back at a lower price to profit from the difference. However, the crypto markets are known for their high volatility and the widespread use of leverage, particularly in perpetual futures contracts. Leverage allows traders to control a much larger position than their initial capital would normally allow, amplifying potential profits but also, crucially, potential losses.
When the market moves sharply against a leveraged short position – meaning Bitcoin's price surges upwards – traders can face a margin call. If they cannot add more funds to cover their mounting losses, the exchange automatically closes their position to prevent further debt. This forced closure is a liquidation. The $31 million wipeout signifies that a substantial volume of bets on Bitcoin's price decline was overwhelmed by a potent wave of buying pressure.
This mass liquidation event has several implications. Firstly, it inflicts significant financial pain on those who were positioned for a downturn, effectively Bitcoin bears losing out on their wagers. Secondly, these forced closures inherently involve buying Bitcoin to cover the short positions, which paradoxically adds more fuel to the upward price movement. This can trigger a "short squeeze," where rising prices force more shorts to cover, leading to further liquidations and an accelerated price rally. Such events bolster bullish sentiment, demonstrating underlying market strength and deterring further aggressive short selling. It’s a clear signal that the market's undercurrent was far more robust than the bears had anticipated.
On the Cusp of a New Frontier: The Critical Weekly Close and "Price Discovery 2"
The excitement among Bitcoin proponents is palpable, with many analysts asserting that Bitcoin bulls are on the cusp of launching the market back to all-time highs and beyond. Central to this optimistic outlook is the focus on an upcoming, crucial weekly close. According to prevailing technical analysis, Bitcoin must close the week above a specific, strategically important price level to start 'price discovery 2'.
"Price discovery" is the process by which market participants determine the fair value of an asset through their buying and selling activities. When an asset like Bitcoin surpasses its previous all-time high (ATH), it enters a phase where historical resistance levels cease to exist. This is true price discovery – the market is venturing into uncharted territory, with no past price ceilings to act as psychological or technical barriers. "Price Discovery 1" can be considered Bitcoin's journey to its previous peak (around $69,000 in November 2021). The term "Price Discovery 2" thus implies a new, sustained bull run that would take Bitcoin significantly beyond that former zenith.
The significance of a "weekly close" above a key resistance level cannot be overstated in technical analysis. Weekly charts smooth out short-term noise and are often seen as better indicators of major trend shifts. A decisive weekly close above, say, the previous ATH or a major interim peak, would be a powerful confirmation for many traders and investors that the bulls are firmly in control. It would invalidate bearish scenarios that predicted a rejection at these upper levels and would likely attract a fresh wave of capital into the market.
Several potent catalysts could fuel this ascent into "Price Discovery 2." The quadrennial Bitcoin halving event, the most recent of which occurred in April 2024, historically constricts the new supply of Bitcoin, often leading to significant price appreciation in the months and years that follow as demand outstrips this reduced supply. Continued institutional adoption, evidenced by wealth funds accumulating Bitcoin, provides a steady stream of large-scale buying pressure. Furthermore, a challenging macroeconomic environment, characterized by persistent inflation in major fiat currencies or geopolitical uncertainties, can enhance Bitcoin's appeal as a non-sovereign store of value and a hedge against systemic risks. Should Bitcoin achieve this critical weekly close and embark on "Price Discovery 2," the upside could be substantial, as the market seeks to establish a new equilibrium in uncharted price territory.
The Unwavering Standard: Bitcoin Doesn’t Need to Change, The World Does
Amidst the price charts and market analyses, a more profound narrative is solidifying: Bitcoin doesn’t need to change; the world does. For years, critics have argued that Bitcoin should be faster, cheaper, greener, often comparing its transaction throughput or energy consumption to centralized payment networks or newer, less proven blockchain protocols. However, an increasing number of proponents argue that maybe the point isn’t to fix Bitcoin. Maybe it’s to fix everything else with Bitcoin.
This perspective champions Bitcoin's core attributes – often perceived as limitations by detractors – as its most vital strengths:
• Unparalleled Decentralization: Bitcoin operates on a globally distributed network with no single point of control. This makes it resistant to censorship, shutdown, or manipulation by any government or corporation. In an age of increasing financial surveillance and control, this is a feature, not a bug.
• Robust Security and Immutability: The Proof-of-Work (PoW) consensus mechanism, while energy-intensive, is what underpins Bitcoin's formidable security. The immense computational power dedicated to mining creates an economic fortress around the network, making its transaction history virtually tamper-proof. While the "greener" argument often pushes for alternatives like Proof-of-Stake (PoS), many believe PoW offers a unique level of objective security crucial for a global store of value. Moreover, the narrative around Bitcoin's energy use is evolving, with increasing adoption of renewable and stranded energy sources for mining, and a growing recognition that its energy consumption is a worthwhile trade-off for securing a truly independent financial system.
• Absolute Scarcity: Bitcoin's supply is capped at 21 million coins, a hard-coded limit that cannot be altered. This programmatic scarcity makes it a powerful antidote to the inflationary pressures inherent in fiat currencies, which can be created limitlessly by central banks. This "digital gold" characteristic is fundamental to its value proposition.
• Layered Scaling: While the Bitcoin base layer prioritizes security and decentralization over raw transaction speed, innovation is flourishing on Layer 2 solutions like the Lightning Network. These protocols enable fast, low-cost transactions by batching them off-chain and settling them periodically on the main Bitcoin blockchain, thus allowing Bitcoin to scale for everyday payments without compromising its core principles.
The argument is that instead of trying to mold Bitcoin to fit the constraints of the old financial world, we should recognize how its unique properties can address the systemic flaws within that world – issues like inflation, financial exclusion, censorship, and counterparty risk. Bitcoin, in its current form, offers a radical, resilient alternative.
The Silent Infiltration: Wealth Funds Build Up Bitcoin Holdings
Further bolstering the bullish case is the ongoing, often understated, trend of Bitcoin’s Quiet Coup: Wealth Funds Build Up Holdings. This isn't about flashy headlines but rather a methodical, strategic accumulation of Bitcoin by sophisticated institutional investors, including pension funds, endowments, sovereign wealth funds, and large family offices.
These entities, traditionally conservative and managing trillions of dollars in assets, are increasingly allocating a portion of their portfolios to Bitcoin. Their motivations are manifold:
• Diversification: Bitcoin has historically exhibited low correlation with traditional assets like stocks and bonds, making it an attractive addition for enhancing portfolio risk-adjusted returns.
• Inflation Hedge: In an environment of persistent global inflation, Bitcoin's finite supply positions it as a potential store of value, a digital hedge against currency debasement.
• Asymmetric Upside: Even a small allocation to Bitcoin can offer significant upside potential, an appealing proposition for large funds seeking growth.
• Growing Regulatory Clarity and Infrastructure: The approval of Bitcoin ETFs in major jurisdictions like the U.S. has provided regulated and accessible avenues for institutional investment, alongside the development of institutional-grade custody and trading solutions.
This "Quiet Coup" signifies a maturing perception of Bitcoin, moving it from a speculative niche asset to a legitimate component of institutional investment strategy. The steady inflow of significant capital from these large players not only provides price support but also lends credibility and encourages further adoption, potentially reducing long-term volatility as more Bitcoin is held by entities with long-term horizons.
Reading the Bullish Tea Leaves: Bitcoin Funding Rates Remain Positive
Adding another layer of confirmation to the prevailing bullish sentiment is the observation that Bitcoin Funding Rates Remain Positive On Binance — Strong Uptrend Confirmed? Funding rates are a key mechanism in cryptocurrency perpetual futures markets, designed to keep the price of the perpetual contract aligned with the spot price of the underlying asset.
When funding rates are positive, it generally means that traders holding long positions (betting on a price increase) are paying a premium to those holding short positions. This indicates a higher demand for long leverage, reflecting overall bullish sentiment in the derivatives market. Consistently positive funding rates on a major exchange like Binance, which boasts significant trading volume, suggest that this optimism is sustained. It implies that traders are confident enough in Bitcoin's upward trajectory to pay a recurring fee to maintain their leveraged long positions.
While extremely high funding rates can sometimes signal an over-leveraged market ripe for a correction (a "long squeeze"), moderately and persistently positive rates, as currently observed, are often interpreted as a healthy sign of a strong and well-supported uptrend. It suggests that the rally is not just speculative froth but is backed by conviction among active traders.
Conclusion: A Perfect Storm for Bitcoin's Next Chapter?
As May 2025 progresses, the confluence of factors points towards a potentially transformative period for Bitcoin. The $31 million decimation of short positions serves as a stark reminder of the perils of underestimating Bitcoin's strength. The market's eager anticipation of a weekly close that could unlock "Price Discovery 2" highlights the potent bullish technical setup. This is further reinforced by the fundamental conviction that Bitcoin's core design is its ultimate strength, offering solutions the traditional financial world desperately needs.
The quiet, strategic accumulation by wealth funds injects not only capital but also a profound sense of legitimacy, while positive funding rates reflect a confident and sustained bullish sentiment among active traders. While the path ahead will undoubtedly feature volatility – a characteristic inherent to Bitcoin's journey – the current alignment of technical indicators, institutional adoption, strong market sentiment, and a compelling fundamental narrative suggests that Bitcoin bears may indeed be losing out, and significantly so. The stage appears set for Bitcoin to not only challenge its previous highs but to potentially embark on a new, exhilarating phase of growth and adoption, further solidifying its role in the evolving global financial order.

Strategic Analysis of Bitcoin for Next WeekRecently, Bitcoin has broken through the $100,000 mark, and its market dominance has risen to over 60%. Investors are highly bullish. Such a positive market sentiment is likely to attract more investors to enter the market, further driving up the price. 👉👉👉
In the short term, the price of Bitcoin has continuously broken through multiple key technical resistance levels. For example, on May 8th, it broke through the psychological barrier of $100,000, demonstrating strong bullish momentum. The market dominance has risen to over 60%, and investors are highly bullish. Such a positive market sentiment is likely to attract more investors to enter the market, further driving up the price.
BTCUSD Trading Strategy
buy @ 103500-103200
sl 101000
tp 104300-104600
If you approve of my analysis, you can give it a thumbs-up as support. If you have different opinions, you can leave your thoughts in the comments.Thank you!👉👉👉

Summary of Bitcoin Last WeekThe overall trend of the Bitcoin market shows a pattern of "first decline and then rise". The price has continuously broken through several key technical resistance levels, strongly breaking through the psychological barrier of the $100,000 mark and reaching a new stage high.👉👉👉
With the rise in price, the hash price of Bitcoin has steadily rebounded and is approaching the high range of the past month, rising for several consecutive days, indicating that the market demand for computing power resources remains robust.
Overall, after the previous fluctuations, the Bitcoin market has demonstrated strong resilience and optimistic expectations under the dominance of the bulls in the recent period. However, the cryptocurrency market is highly uncertain and risky, and investors still need to approach it with caution.
If you approve of my analysis, you can give it a thumbs-up as support. If you have different opinions, you can leave your thoughts in the comments.Thank you!👉👉👉

BTC at a Crossroads: Bull Trap or Moon Mission?A possible bearish scenario is playing out on BTC, but hey—just one of many possibilities before the real bloodbath begins. 👀 This could just be a classic trap to lure people in before shaking them out. The key resistance zone is between GETTEX:97K and $101K, a big range to clear. If we flip it and close above $102K on the weekly, that would be amazing—but let’s be real, we’ll need a strong catalyst for that. If we do, then we’re likely talking about the $120K range.
On the flip side, if we drop lower from here, the most obvious support sits at $72K. Below that… well, let’s just say we don’t wanna go there—next real support isn’t until $50K. For everyone’s sake, let’s hope we don’t see those levels. Big decision point ahead—let’s see who wins this battle! ⚔️🚀
BTCUSDT SHORTHere’s the translation for your analysis:
"The price here is a good level to open a sell position. The future buy and sell levels I've marked are based on the perspective it creates for us, but for now, it's just a viewpoint."
ITS POSSIBLE SCENARIO FOR BTCUSDT.

BTC 4H analysisIn the previous analysis, the zone of 70 was determining level for us, whether it was a correction or a downward trend.
BTC continued it's upward movement from near that area.
Now Bitcoin is near it's historical resistance area, this time the zone of 110 to 114 plays this role for us.
According to ICHIMOKU and according to previous analysis, Bitcoin tends to move to higher levels marked on the chart.

Chainlink Analysis for Intraday TradingWait for the entries to be filled from both side, I will prefer short entry here, Reason btc looks too weak now, USDT.D has reached the strong bullish zone and can hit 4.80-4.89% zone for correction. While I will short BTC from 105-106K SL if 4 candle closes above 107.8K, at the same time I will open short positions on ETH, and Link SL when BTC hits the SL.

BTCUSD Technical Analysis – V-Shaped Recovery Points to BreakoutBitcoin (BTCUSD) is showing strong bullish momentum following a textbook V-shaped recovery from the recent support zone around $73,699. After consolidating and breaking the descending channel, BTC surged with conviction, reclaiming critical levels and now approaching the previous All-Time High (ATH).
Key Technical Highlights
Pattern: V-Shaped Recovery
Support Zone: $73,699 – $75,000
Resistance/ATH: $109,255
Trendline: Long-term bullish trend remains intact
Recent Breakout: Clean breakout above the falling wedge/descending channel
BTC has reversed sharply from the bottom, printing higher highs and higher lows. This aggressive rebound has brought price action back toward ATH levels, with strong chances of a breakout continuation.
The structure suggests bullish control, especially after retesting key areas with strength.
Bitcoin Dominance at 62.2%
Bitcoin's market dominance sits at 62.2%, showing clear investor confidence and capital preference for BTC over altcoins. This dominance level reinforces the bullish bias as smart money flows into Bitcoin in anticipation of a potential price discovery breakout.
This trend, along with large institutional inflows, highlights a growing belief in BTC’s strength as a leading asset, especially in the current macro environment.
BTCUSD Trade Setup (As Per Chart)
🎯 Entry $104,732.85
⛔ Stop Loss $99,507.06
✅ Take Profit $114,359.25
The trade idea is based on the continuation of the current uptrend and breakout above $109,255, which previously acted as resistance (ATH). A clean daily close above this level would likely open the path toward $114,359 and possibly $116,000+ as the next milestone.
BTC is primed for a new leg higher. The market structure favors bulls with BTC dominance rising, large investments entering, and strong technical recovery in place. If Bitcoin holds above the entry zone and pushes through ATH, we may see a new high forming in the coming weeks.

BTC/USD) Resistance level pullback Read The ChaptianSMC Trading point update
Technical analysis of Bitcoin (BTCUSDT), highlighting key levels and potential price movements based on trend channels, support/resistance, and RSI. Here's the breakdown:
---
Key Elements in the Analysis:
1. Trend Channel:
BTC is trading within an ascending channel, indicating an ongoing bullish trend.
The recent price action hit the upper boundary (resistance) of the channel, suggesting potential for a pullback.
2. Resistance Zone:
105,586.06 is marked as a resistance level, where price faced rejection.
Strong reaction here suggests sellers are defending this area.
3. Support Zone:
A new support level is established around 98,000.
This zone aligns with the lower boundary of the ascending channel and previous breakout structure.
4. Target Point (Bearish Projection):
The chart projects a potential drop to the 97,367.51 level, representing a ~7.4% correction.
This move mirrors the prior leg up, applying a measured move concept.
5. RSI Indicator:
RSI is around 66–71, indicating overbought conditions.
A bearish divergence or trendline break on RSI suggests weakening momentum.
Mr SMC Trading point
---
Summary of Trading Idea:
Bias: Short-term Bearish (correction within an overall bullish trend)
Expected Move: Potential dip toward 97,367.51 support
Confirmation: Rejection at resistance, RSI divergence, and trendline break
Invalidation: A strong breakout above 105,586.06 would nullify the correction setup and favor continued bullish movement
pelas support boost 🚀 analysis follow)

Btc Future Scalp setupEnter at cmp 104200 2nd entry 103k, Sl 1hr closes below 102920 on binance future chart. Tp 106k this is a touch n go zone so put limit 105.8k. until unless we don't closes below 102920 at least 2hrs candle chances are high for new ath.

BTC in 17 April 2025Potential Major Move on Thursday, April 17, 2025 📍
📊 Based on an analysis of historical Bitcoin chart averages and similar patterns, there is a likelihood of a significant price movement on this date.
This analysis is conducted using technical analysis and a detailed examination of Bitcoin’s movement averages. It suggests that approximately every 150 days after the start of a neutral trend, we can expect a sharp upward or downward move that sets the stage for the main trend in the future.
📅 As of the current date, March 29, 2025, there are about 18 days left until this significant event.
You can follow the results of this analysis and the conducted review on TradingView on the specified date.
