BTC/USD) Short Setup: Triple Top Formation Targeting 86,023 USD You’re seeing a potential Head and Shoulders structure (or at least a triple top) — with the orange circles marking failure to break higher around $95K.
The neckline (support) is slightly diagonal down toward the $94K region.
A breakdown is anticipated once the neckline fails.
2. EMAs Interaction:
30 EMA (red) is currently flattening, showing weakening momentum.
200 EMA (blue) is far below, around 88,181 USD, acting as a major support zone — and it aligns with the projected EA TARGET POINT.
EMA compression usually precedes a strong move.
3. Zones and Key Price Levels:
Entry Point: ~95,145.60 USD → high-probability short sell.
Stop Loss: ~96,000–96,957 USD → protects against unexpected breakout.
Target: ~86,023 USD → aligns with past accumulation zone and EMA200.
4. Risk/Reward Ratio:
Potential reward is about 9–10%.
Risk (from entry to stop) is about 1–2%.
Excellent Risk/Reward (>4:1).
5. Momentum and Volume (implied, not shown):
Given the topping pattern and lack of higher highs, buying momentum is weakening.
If volume increases on a breakdown, confirmation will be strong.
📊 Strategic Points:
Aspect Analysis
Trend Still bullish, but topping signs visible
EMA Behavior Short-term EMA flattening, long-term EMA rising slowly
Pattern Formed Triple Top / Head and Shoulders
Risk/Reward Very good (>4:1)
Recommendation Short bias around entry level, with strict stop-loss
⚡ Quick Trading Plan:
Entry: Short at ~$95,145
Stop Loss: ~$96,000–96,957
Target: ~$86,023
Btcusdanalysis

BTC Setup: Scalp Shorts Active Below 97.5K BTC is currently facing strong resistance around the 97.5K area on the daily timeframe.
As long as BTC stays below 97.5K on a daily closing basis, I am expecting a potential pullback move.
📉 There is a chance of a wick or sharp move down toward the 92K zone, which could provide good scalp short opportunities.
📈 However, a clear breakout and daily close above 97.5K would invalidate this short idea and shift the bias back to bullish continuation.
Trade Plan:
🔻 Below 97.5K = Look for scalp shorts with strict risk management.
🔼 Above 97.5K = Exit shorts and watch for bullish setups.
Always remember: Protect your capital and stick to your plan! 🎯
⚠️ Disclaimer:
This is not financial advice. This post is for educational purposes only. Always do your own research and manage your own risk before entering any trade.

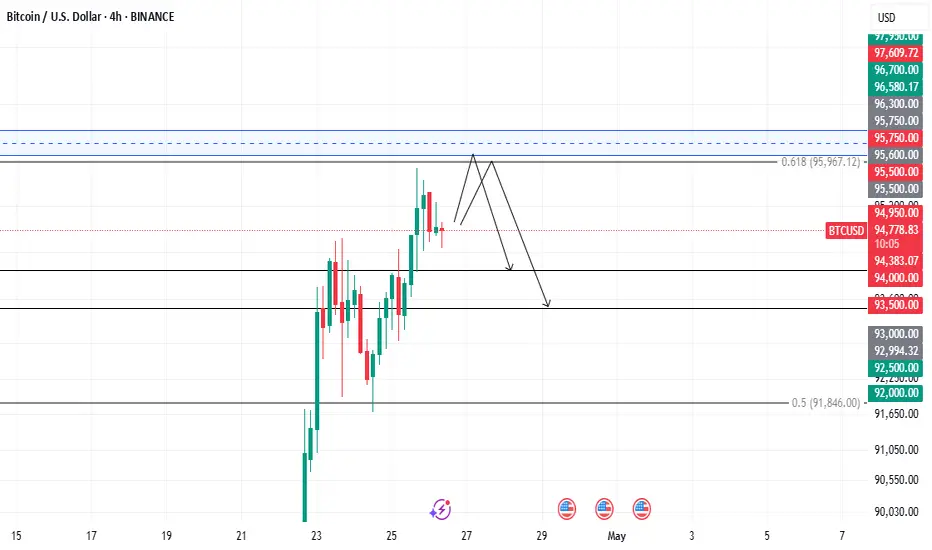
#Bitcoin update , 100K or 88k?#Bitcoin has moved exactly as we anticipated over the past 36 hours.
The real test comes: BTC must break above $95,700 to target the $100K milestone.
This level also marks a major distribution zone on the lower timeframes, making it a tough but not impossible barrier to overcome.
⚡ If BTC gets rejected here, expect a potential revisit to sub-$90K levels.
I’ll keep updating this chart as the price action unfolds.
If you found this helpful, bookmark this post and smash the like button to stay in the loop!
Thank you
#PEACE

$SPELL/USDT Breakout Alert!🚀 $SPELL/USDT Breakout Alert!
SPELL has broken out of a symmetrical triangle on the 4h chart, confirming a strong bullish move!
• Entry: CMP
• TP: 0.0008612
• SL: 0.0005143 for risk management.
Momentum looks after consolidation — eyes on continuation if volume stays strong!
DYOR, NFA

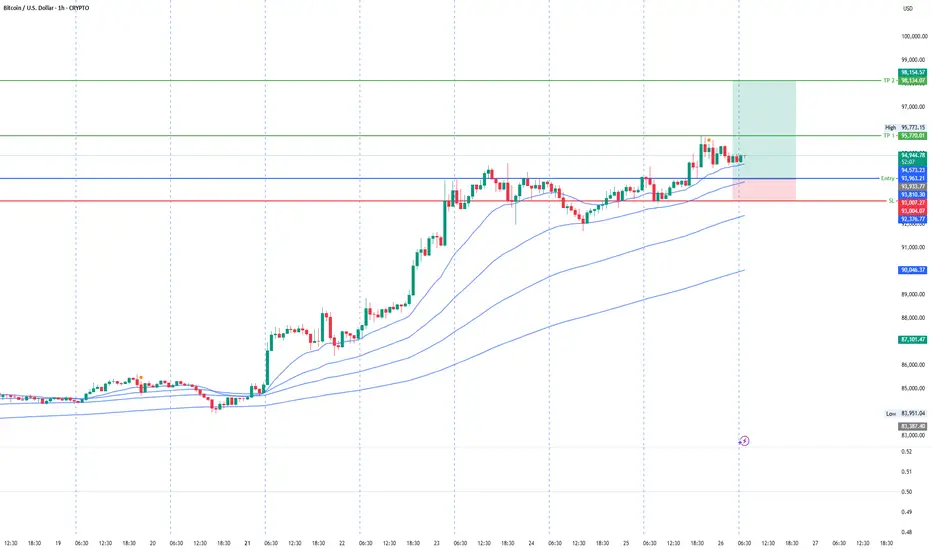
BTCUSD ANALYSIS🚨 BTCUSD Technical Update! 🚨
Traders, pay close attention! 👀
Here’s what the latest 1H chart is showing us:
🔹 Bitcoin is consolidating around 94,700–94,800
🔹 Potential double top structure forming near the 95,600–95,750 zone — MAJOR resistance ahead!
🔹 If Bitcoin fails to break and sustain above this resistance, we could see a sharp drop towards the first support at 94,383 🔻
🔹 A break below 94,000 could accelerate selling pressure — next downside target near 93,500! 🎯
⚡ Plan your trades smartly!
⚡ Wait for confirmations — either breakout or rejection from the resistance zone!
🔥 Volatility Incoming! Stay Alert and Manage Risk Wisely! 🔥
$btc Bitcoin's falling channel....CRYPTOCAP:BTC Bitcoin has seen an all time high of approximately 110k
Current price: $77700
Bitcoin price action is currently respecting the falling channel as seen. With price currently being supported by the 200EMA in the 75k region
Expecting price action to continue to respect this channel and test resistance levels at 88k and then around 92k (bullish divergence also spotted on 2D timeframe). Reactions which will determine higher prices or further rejection.
if #btc price action breaks down from this falling channel then expects supports at 66k and then 56k to be tested for support!

Bullish Trend Continues upto 98KUnder current market conditions, the area near 93929 has been identified as a critical support zone, where the AI model detects a high-probability trade setup.
Suppose the market demonstrates increased volume and price stability above key moving averages in the 93929 area. In that case, traders are advised to monitor for trend-continuation entry opportunities in alignment with the prevailing momentum.
Profit targets are defined at 95764 and 98143, corresponding to logical technical resistance zones. These levels are designed for staged profit-taking across different trade management styles. Stop-loss should be strictly enforced at the designated level; once breached, the strategy is considered invalidated to limit potential downside.
BTC | Bitcoin CURRENT CANDLE | NEW ATH or 70kThe previous weekly candle seemed unable to make a higher high after retesting the support at 76K.
However, today's bullish impulse has suddenly shocked right through two resistance zones, with the price now trading just above 90k.
If we can successfully CLOSE the weekly candle above 91K, it's likely that BTC is in for a new ATH which would mean ETH will also reach a new ATH, and then altseason will commence 🥳
Watch the following and make sure you are prepared for ALTSEAON:
___________________
BINANCE:BTCUSDT

BTC Bitcoin Trade plan 24/4/2025BTC/USD Trading Outlook:
Key Resistance Levels: $95,000 and $97,000
Channel Support Level: $92,000
Support Zone: $86,000
Market Scenarios:
Bearish Scenario:
If BTC fails to break above the resistance at $95,000–$97,000 and drops below the $92,000 channel support, it could trigger a sell-off.
Sell Targets:
Target 1: $90,000
Target 2: $88,000
Watch for further support around $86,000.
Bullish Scenario:
If BTC holds above $92,000 and breaks through the $95,000–$97,000 resistance zone, it may resume its upward trend.
Buy Target: $97,000 (with potential to extend higher if momentum continues)

BTC Cycle Top - Confluence w/ Previous CycleBased on confluence with the previous cycle, I’m projecting the BTC cycle top around $115K.
Looking at the 2021 cycle, we saw:
A news-driven dump after the initial ATH.
A strong recovery to retest the previous highs.
Followed by the true cycle top exactly 26 weeks (182 days) later.
We're now seeing a similar pattern play out in 2025:
Post-ATH retrace and consolidation.
Recovery underway.
If history rhymes, we could be looking at the final leg up, topping out within the same 26-week window.
Target range is aligned with prior structure and psychological resistance.
Let’s see how it plays out…
#Bitcoin #Crypto #BTCUSD #CycleTop #CryptoTrading #TechnicalAnalysis #BTC115K

BTC H4 Analysis | Key Support Zone: | Watch for ReactionBitcoin is approaching a significant support area between 88,277 and 86,850 on the H4 timeframe. This zone has historically acted as a demand region, and price action within this range will be critical to monitor.
Technical structure shows a potential for volatility, and traders should keep an eye on how BTC behaves around this level. A clear reaction here could offer insight into the next directional move.
No trade setup provided — this is a technical observation for analysis purposes only.

BTC Trade Idea — React, Don’t PredictBINANCE:BTCUSD
Smart Trading Requires Patience!
Bitcoin is currently undergoing a healthy correction.
Strong support is located around $87,500, and if confirmed by price action, it could offer a great buying opportunity.
Trading without a plan = gambling!
** Alternative Scenario:
If the $87,500 level breaks with strong confirmation, after a pullback to this zone, a short
opportunity could emerge.
Follow us for more professional insights!
#CryptoAnalysis #BTCUSD #TradingStrategy #Forex #Cryptocurrency

A High Possibility 59K in next couple of weeks and up only!I think this can repeat as last sept-October. first to 59K and then 80K.

BTC Retrace or Rally? Bitcoin’s Liquidity Hunt & Next Move.Bitcoin BTC Analysis & Trade Idea
🚦 Market Context & Price Action
Bitcoin has experienced a sharp rally, pushing into previous weekly and daily highs. This area is a classic liquidity pool, where buy stops from breakout traders and late longs are likely accumulating. The current price action is overextended, suggesting that the market may be primed for a retracement as smart money seeks to capture liquidity before the next directional move.
💧 Liquidity Pools & Wyckoff Concepts
According to Wyckoff methodology, this phase resembles a "Buying Climax" (BC) where price surges into resistance, often followed by an "Automatic Reaction" (AR) and a potential "Secondary Test" (ST). The current rally into old highs is likely triggering buy stops, providing institutional players with ample liquidity to offload positions or engineer a shakeout.
🟢 Wyckoff Schematic:
Buying Climax (BC) at current highs
Anticipated Automatic Reaction (AR) as price retraces
Look for a range to develop (potential Accumulation phase) near the 50% Fibonacci retracement
📉 Fibonacci Retracement & Trade Setup
You’re eyeing the 50% retracement of the previous price range as a key level. This aligns with both technical and Wyckoff logic, as it’s a common area for price to find support after a liquidity grab.
🟢 Trade Plan:
Wait for a retrace to the 50% Fibonacci level
Observe for a range or consolidation (signs of absorption/accumulation)
Look for a bullish break of market structure (BOS) as confirmation
Enter long on confirmation, with stops below the range low
🌐 Fundamentals & Market Sentiment
Currently, Bitcoin sentiment is mixed but leaning bullish due to recent ETF inflows, institutional adoption, and macroeconomic uncertainty (e.g., inflation, rate cut expectations). However, funding rates are elevated, and open interest is high, indicating potential for a shakeout as overleveraged longs are vulnerable.
🟢 Key Fundamentals:
ETF inflows and institutional interest remain strong
Macro uncertainty (Fed policy, inflation) supports long-term bullishness
Short-term: Overheated sentiment and high leverage could trigger a corrective move
🧠 Sentiment & Risk Management
Social media and crypto news outlets are buzzing with bullish narratives, but this euphoria often precedes a correction. Be patient and disciplined—wait for the retrace and confirmation before entering.
🟢 Risk Management:
Only enter after clear accumulation and bullish BOS
Use tight stops below the range
Consider scaling in if the range develops with clear absorption
📈 Trade Idea Summary
Wait for a retrace to the 50% Fibonacci level of the recent rally
Look for Wyckoff-style accumulation and a bullish break of structure
Enter long on confirmation, targeting new highs or the top of the previous range
Manage risk with stops below the accumulation range
Not financial advice!

BTCUSDT 1W AnalysisBTC ~ 1W Analysis
#BTC It is necessary to wait until this pattern is successfully broken to confirm a sustained bullish trend.

Bitcoin Pullback or Opportunity📊 Bitcoin Analysis – Pullback or Opportunity?
CRYPTOCAP:BTC hit strong resistance at 94,000 $ failed to push higher, entering a correction phase 📉. Key support zones now lie at 91,200 $ 87,500 $ , both of which have shown solid reactions in the past 🛡️. If price holds one of these levels, the next target could be around 98,500 $based on the previous move’s momentum 🚀.
📌 Price is still holding above the 200 MA, suggesting bullish momentum is alive but needs further confirmation ✅.
👇 What’s your take on the next move?
🔁 Save this if you're watching the next targets
📩 Share with a friend who's trading BTC right now

#BTC is stuck but Here's the simplified Plan!Bitcoin is currently trading between key levels:
Upper resistance: 93700
Lower support: 91670
We are stuck in this range, and a breakout above or below these levels will confirm the next move in the trend.
Right now, Bitcoin is holding the 50 EMA on the 30-minute chart. As long as this support holds, we could see a move towards 95k, after which we will reassess the chart.
Here are two possible scenarios if we hit 95,700 again:
We break above and target 100k
We face rejection and correct back to 88k. While this wouldn’t be a large correction, it could offer a very opportunistic entry point.
I’ll be sharing more insights and updates as the chart unfolds.
Follow me on all my socials (link in bio).
Drop your thoughts in the comment section and hit the like button if this is useful.
Thank you
#PEACE

Bitcoin (BTC) $95K Target? ETF Inflows & Supply Shock Key Signal
Bitcoin Flashes Bullish Signals: Record ETF Flows and Supply Shock Fuel $95K Target Hopes
Bitcoin, the original cryptocurrency, is demonstrating renewed vigor, capturing investor attention with a confluence of bullish indicators. After a period of consolidation and sideways movement following its all-time high earlier this year, recent data suggests underlying strength is building. Significant inflows into U.S. spot Bitcoin ETFs, a tightening supply on exchanges, strong relative performance against traditional markets, and key technical levels being tested are painting a picture that has analysts eyeing the next major psychological and technical hurdle: $95,000.
ETF Demand Roars Back: A Sign of Renewed Institutional Appetite
One of the most significant developments fueling recent optimism is the resurgence of demand for U.S.-based spot Bitcoin Exchange Traded Funds (ETFs). Launched in January 2024, these products marked a watershed moment, providing traditional investors with regulated and accessible exposure to Bitcoin. After an initial explosive launch, inflows moderated. However, recent weeks have seen a dramatic turnaround.
Reports indicate that these ETFs recently experienced their largest single-day net inflows since their early days in January, signaling a powerful return of institutional and potentially broader retail interest. This influx of capital into regulated vehicles is crucial. It represents sticky, long-term demand rather than just short-term speculative trading. Each dollar flowing into these ETFs effectively removes Bitcoin from the readily available market supply, contributing to a potential supply squeeze.
This sustained demand has also propelled Bitcoin's overall market capitalization significantly. While direct comparisons fluctuate daily and depend on methodology (e.g., including gold, different equity classes), Bitcoin's market cap has grown to rival that of major global corporations and even some traditional asset classes. Its ascent up the ranks of the world's largest assets underscores its growing acceptance and integration into the broader financial landscape. While claiming a specific rank like "5th largest" can be debated based on what's included, there's no denying Bitcoin is now a multi-trillion dollar asset class demanding attention.
The Supply Squeeze: Coins Vanish from Exchanges
Complementing the demand surge is a notable trend on the supply side: Bitcoin reserves held on cryptocurrency exchanges are dwindling rapidly. Data reveals that the amount of BTC available for immediate sale on major trading platforms has plummeted to levels not seen since November 2018. This marks a multi-year low, indicating a strong preference among holders to move their coins into self-custody or long-term storage solutions, rather than keeping them poised for sale.
What's driving this exodus from exchanges? Analysts point to several factors, including the aforementioned ETF accumulation, where authorized participants acquire Bitcoin on the open market to meet ETF share creation demand. Furthermore, there's growing anecdotal and on-chain evidence suggesting accumulation by long-term holders ("HODLers") and potentially public companies adding Bitcoin to their balance sheets. While large-scale corporate buying sprees like MicroStrategy's haven't been widely replicated across the board, the cumulative effect of sustained institutional buying (via ETFs) and dedicated HODLers consistently pulling supply off exchanges creates a powerful dynamic.
Lower exchange reserves typically correlate with reduced selling pressure. When less Bitcoin is readily available to be sold, even moderate increases in demand can have an outsized impact on price. This scarcity factor is a core tenet of Bitcoin's value proposition, underpinned by its fixed supply cap of 21 million coins, and the current trend highlights this dynamic in action.
Relative Strength: The "Cleanest Shirt in the Dirty Laundry"
Bitcoin's recent performance also stands out when compared to traditional financial markets. Over the past 30 days (as per the provided context), Bitcoin has posted significant gains (e.g., +7.68%), while major equity indices like the S&P 500 and the tech-heavy Nasdaq have experienced notable pullbacks (e.g., -6.79% and -8.14%, respectively).
This divergence has led some commentators to describe Bitcoin as the "cleanest shirt in the dirty laundry pile." In times of macroeconomic uncertainty, geopolitical tension, or wavering confidence in traditional financial systems, Bitcoin can attract capital seeking alternatives or hedges. While its correlation with risk assets like tech stocks has often been high, periods of decoupling, like the one observed recently, suggest investors may increasingly view Bitcoin through a different lens – perhaps as a non-sovereign store of value or a bet on future technological disruption, rather than just another high-beta risk asset. This relative outperformance can attract momentum traders and further bolster positive sentiment.
Technical Hurdles: The Road to $95K
From a technical analysis perspective, Bitcoin's price action is generating significant discussion. One key metric analysts watch is the "realized price," particularly for short-term holders (investors who acquired BTC relatively recently). When the market price surpasses the average acquisition cost of these recent buyers, it can signal a shift in market psychology. Those who bought recently are now in profit, potentially reducing sell pressure and encouraging further buying. Bitcoin recently surpassed this level, leading to speculation about whether this marks the beginning of a sustained rally or potentially sets up a "double top" scenario – a bearish pattern where an asset fails twice to break above a certain resistance level.
Analysts are closely watching specific price levels. There appears to be a consensus around a key resistance zone that, if decisively reclaimed and held, could signal that "all bets are off" for the bears, potentially opening the door for a significant upward move. Conversely, failure to break through these levels, or a strong rejection from them, could lead to a pullback, validating the warnings from more cautious analysts.
The $95,000 mark looms large as the next major psychological and potential technical resistance area should the current momentum continue and key lower resistance levels be overcome. Reaching this target would likely require a confluence of the factors already discussed: continued strong ETF inflows, further depletion of exchange supply, supportive macroeconomic conditions (or continued relative strength despite macro headwinds), and a decisive break through established technical resistance zones.
What Triggers the Breakout?
Achieving a breakout towards $95,000 isn't guaranteed and likely requires several catalysts:
1. Sustained ETF Demand: Continued, consistent net inflows into spot Bitcoin ETFs are paramount to absorb supply and signal ongoing institutional conviction.
2. Supply Shock Intensification: If exchange reserves continue to fall sharply, the scarcity narrative strengthens, potentially triggering FOMO (Fear Of Missing Out) buying.
3. Macroeconomic Shifts: A dovish pivot from central banks, renewed inflation fears driving demand for hard assets, or further instability in traditional markets could push more capital towards Bitcoin.
4. Technical Confirmation: A convincing break and hold above currently watched resistance levels would give technical traders confidence and potentially trigger algorithmic buying.
5. Positive Regulatory Developments: While the ETFs were a major step, further regulatory clarity or positive developments globally could reduce perceived risk.
Conclusion: Optimism Tempered with Caution
The current Bitcoin landscape presents a compelling bullish case. Resurgent ETF demand, dwindling exchange supply creating a scarcity effect, and strong relative performance against traditional assets paint an optimistic picture. Technical indicators, such as surpassing the realized price of recent buyers, add fuel to the fire, bringing targets like $95,000 into the conversation.
However, caution remains warranted. Bitcoin is notoriously volatile, and technical resistance levels often prove formidable. The risk of a "double top" or rejection at key levels is real, and regulatory headwinds or negative macroeconomic shifts could quickly alter sentiment. While the confluence of positive factors is undeniable and the path towards $95,000 seems plausible given the current dynamics, investors will be keenly watching whether ETF flows remain strong, supply continues to tighten, and crucial technical levels can be decisively overcome. The interplay between institutional adoption, HODLer conviction, and market technicals will ultimately determine if Bitcoin can conquer its next major milestone.

BTC/USD Swing Trade – Ride the Rebound Before the Next Breakout🚀Bitcoin just reminded the world who’s boss. After brushing up against $94K, it’s taking a breath—and for swing traders, that’s the moment to load the slingshot.
We’re not chasing green candles. We’re positioning at smart levels that offer real upside when the next wave kicks off. With institutional flows increasing and volatility offering cleaner setups, the chart tells a story of momentum with room to reload.
📥 Strategic Entry Zones:
$87,000 – Current support just below recent highs; ideal for an early swing
$77,000 – Mid-range pullback and psychological threshold
$62,000 – The ultimate opportunity zone if volatility spikes hard
🎯 Profit Targets:
$100,000 – A clean round number and breakout point
$105,000 – Stretch target aligned with macro bullish continuation
$115,000+ – Ambitious but not impossible—especially if halving hype and ETF flows stay strong
This isn’t just about price—it’s about timing, conviction, and being ready while others hesitate. Remember, Bitcoin doesn't whisper when it moves... it roars.
⚠️ Disclaimer: This content is for informational and educational purposes only and does not constitute financial advice. Cryptocurrency trading carries significant risk and may not be suitable for all investors. Always do your own research and consider speaking with a licensed financial advisor before making trading decisions.

BITCOIN NEXT MOVES!Bitcoin’s Next Move
In the long run, it's clear—Bitcoin is the new digital gold. Any dip at this stage is a potential opportunity. With over 7 years of experience in Bitcoin analysis, I believe in the bigger picture and long-term value.
If you'd like me to analyze or give insights on any other coin, feel free to ask. And don’t forget to follow for more crypto updates and analysis!

BTC-----Sell around 92600 area, target 91800-91500 areaTechnical analysis of BTC contract on April 24: Today, the large-cycle daily level closed with a small positive line yesterday, the K-line pattern continued to rise, the price was at a high level, and the attached indicator was running in a golden cross. The general trend is still rising, but after yesterday's price surged, it did not continue this morning but began to retreat under pressure. This is a correction. The four-hour chart K-line continued to be negative, and the price was near the moving average pressure level. In this way, the decline should be seen first during the day. The short-cycle hourly chart started from yesterday's European session. The price continued to fluctuate at a high level. The price began to retreat under pressure in Asian time. The current K-line pattern is a single positive line with a continuous negative line, and the attached indicator is running in a dead cross, and the strength of the four-hour chart has not yet come out.
Today's BTC short-term contract trading strategy: sell directly at the current price of 92600, stop loss in the 93100 area, and target the 91800-91500 area;

DeGRAM | BTCUSD Flipped the Resistance Zone📊 Technical Analysis
BTC holds the reclaimed 90-91k zone; staying > $91 500 keeps 98k then 108k in view.
💡 Fundamental Analysis
• Spot ETFs drew $381 M (21 Apr), $936 M (22 Apr) and $912 M (23 Apr) net inflows.
• Network hashrate hovers near the 1 000 EH/s ATH
• MicroStrategy lifted its stack to 461k BTC after a fresh 11k buy.
✨ Summary
Strong, accelerating ETF demand, shrinking liquid supply and ongoing corporate accumulation reinforce the bullish breakout, favouring a climb to 98-100 k while BTC holds above $91 500.
-------------------
Share your opinion in the comments and support the idea with a like. Thanks for your support!

BTC on the verge of another accumulation range breakoutMorning all! So its time for a proper set of markups having spent the last few months breaking down the charts in video format for you all.
The last BTC update I gave was on 24/03, in the 4 year cycle analysis breakdown. In that video i was expecting lower pricing into SSL and the range lows once more, forming a bottoming structure before seeing a HTF bullish reversal come through, aligning with the 4 year cycle where we have time to continue higher based on past cycle data and where we are in the current cycle.
A month later and we have seen that come through wonderfully after the sweep of the range lows and its time to reanalyse now the direction is changing....
BTC has formed another accumulation range down in these discounted levels over the last couple months and there was nothing really interesting taking shape until the last couple of days thats give us some real confirmation of a trend change in this accumulation range that we can now work with. Unlike the August 2024 bottom, there isnt a massive influx of volume on the sweep event. I was able to call the bottom after such a sweep and high volume event back then just days after but in this most recent range we havent seen volume like back in August 2024, so ive had to be more cautious of further downside until we get some market shift confirmations to confirm intent and be on the safer side here whilst still holding my HTF bias of new ATHs before cycle end.
As shown on the charts, ive marked up the range and stages. We have carried out the sellers climax event, forming the range low, into the automatic rally (AR) forming the range high, moving into the secondary test (ST) with a failure swing back to the lows which forms the secondary test in phase B. From there we continued to range before putting in another range low deviation in the Spring event, with tests of the range low before seeing this explosive move come through from the spring event back to the range highs.
Volume also supports price action with a high influx of volume on the sellers climax low, stopping the prior trend, decreasing volume in the range into supply with a further increase in buyer volume as we deviate the lows in the spring event.
We have also broke structure bullish in the range and formed a HH, with a HL yet to be formed....
**So whats next? **
It seems a lot more clear now after the last couple days, and also confirms intent behind the range and i think its safe to say we have formed a bottom here and my focus is now on the upside on BTC from here. After this range high deviation into supply, in this new HH, i wouldn't be surprised to see BTC pull back to the midpoint of the range between $84,000 - $76,500, back into demand and form a last point of support/demand in the accumulation range forming a HL, before another leg higher as shown.
With how price has set up, with the demand left behind in the range and the bullish intent, my focus is on BTC forming a HL from demand before a continuation higher in line with my HTF bias that we will see new ATHs again before the cycle end. This is also supported in what im seeing on USDT.D and USDC.D where they are distributing in their ranges in supply with breakdowns in both and moving to a bearish trend.
Therefore, when price corrects into these levels i will be looking to allocate risk into the market during the discount of the HL and I will be looking for my buys on DOGE and any other opportunities, where im expecting higher lows in the market before continuations higher across the board. This doesnt mean everything though as many alts are yet to catch up and flip bullish, so my focus will be on the higher quality, stronger coins such as DOGE, but i expect the rest of the market to catch up eventually as BTC runs higher from these lows.
1D:
3D:
1W:
1M:
