BTC/USD Short Setup – Triple Top Reversal with EMA Confirmation Entry Point (Sell): Around $85,699.52
Stop Loss: $86,741.44 (above resistance zone)
Target (Take Profit): $82,982.09
This provides a Risk-Reward Ratio of approximately 1:2, a commonly acceptable ratio in trading.
📈 Indicators:
EMA 30 (Red) is currently above the EMA 200 (Blue), indicating bullish momentum—but this setup anticipates a trend reversal.
If price breaks below the EMAs, that would confirm bearish strength.
🧠 Conclusion:
This setup is based on:
A strong resistance zone,
Bearish reversal pattern (triple top),
Risk management via stop loss and take profit levels.
If you're trading this:
Wait for confirmation with a bearish candlestick below the EMAs or a break of recent support.
Manage position size based on stop distance and your account risk tolerance.
Btcusdanalysis

#BTC/USDT#BTC
The price is moving within a descending channel on the 1-hour frame, adhering well to it, and is on its way to breaking it strongly upwards and retesting it.
We are experiencing a rebound from the lower boundary of the descending channel, which is support at 74,300
We are experiencing a downtrend on the RSI indicator, which is about to break and retest, supporting the upward trend.
We are looking for stability above the 100 Moving Average.
Entry price: 79,056
First target: 80,422
Second target: 81,950
Third target: 84,000

On a year on Year basis Bitcoin is where it was in early 2017
I have been talking about Bitcoin following the 2013 - 2017 Fractal and this chart shows us, in a different way, how this is still Valid.
The vertical lines on this chart are January of each year.
You can see from the Arrow on the left and right, where we are in relation to 2017.
Things to note
When we first touched the dotted line on both occasions, it led to a GREEN RED GREEN candle, however, in 2024, we got there earlier than we should have maybe and so we have had to "Wait" to fall back into date sequence.
Why ?
If we look back at 2017, we remained below that dotted line till end of April - Statistically MAY is a great month for Big moves
In my monthly candle analysis, I have also mentioned that using monthly candle close patterns, May is likely to be the better month for PA to rise higher
We seem to be playing this out BUT we need to notice how PA is Below that Dotted line.
PA is under pressure and yet in a great position though the trading volume is Low and consequentially, the candle sizes are not that impressive.
We are half way through April . Things will change and Fast......
Hang on

BITCOIN,H1bitcoin is sell, AFTER BREAK OUT
When should we exit our position?
86000$
Always decide for yourself
This analysis is just a personal opinion

BTCUSDT RISING WEDGE PATTERN IN 30-MI Created This BTCUSDT Chart Analysis In 30-M Tf
Entry: SELL from 85700
Resistance zone : 86200
Target Will Be : 83200
BINANCE:BTCUSDT made Rising wedge pattern, It's Seems bearish momentum, Let me know your thought in comments section

BTC Crypto Futures Trade Plan 2025-04-15BINANCE:BTCUSDT
Technical Analysis Synthesis:
Price Position Relative to Moving Averages: The current price of BTC ($83,690.70) is below the SMA (50) at $84,306.36 and significantly below the SMA (200) at $87,550.48, indicating a potential bearish trend. However, it is above the SMA (20) at $82,722.04, suggesting some near-term support. RSI Readings: With an RSI (14) of 50.32, BTC is neither in overbought nor oversold territory, indicating a neutral condition that does not strongly suggest a specific direction based on momentum alone. Bollinger Band Position and Width: The price is closer to the lower band ($77,705.82) than the upper band ($87,738.25), which could suggest oversold conditions or pending volatility. The bandwidth is relatively wide, indicating higher volatility. Key Support/Resistance Levels: Significant support is around the lower Bollinger Band ($77,705.82) and resistance near the SMA (50) and upper Bollinger Band.
Market Sentiment Integration:
Market Sentiment Data: The funding rate of 0.0000% suggests a neutral sentiment among futures traders, indicating no strong bias towards long or short positions. News Impact: Recent news has had mixed impacts, but overall, the market seems to be consolidating rather than trending strongly in one direction. On-Chain Metrics: Without specific on-chain data provided, it's challenging to assess sentiment directly from these metrics. However, historical price action suggests a potential for bearish continuation given the inability to surpass key resistance levels. Funding Rates and Open Interest: The zero funding rate indicates a balanced market, but without open interest data, it's difficult to gauge the market's overall positioning and potential for future moves.
Directional Determination:
Based on the technical analysis and market sentiment integration, the market direction appears to be Moderately Bearish. The price action below key moving averages, the failure to break through resistance, and the mixed sentiment data contribute to this assessment.
Trade Strategy Selection:
Given the moderately bearish outlook, a short position could be considered. The entry price would ideally be at or near the current price ($83,690.70), with a stop-loss above the SMA (50) or a recent high, and a take-profit target near significant support levels or based on a risk-reward ratio.
Trade Execution Plan:
Entry Price: $83,690.70 Stop-Loss: $85,000 (above the SMA (50) to account for potential resistance) Take-Profit: $80,000 (a significant support level based on historical price action) Position Size: 1 (assuming a unit size for simplicity; actual sizing should be based on risk management principles) Entry Timing: At market open, to capitalize on the potential bearish momentum indicated by the technical and sentiment analysis.
Risk Assessment:
Potential Downside Risk: Significant, given the volatile nature of cryptocurrency markets. Market Volatility Impact: High volatility could either amplify gains or losses. Correlation with Other Assets: BTC's movement can be correlated with other cryptocurrencies but may also be influenced by broader market sentiments. Liquidity Conditions: Assuming adequate liquidity for the trade, given BTC's status as a major cryptocurrency.
JSON Trade Plan:
{ "instrument": "BTC", "direction": "short", "entry_price": 83690.70, "stop_loss": 85000, "take_profit": 80000, "confidence": 0.60, "size": 1, "entry_timing": "market_open" }
Risk Warning:
Trading crypto futures with leverage is extremely risky and can result in significant losses. This strategy should only be used with proper risk management and position sizing. The provided plan is based on technical and sentiment analysis and should be adapted to individual risk tolerance and market conditions.
Disclaimer: This newsletter is not trading or investment advice but for general informational purposes only. This newsletter represents my personal opinions based on proprietary research which I am sharing publicly as my personal blog. Futures, stocks, and options trading of any kind involves a lot of risk. No guarantee of any profit whatsoever is made. In fact, you may lose everything you have. So be very careful. I guarantee no profit whatsoever, You assume the entire cost and risk of any trading or investing activities you choose to undertake. You are solely responsible for making your own investment decisions. Owners/authors of this newsletter, its representatives, its principals, its moderators, and its members, are NOT registered as securities broker-dealers or investment advisors either with the U.S. Securities and Exchange Commission, CFTC, or with any other securities/regulatory authority. Consult with a registered investment advisor, broker-dealer, and/or financial advisor. By reading and using this newsletter or any of my publications, you are agreeing to these terms. Any screenshots used here are courtesy of TradingView. I am just an end user with no affiliations with them. Information and quotes shared in this blog can be 100% wrong. Markets are risky and can go to 0 at any time. Furthermore, you will not share or copy any content in this blog as it is the authors' IP. By reading this blog, you accept these terms of conditions and acknowledge I am sharing this blog as my personal trading journal, nothing more.

BTC LONG TP:88,200 13-04-2025🚀 It's time to go Long! The targets are set between 88,000 and 88,300, with the 1-hour and 2-hour timeframes showing a clear bullish pattern in favor of this trend.
We expect this movement to materialize within a timeframe of 20 to 25 hours, so make sure to enter and average down.
Stay tuned for updates to maximize your gains. Follow me to stay informed and add those greens! 💰🔥

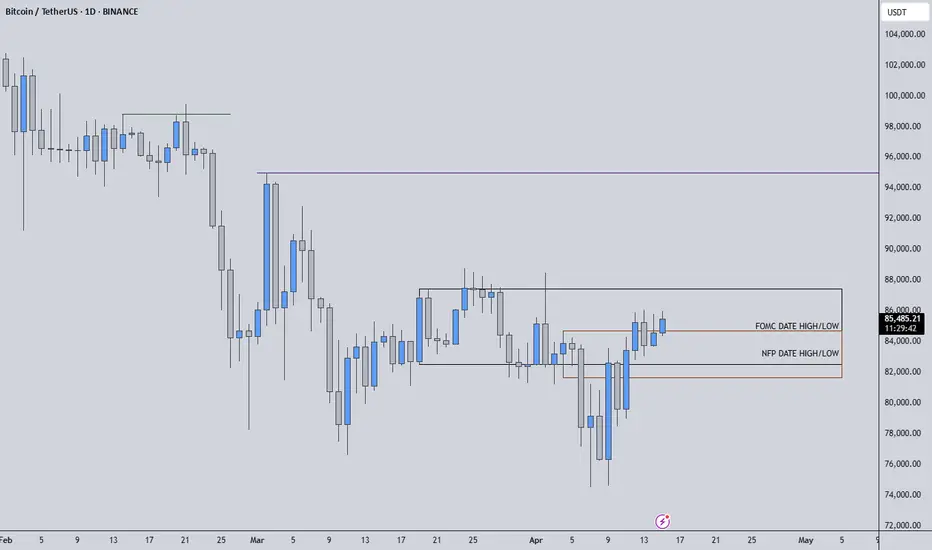
BTCUSDT | FOMC & NFP Highs and Lows as Critical Pivot LevelsThis current structure on Bitcoin is giving us a beautiful narrative rooted in macro timing: we've regained the NFP day levels, and now we’re trading right inside the highs and lows of the FOMC date—a zone that historically acts as a decision-making pivot for the market.
📍 Why These Levels Matter:
NFP and FOMC sessions are not just about volatility—they often define institutional positioning and sentiment shifts.
We’ve already regained NFP day's range, showing bullish resilience and strength.
Now all eyes are on the FOMC range: if we manage to break and retest the high of the FOMC candle, it can ignite momentum toward the monthly target.
🧠 How I’m Thinking About It:
I’m not jumping the gun. I’ll wait for lower time frame confirmations, ideally some clean breaks with supportive delta and CDV structure.
If we fail to hold these levels and fall back inside, I won’t insist on any long idea. I’ll flip short the moment downside momentum is confirmed.
💬 Final Thought: We don't randomly mark levels. These are deliberately chosen based on price behavior during major economic events—something most traders overlook. That’s what gives us the edge. If you're following me, you're not trading noise. You're learning to understand the story behind price action.
Watch these levels closely. They may be the starting point of something much bigger.
📌I keep my charts clean and simple because I believe clarity leads to better decisions.
📌My approach is built on years of experience and a solid track record. I don’t claim to know it all but I’m confident in my ability to spot high-probability setups.
📌If you would like to learn how to use the heatmap, cumulative volume delta and volume footprint techniques that I use below to determine very accurate demand regions, you can send me a private message. I help anyone who wants it completely free of charge.
🔑I have a long list of my proven technique below:
🎯 ZENUSDT.P: Patience & Profitability | %230 Reaction from the Sniper Entry
🐶 DOGEUSDT.P: Next Move
🎨 RENDERUSDT.P: Opportunity of the Month
💎 ETHUSDT.P: Where to Retrace
🟢 BNBUSDT.P: Potential Surge
📊 BTC Dominance: Reaction Zone
🌊 WAVESUSDT.P: Demand Zone Potential
🟣 UNIUSDT.P: Long-Term Trade
🔵 XRPUSDT.P: Entry Zones
🔗 LINKUSDT.P: Follow The River
📈 BTCUSDT.P: Two Key Demand Zones
🟩 POLUSDT: Bullish Momentum
🌟 PENDLEUSDT.P: Where Opportunity Meets Precision
🔥 BTCUSDT.P: Liquidation of Highly Leveraged Longs
🌊 SOLUSDT.P: SOL's Dip - Your Opportunity
🐸 1000PEPEUSDT.P: Prime Bounce Zone Unlocked
🚀 ETHUSDT.P: Set to Explode - Don't Miss This Game Changer
🤖 IQUSDT: Smart Plan
⚡️ PONDUSDT: A Trade Not Taken Is Better Than a Losing One
💼 STMXUSDT: 2 Buying Areas
🐢 TURBOUSDT: Buy Zones and Buyer Presence
🌍 ICPUSDT.P: Massive Upside Potential | Check the Trade Update For Seeing Results
🟠 IDEXUSDT: Spot Buy Area | %26 Profit if You Trade with MSB
📌 USUALUSDT: Buyers Are Active + %70 Profit in Total
🌟 FORTHUSDT: Sniper Entry +%26 Reaction
🐳 QKCUSDT: Sniper Entry +%57 Reaction
📊 BTC.D: Retest of Key Area Highly Likely
📊 XNOUSDT %80 Reaction with a Simple Blue Box!
📊 BELUSDT Amazing %120 Reaction!
I stopped adding to the list because it's kinda tiring to add 5-10 charts in every move but you can check my profile and see that it goes on..
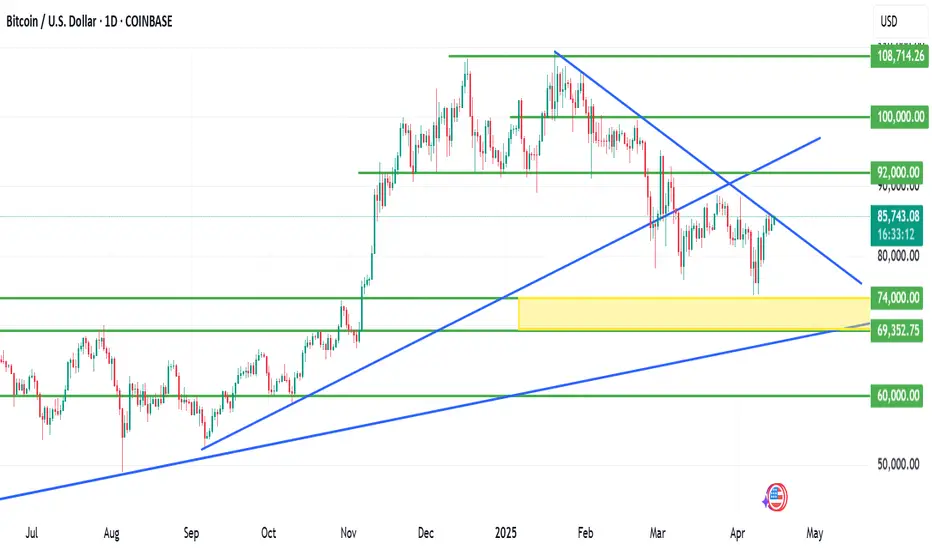
BITCOIN is kissing a critical resistance zone.BITCOIN is kissing a critical resistance zone.
Bitcoin is currently kissing a critical resistance zone, hovering around the $85,500 level. This region aligns closely with a descending trendline that has historically capped BTC rallies, and this test comes after a sharp recovery from a local low near $74,000, a drop that was triggered in tandem with broader risk-asset selloffs following U.S. tariff announcements and rising global macroeconomic tension.
Technical Analysis
The descending trendline (marked in blue on the chart) acts as a key resistance.
A daily close above $85,800 - $86,200 could confirm a breakout, potentially paving the way for a fresh attempt toward the $90,000 psychological level.
Conversely, failure to break and hold above this resistance could cause a rejection and pullback.
Immediate downside support lies at the previous local low (~$74,000), and below that, the next strong support zone is around $69,000 (yellow block on chart).
Fundamental Backdrop
Bitcoin continues to be driven by macroeconomic news, institutional flows, and growing ETF inflows.
If fundamentals remain bullish, including continued institutional accumulation, favorable regulatory developments, or increased on-chain activity, they could fuel momentum for a breakout.
The market doesn’t reward assumptions — it rewards preparation.
Whether it’s a breakout or a pullback, risk management should always come first. As always, protect your capital before thinking of profit. Use stop-losses, scale your entries, and avoid over-leveraging in volatile zones like this.
What’s your take on BTC at this juncture?
Do you see a breakout brewing, or is this another trap for over-leveraged bulls?
Let’s discuss

Bitcoin Bulls Pave Path to $100,000FenzoFx—Bitcoin is trading bullishly, staying above the 50-period SMA and the 81,160 support. Currently, it hovers around $85,650, testing resistance.
As long as prices hold above 81,160, the next target could be $88,650. However, if bears push below $82,811, consolidation may occur, with support at 81,160.
Trade BTC/USD swap-free, effortlessly. >>> FenzoFx Decentralized Forex Broker

BITCOIN is kissing a critical resistance zoneBITCOIN is kissing a critical resistance zone.
Bitcoin is currently kissing a critical resistance zone, hovering around the $85,500 level. This region aligns closely with a descending trendline that has historically capped BTC rallies, and this test comes after a sharp recovery from a local low near $74,000, a drop that was triggered in tandem with broader risk-asset selloffs following U.S. tariff announcements and rising global macroeconomic tension.
Technical Analysis
The descending trendline (marked in blue on the chart) acts as a key resistance.
A daily close above $85,800 - $86,200 could confirm a breakout, potentially paving the way for a fresh attempt toward the $90,000 psychological level.
Conversely, failure to break and hold above this resistance could cause a rejection and pullback.
Immediate downside support lies at the previous local low (~$74,000), and below that, the next strong support zone is around $69,000 (yellow block on chart).
Fundamental Backdrop
Bitcoin continues to be driven by macroeconomic news, institutional flows, and growing ETF inflows.
If fundamentals remain bullish, including continued institutional accumulation, favorable regulatory developments, or increased on-chain activity, they could fuel momentum for a breakout.
The market doesn’t reward assumptions — it rewards preparation.
Whether it’s a breakout or a pullback, risk management should always come first. As always, protect your capital before thinking of profit. Use stop-losses, scale your entries, and avoid over-leveraging in volatile zones like this.
What’s your take on BTC at this juncture?
Do you see a breakout brewing, or is this another trap for over-leveraged bulls?
Let’s discuss
BTCUSD – Bullish Breakout Loading ?
📈 *Bitcoin Daily Chart Analysis – April 14, 2025*
Bitcoin is looking 🔥 as it pushes higher from a key **accumulation zone** after a sharp recovery from recent lows. The previous **rising channel** was broken to the downside, but now the price is forming a solid **bullish structure**, suggesting a strong comeback is in play!
---
### 🔍 Technical Highlights:
- ✅ **Demand Zone Bounce:** Clean rebound from the highlighted green box (accumulation area), signaling buyer strength.
- 📈 **Higher Highs Incoming?** Price is now consolidating near **$85,000**, with bullish momentum building.
- 📊 **Upside Target:** Eyes on $87,000 → $88,500 if momentum sustains and daily closes continue above resistance.
- 📌 **Key Support:** $84,000 holds the line — invalidation below that would shift bias.
---
### 🧠 Trader's Insight:
The structure is setting up for a **potential bullish continuation**. Momentum traders should watch for a confirmed break and close above $85,400 for further upside! 🚀
💬 *"Patience in accumulation pays in breakout."*
Ready to catch the next leg up? 📲 Let’s trade smart and ride the wave.

Bitcoin Reversal After Fake Bullish Divergencehello guys.
Fake Bullish Divergence:
The Relative Strength Index (RSI) at the bottom shows a bullish divergence, but the price action invalidated it — signaling a "fake divergence".
This could trap early long positions and fuel further downside.
Broken Trendline Support:
A significant ascending trendline support has been broken, indicating weakening bullish momentum.
The recent bounce back seems corrective rather than impulsive.
Price Projection:
An arrow points downward toward the horizontal support around $69,149, hinting at a possible drop in price.
This level coincides with the intersection of the mid-channel support line and horizontal price structure.
Channel Structure:
The overall chart operates within a large ascending channel.
A revisit of the lower bound of the channel aligns with the projected price target.
-------------------------------------
Conclusion:
Despite the recent rebound, Bitcoin is showing signs of weakness due to a fake bullish RSI divergence and a broken ascending trendline. The technical setup suggests a potential decline toward the $69,000–71,000 support zone before any meaningful recovery can occur. Caution is advised for bullish traders until the price confirms a stronger support or reversal signal.

Bitcoin BTC price analysisThis is approximately the roadmap we have "imagined" for the coming weeks for the movement of the CRYPTOCAP:BTC price:
1️⃣ The most optimistic scenario is that the OKX:BTCUSDT price stays above $76100 - 77100, which means that the “bottom” has finally been found, and we can organize at least a rebound to $94k.
2️⃣ Not a pleasant scenario, but not the worst either, is another update of the local lows of #Bitcoin to $71100 and from there a rebound to the above-mentioned $76100-77100 zone, where we will have to "looking out" again: where to go next...
3️⃣ The most pessimistic, and maybe the most realistic scenario in times of total uncertainty, when it is not clear what the "rusty can" will wake up with in. ✊
All market participants will delay their "buying" decisions as much as possible until it becomes clear whether the Fed will cut the rate or not. The next FOMC meeting is on 07.05.25.
To understand what will happen to altcoins during this time, you need to at least monitor and analyze the #BTC.D and #USDT.D indicators, which we do daily in our reviews in...
✍️ It is your right, if not your duty, to follow this plan or make your own adjustments!)
And we will be happy to read and see your charts, with your forecasts for the near future in the comments below the idea.

BTC/USDTbitcoin hit our target of 85k from the 77k entry.
a small correction is expected here to 82k-84k due to resistance from the 200 day and 50 day emas before rise.
next target:95K

BTC with a double top formation.BTC with a double top formation.
Are we in for a long sell ride?
Has the imminent midterm sell started?
Are we breaking the $100K zone towards $90K this time?
Trump swearing was the catalyst we waited for to fire this asset to the moon lately.
Let's see what plays out.
Trade with care.

Short - term Upside & Mon. Outflow RiskAnalysis of the Price Trend of Bitcoin 📈: Short - term Upward Expectations 💰 and the Risk of Capital Outflow on Monday 💸
The current price of BTC is at 84,500 points. 📊
Considering various factors comprehensively, there is a possibility that the price will rise to around 86,500 points tomorrow. 🚀 This could be due to factors like positive market sentiment or recent trends in the cryptocurrency space. 💰
However, when other markets open on Monday, the situation of a large amount of capital flowing out to other trading fields also deserves attention. 😟
Especially the flows to the XAU/USD and USOIL markets, or other foreign exchange markets. 💱 The movement of funds to these areas might be influenced by economic news, geopolitical events, or simply portfolio re - balancing by investors. 📰
💰💰💰 BTCUSD 💰💰💰
🎯 Buy@84000 - 84500
🎯 TP 85500 - 86500
Recently, the market has been extremely volatile 😱, which has led to the clearing of many traders' accounts or significant losses 😫. You can follow my signals and gradually recover your losses and achieve profitability 🌟💪.
Traders, if you're fond of this perspective or have your own insights regarding it, feel free to share in the comments. I'm really looking forward to reading your thoughts! 🤗

BTC BTC is consolidating for further upside, we will see some reaction above 90K after small correction.
Disclosure: We are part of Trade Nation's Influencer program and receive a monthly fee for using their TradingView charts in our analysis.

Bitcoin's Bounce, Your Weekly Scoop on the Bullish Surge !The market has unfolded as anticipated, aligning with our projections.
Short-Term Outlook: Expect a relatively narrow trading range this week due to the absence of major news catalysts.
Bullish Perspective: We maintain a bullish stance, targeting a price range of $88,000–$92,000.
Local Bottom Confirmation: Bitcoin appears to have established a local bottom. Notably, it diverged from Ethereum, which recorded lower lows, while Bitcoin resisted forming a new low.
Technical Analysis: Last week, Bitcoin respected a daily bullish order block, resulting in a strong upward move.
Key Support Level: This week, an inverse fair value gap (FVG) on the daily chart around $82,400 is expected to act as a liquidity zone and support, with price likely to tap this level and rebound higher.
Thank you for your support! Stay tuned for more insights and drop a Like if you loved it 🚀

Bitcoin following 2013-2017 Fractal UPDATE - have we left it ?This chart remains unchanged from the last time I posted it except for the addition of that yellow Dashed Arrow
As we can see, PA fell below the Fractal in Late February and ever since, we have ranged further away from it.
Does this mean we have left the fractal we have been on since November 2021 ?
Not really.
PA fell below it in 2022 due to pressures from Interest rates making companies collapse and sentiment being negative.
We have fallen below it this time purely because PA was so overbought, it needed to recover.
This can be very clearly seen on the Weekly MACD, where in 2024, we ranged for months because of the same reason.
See how on the weekly MACD, how once we reached near Neutral, we bounced back up to a New ATH and, ever since, BTC PA has ranged while waiting for the MACD to cool off..
And now we are there. MACD is in the bounce zone and has shown some strength in the last few days.
So, The Fractal
For PA to get back above that Fractal, we need PA to make a very strong push higher. and as you can see from the Bold Arrow, this is achievable by end of May if PA rises Strong and continually
form here.
I am not to sure this will happen.
We have so many Macro events destabilising the markets...
I am more inclined to think PA will hit that circle , and we will likely follow the Dashed Arrow to a cycle ATH of near 300K, by the end of the year at the latest.
This is the Path of safety.
Things can always change for the better or for the worse and so we have to be ready for all occasions.
But BULLISH is the word - BUT BITCOIN ON SPOT, HOLD IT AND RELAX

Bitcoin Short Term Danger (4H)Bitcoin has formed a rising wedge pattern, typically considered a bearish reversal structure, suggesting a potential retracement ahead.
Watch for a possible breakdown around the $83,800 level. If this level is breached, price may head toward the $79,000–$80,000 zone, where stronger buying interest is expected.
This potential move also aligns well with key Fibonacci retracement levels, providing confluence for the setup.
Furthermore, the Bitcoin CME Futures chart supports this scenario — a large gap is expected to open tomorrow, and historically, Bitcoin tends to fill CME gaps in the short term.
— Thanks for reading.

"Bitcoin Bearish Reversal Setup: Supply Zone Short Strategy"🔵 SUPPLY ZONE (Resistance Area)
💥 Strong selling area around 85,800 - 87,800 USD
Historically, price got rejected here
Expect sellers to step in again
✍️ ENTRY POINT
📍 Just below the supply zone (~85,889.89)
Ideal for short position setup
Watch for bearish candlestick patterns for confirmation
🛑 STOP LOSS
❌ Placed above the supply zone at 87,796.97
Keeps risk under control if breakout happens
🎯 TARGET POINT (Support Area)
📉 Around 78,000 USD
Marked by previous support and structure
Great Risk-to-Reward ratio
📐 PATTERN WATCH
Looks like a harmonic pattern (maybe Gartley or Bat) 🦇
Suggests reversal from point D
Also resembles a rising wedge, which is bearish
📊 EMA (9-period)
🧭 Price hovering above the 9 EMA (84,704)
A break below it = bearish confirmation
Summary
🔻 Bearish bias
🛒 Short near supply zone
❌ SL above 87,800
🎯 TP around 78,000

Weekly Support is around 80000.Weekly Support is around 80000.
However, 72500 - 73000 is its previous
breakout level & probably a Best Buying Rage
(if it touches) which is also a Confluence area of
Trendline Support+Important Fib. level.
Bullish Divergence on Shorter Time Frame +
Weekly Support around 80000 (if Sustained)
may push the Price up towards 87000 &
then around 95000 - 96000.
Ultimate Resistance is around 110000.
Crossing this level may open new Highs
Targeting around 136000.
On Shorter Timeframe, 85000 - 86000 is
the Immediate Resistance & Support is
around 80000.
