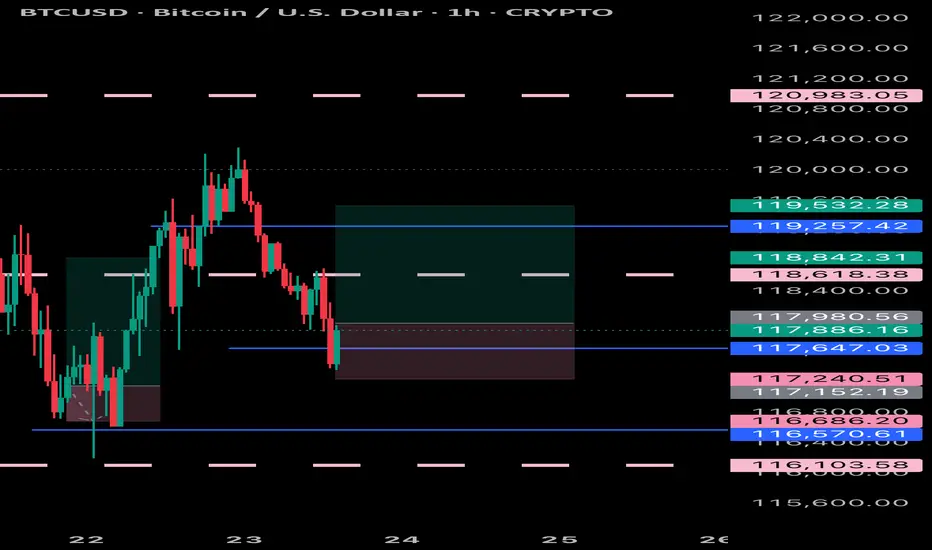
BTCUSD LOST SHORT-TERM BULLISH POTENTIALBTCUSD LOST SHORT-TERM BULLISH POTENTIAL
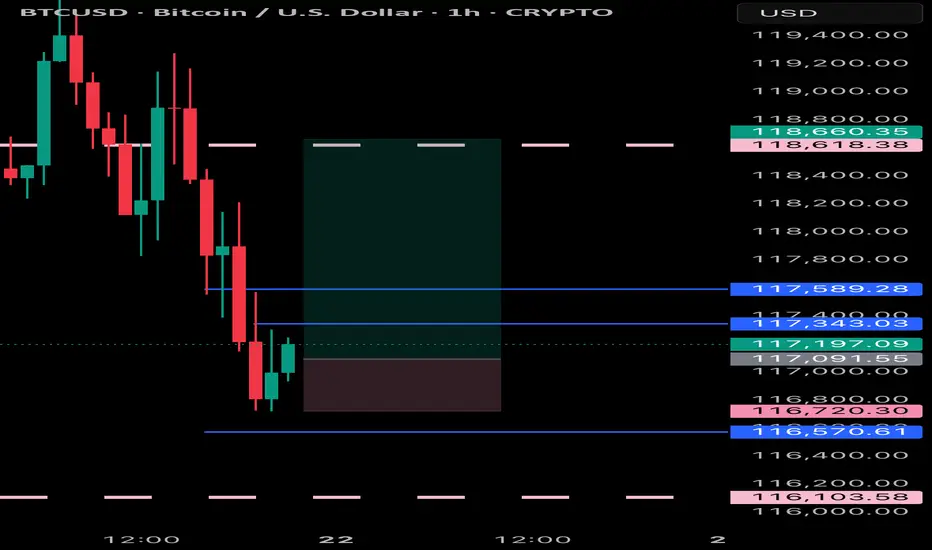
Bitcoin has been trading sideways since July 15th within a range of 116,000.00-120,000.00. Indicators show no signs of a new bullish/bearish trend.
How to trade sideways movements or range?
It is better to wait for a price to come close to one of the levels (support or resistance), then open buy/sell order. Or just pace a limit order and wait. Take-profit may be above/below the support/resistance levels with a stop-loss behind these levels (below for the support and above for the resistance).
So, the price decline towards 116,000.00 is expected, where potentially the price may rebound once again.
Btcusdanalysis

Bitcoin Awaits the Federal Voice - The Threshold of Compression.⊢
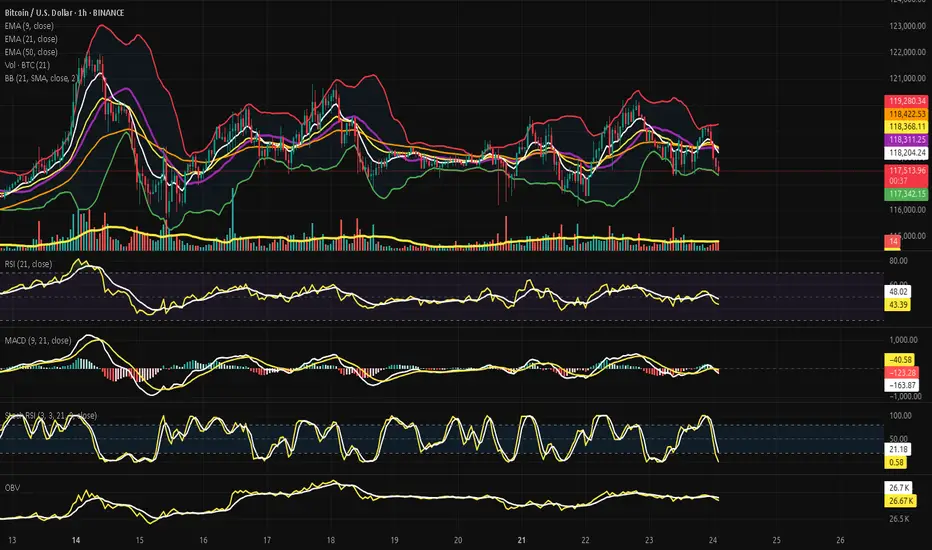
⟁ BTC/USD - BINANCE - (CHART: 1H) - (July 24, 2025).
◇ Analysis Price: $117.830,17.
⊣
⨀ I. Temporal Axis - Strategic Interval - (1H):
▦ EMA9 - ($118.267,48):
∴ The 9-period Exponential Moving Average (EMA9) was serving as immediate microstructural support until July 23rd, when a full-bodied bearish candle broke through it with volume below average but directionally firm;
∴ Post-break, EMA9 began to flatten, then bend downward, reflecting a tactical loss of bullish momentum within the intraday range structure;
∴ Price has attempted multiple recoveries toward EMA9 but has been consistently rejected at or below it, confirming its transition into resistance status.
✴️ Conclusion: EMA9 has transitioned from a dynamic support to tactical resistance, indicating a short-term trend deterioration and weakening of upward initiative.
⊢
▦ EMA21 - ($118.396,85):
∴ The 21-period EMA functions as the median layer of microstructure and has held relatively flat for several days, suggesting a compressed momentum environment;
∴ As of the latest price action, the EMA9 has definitively crossed below EMA21 - a classic tactical signal of microtrend exhaustion, especially when paired with lateral volume and a suppressed RSI;
∴ EMA21 remains unbroken since July 21st, reinforcing its role as an anchor level for short-term rejections and as a ceiling against breakout attempts.
✴️ Conclusion: EMA21 maintains structural weight as resistance, and the confirmed cross-under by EMA9 introduces a tactical shift into intraday bearish flow.
⊢
▦ EMA50 - ($118.434,93):
∴ The 50-period EMA, long considered the “defensive perimeter” of bullish short-term structure, had been flattening with slight upward bias since July 19th;
∴ However, in the last two sessions, it has shown the first measurable downward curvature, marking the decay of medium-term intraday bullish control;
∴ Price remains significantly below the EMA50, and multiple upside attempts have failed before even reaching it, reflecting market hesitation and lack of participation.
✴️ Conclusion: EMA50 has begun its first bearish slope since July 16th, indicating an eroded tactical bias and confirming loss of momentum from the bulls' side.
⊢
▦ Bollinger Bands (21, 2) - (Upper: $119.254,34 / Lower: $117.398,28):
∴ The Bollinger Bands have narrowed continuously over the last three sessions, forming a visible compression channel - a prelude to volatility expansion;
∴ Price rejected cleanly from the upper band on July 23rd and traveled to the lower band without support, closing two candles consecutively near the lower range;
∴ The Bollinger Median is aligned with the EMA21, reinforcing its status as the core compression axis and tactical gravity point.
✴️ Conclusion: Bollinger structure suggests imminent breakout scenario; current price behavior signals bearish volatility bias unless structure is broken with strong volume.
⊢
▦ Volume + EMA 21 - (Current: 13 BTC):
∴ Volume has declined steadily throughout the last five trading sessions, as seen in the downward-sloping EMA21 overlaid on the volume histogram;
∴ Recent bearish moves occurred on lower volume compared to previous weeks, indicating low conviction and possible manipulation-prone liquidity zones;
∴ There is no expansion in volume accompanying the most recent directional candles, confirming this as a phase of tactical disinterest rather than distribution.
✴️ Conclusion: Market participants are not committing capital - the tape is flat, silent, and manipulable, increasing the risk of abrupt fakeouts or shadow breakouts.
⊢
▦ RSI (21) + EMA 9 - (Current RSI: 45.55):
∴ The Relative Strength Index has remained below the 50-neutral mark for three sessions, with a confirmed downward slope and rejection from its 9-period EMA overlay;
∴ There is no sign of divergence, bullish or bearish, suggesting that price action is neither exhausted nor ready to reverse;
∴ RSI’s current position confirms momentum is negative but controlled - an environment of inertia rather than acceleration.
✴️ Conclusion: RSI confirms tactical weakness - directional force is absent, and momentum favors sellers in a low-intensity regime.
⊢
▦ Stochastic RSI (3, 3, 21, 9) - (Current: 4.32):
∴ The Stoch RSI has fallen into extreme oversold territory after failing to sustain a double-top formation near the 80-level earlier this week;
∴ The plunge occurred with speed and depth, signaling loss of buying initiative - often a precursor to passive rebounds without follow-through;
∴ Current readings near zero indicate the potential for technical retracement, but no reversal confirmation is present without RSI and MACD alignment.
✴️ Conclusion: The oscillator signals oversold status, but the context suggests any bounce would be corrective, not impulsive - a trap for premature long entries.
⊢
▦ MACD (9, 21) - (MACD: -95.69 / Signal: -129.37):
∴ MACD histogram shows initial contraction of bearish momentum, but remains submerged below the zero-line and far from a clean crossover;
∴ MACD line is attempting to turn up, but the signal line remains significantly below it, indicating lack of consensus between short and medium-term momentum;
∴ Previous fake signals from MACD in this range suggest caution divergence is visible, but -structure is weak.
✴️ Conclusion: MACD shows early signs of momentum divergence, but without structure or volume, the setup remains fragile and unconfirmed.
⊢
▦ OBV + EMA9 - (OBV: 26.69K):
∴ On-Balance Volume has entered a horizontal band with no structural incline or decline for three consecutive days;
∴ OBV's 9-period EMA is now perfectly flat, reflecting market indecision and a symmetrical distribution of volume over time;
∴ No bullish or bearish divergence is visible, indicating that volume flow is passive and non-directional.
✴️ Conclusion: OBV confirms tactical silence in the order book - structure lacks engagement, and accumulation or distribution is absent.
⊢
🜎 Strategic Insight - Technical Oracle:
∴ All indicators on the H1 chart converge toward a single message: tactical drift within a structurally neutral, low-volume regime;
∴ The EMA's are aligned downward, RSI is slipping without exhaustion, MACD offers unconfirmed divergence, and Stoch RSI is oversold without structure;
∴ This constellation presents a dangerous battlefield - one where silence reigns louder than signal;
∴ Breakouts are possible, but not probable without macro ignition.
⊢
∫ II. On-Chain Intelligence - (Source: CryptoQuant):
▦ Exchange Reserves + 9EMA - (All Exchanges):
∴ Bitcoin reserves on centralized exchanges have decreased from (~2.46M) to 2.41M Bitcoin over the past 30 days, but the decline halted on July 21st and entered a horizontal range;
∴ This plateau indicates a pause in the long-term outflow trend, suggesting that neither accumulation nor distribution is dominating;
∴ Exchange reserves are a key liquidity gauge, and flatlining implies equilibrium between withdrawal behavior and deposit pressure.
✴️ Conclusion: No liquidity threat from centralized exchange reserves - a neutral signal in an inert market.
⊢
▦ Funding Rate + 9EMA - (All Exchanges):
∴ The funding rate remains mildly positive across perpetual contracts, indicating a slight long bias - (+0.008);
∴ However, the rate is far from extremes that would signify either overleveraging or liquidation risk;
∴ Historical context shows that a funding rate near zero during price stagnation often precedes volatility expansion.
✴️ Conclusion: Cautious optimism present among derivatives traders, but not enough to drive trend - latent energy, directionless.
⊢
▦ Stablecoin Ratio + 9EMA - (All Exchanges):
∴ The ratio of stablecoins to Bitcoin on exchanges remains at all-time lows, signaling an environment with reduced buying power;
∴ This lack of fresh capital severely limits the capacity for breakout rallies, especially when combined with poor volume and flat OBV;
∴ No stablecoin inflows = no fuel for upward movement.
✴️ Conclusion: The market is liquidity-starved - stablecoin ratio confirms lack of bullish firepower.
⊢
▦ Realized Cap + 9EMA:
∴ Realized Cap has surpassed the $1 trillion mark for the first time, suggesting robust conviction among holders and long-term participants;
∴ This metric rises only when coins move at a profit, indicating that active participants are not capitulating but rather holding or consolidating;
∴ The Realized Cap trajectory diverges from flat spot price - an arcane sign of underlying strength.
✴️ Conclusion: Structural confidence remains intact at the macro level - price inertia belies silent conviction.
⊢
🜎 Strategic Insight - On-Chain Oracle:
∴ On-chain metrics whisper stability;
∴ No excessive optimism, no panic, just a dry and frozen battlefield;
∴ Exchange reserves are flat, stablecoin ratio is weak, but Realized Cap shows unwavering belief; ∴ If the market breaks, it will be macro-induced - not on-chain triggered.
⊢
✴️ Codicillus Silentii - Strategic Note:
∴ The gatekeepers are at the threshold:
Jerome Powell’s speech: July 25;
U.S. GDP Q2 (Preliminary): July 26.
∴ Both are macro-keystones that will either ignite movement or deepen compression. The tape is silent because the world awaits signal.
⊢
𓂀 Stoic-Structural Interpretation:
▦ Structurally Neutral - Tactically Bearish Drift.
∴ EMA's aligned downward, RSI below midline, OBV stagnant - no strength, no collapse;
∴ Bearish drift, but no conviction.
▦ Tactical Range Caution:
∴ Support: $117.400 - (lower Bollinger limit);
∴ Resistance: $118.900 - (EMA cluster + BB midline).
✴️ Final Seal: Bitcoin rests under the veil of compression. Eyes turn to Powell. Silence prepares the break.
⊢
✴️ Final Codex Interpretation:
∴ The chart speaks not in fire nor fury - but in breathless tension:
Each line, curved and silent, awaits the tremor of a greater voice;
The market is not weak - it is listening. And what it hears may not be price, but power.
∴ The candles drift beneath their own gravity:
The EMA's now form a declining constellation, dimming the tactical skies;
No reversal, no collapse - only weightless time.
∴ Volume is not a storm. It is absence:
And absence in markets is not peace - it is preparation.
∴ On-chain, conviction stands with sealed lips:
Reserves unmoved, stablecoins withdrawn, but Realized Cap ascends - as if the soul of Bitcoin advances, while the flesh waits behind.
∴ And above all - the macro sphere:
Two seals remain locked: Powell’s speech and GDP;
One whispers interest rates. The other shouts reality.
⊢
✶ This is not a trend. It is a pause in fate;
✶ This is not weakness. It is breath before the chant.
⊢
✴️ Conclusion Codex Interpretation:
∴ Bitcoin is in deliberate suspension - structurally stoic, tactically inert;
∴ A sovereign asset waiting not for buyers, but for context;
∴ The gate opens July 25th. Until then: silence reigns.
⊢
⧉
· Cryptorvm Dominvs · MAGISTER ARCANVM · Vox Primordialis ·
⚜️ ⌬ - Silence precedes the next force. Structure is sacred - ⌬ ⚜️
⧉
⊢
Bitcoin (BTC/USD) 4H CHART - BULLISH PENNANT PATTERN 📊 Bitcoin (BTC/USD) 4-Hour Chart – Bullish Pennant Formation
Bitcoin (BTC) forming a bullish pennant pattern on the 4-hour timeframe.
A bullish pennant often appears after a strong upward move, followed by a period of consolidation, and usually signals a continuation to the upside.
🔍 Key Highlights:
Pattern: Bullish Pennant – a continuation pattern that forms after a strong rally (flagpole), followed by a tightening price range.
Resistance Trendline: The upper black line showing lower highs — where price has repeatedly faced selling pressure.
Support Trendline: The lower black line showing higher lows — where buyers have been stepping in.
Breakout Zone: Price is nearing the apex of the pennant. A breakout above the resistance line would likely confirm the bullish move.
Target Projection: If the breakout is successful, the target is around $123,960, based on the height of the flagpole.
Breakout and Retest: The chart also shows a possible retest of the trendline after breakout, which is common and can offer a second entry point for traders.
Volume Watch: A valid breakout usually comes with increased volume. Monitoring this can help confirm the move.
📉 Downside Possibility:
If the price fails to break out and falls below the support trendline, it could invalidate the pattern and lead to a bearish move — possibly retesting the $110,000 area.
---
The market is at a decision point. If BTC breaks above the resistance and retests successfully, it could push toward $123K. However, traders should watch for both breakout confirmation and false moves.

A good time to reentry Short BTCAlways i nice to reentry in profits
entry level 119.000
targets 116.600 / 115.600
SL 119.600
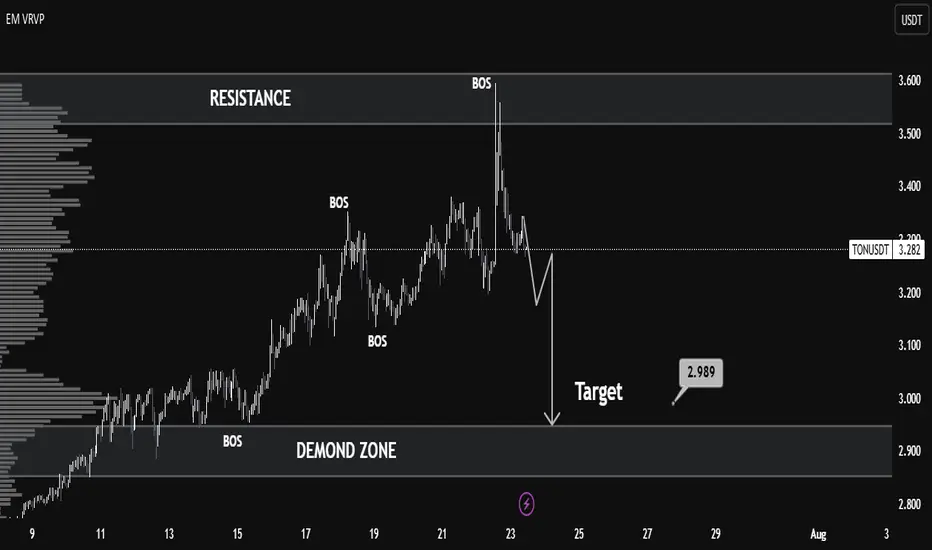
TONUSDT Technical Analysis – Bearish Shift with Clean TargetMarket Context:
TONUSDT recently showed strong bullish momentum, breaking multiple structure levels (noted as BOS – Break of Structure), indicating a clear uptrend. However, the most recent price action reveals a sharp rejection from the resistance zone around 3.55–3.60, marking a significant trend reversal.
Key Levels:
Resistance: 3.55 – 3.60
Price tested this zone and was strongly rejected, forming a potential top.
Demand Zone: 2.88 – 2.99
This zone provided previous accumulation and serves as a probable liquidity area and downside target.
Target: 2.989
The chart marks this as the near-term bearish objective, aligning with the volume node and prior demand.
Technical Signals:
Multiple BOS (Break of Structure):
Confirmed bullish structure earlier, but the latest BOS downward indicates a possible trend reversal.
Volume Profile (VRVP):
Shows high volume nodes around 3.00, suggesting strong market interest at lower levels — acting as a magnet for price.
Bearish Market Structure:
After the peak, the lower highs and lower lows pattern reflects short-term bearish dominance.
Liquidity Grab & Selloff:
The spike above resistance likely induced liquidity before a rapid selloff — classic distribution behavior.
Outlook:
If the market fails to reclaim levels above 3.35, a bearish continuation toward 2.989 remains likely.
The demand zone (2.88–2.99) is a critical area where buyers may re-enter — look for reversal signals here.
Conclusion:
TONUSDT has shifted from bullish to bearish in the short term. A clean rejection from resistance and strong structural breaks suggest a move toward the 2.989 demand zone. Traders should watch for confirmation of support or continuation upon reaching this level.
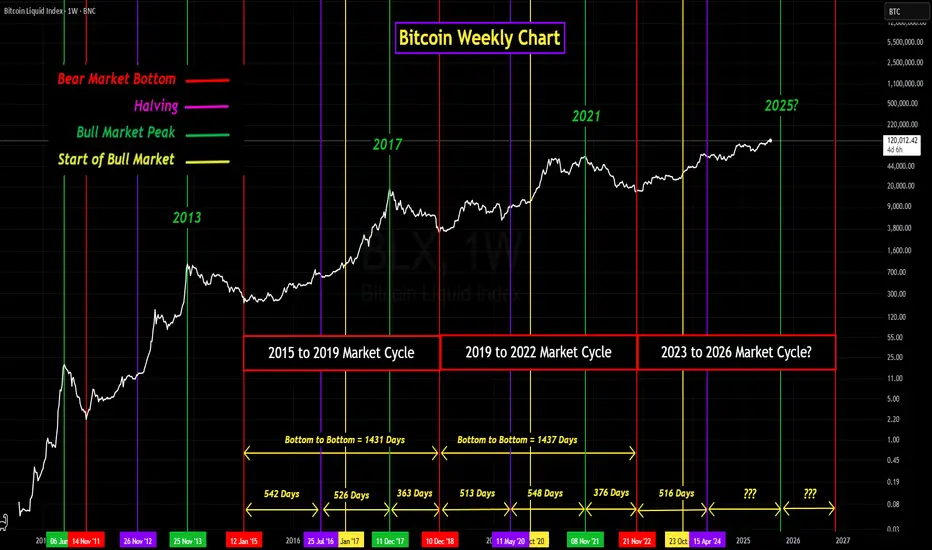
GROK's Analysis of Bitcoin's 4-Year Market CyclesIn the past I have published my own analysis of Bitcoin's 4-year market cycles, (cycles 2 and 3).
My purpose for analyzing the market cycles was to determine how similar in elapsed times the last two market cycles were to each other. Not only in the length of the overall market cycle but also between the major events, (bear market low to the halving, halving to the market cycle peak, and market cycle peak to the next bear market low).
The results of my analysis shocked me. Not only were the last two cycles very close in overall length but they were also (in my opinion) very close in the elapsed times between the major events. I was shocked because an open market, whether it is the stock market, crypto market, or any other openly traded market can be influenced by so many different factors both inside and outside of the market.
Internal factors that can influence an openly traded market could include, Supply and demand dynamics, market sentiment (investor psychology) and speculation, and market structure. External factors can include Macroeconomic conditions, Geopolitical events, Regulatory environment, Global events and crises, Interplay and volatility, and Monetary policy and liquidity. Then add into all of these influential factors that the Bitcoin market is traded globally, 24 hours a day, 7 days a week, and 365 days a year, it never closes.
Taking all of these influential factors into consideration, it boggles my mind how there could be so much consistency between the market cycles. Anyway, my reason for publishing this topic again is because my analysis was basic. So I asked GROK to analyze the last three market cycles including the current cycle and compile all the results into a report.
Can you analyze the last two Bitcoin 4-year cycles, (Jan. 14, 2015, to Dec. 15, 2018) and (Dec. 15, 2018, to Nov. 21, 2022), and compare them against each other?
Then analyze the current market cycle which started on Nov. 21, 2022, and note any similarities with the previous two market cycles. Also, if possible, try to predict when this market cycle peak might occur. Please also include any analysis that you can do on Global liquidity including United States M1 and M2 money supply trends, U.S. money printing, and any relationship / correlation to U.S. interest rates.
Please analyze the following along with any other pertinent data and make a comparison between the two cycles:
• The duration from bear market low (beginning of the market cycle) to the halving.
• The duration from halving to the market cycle peak price.
• The duration from the market cycle peaks to the next bear market lows.
• The duration of the overall market cycle (bear market low to the next bear market low).
• Percentage gain from the bear market low to the market cycle peak.
• Percentage loss from the market cycle peak to the next bear market low.
• Please include the dates of the bear market lows, market cycle peaks, and halvings.
• If possible, list the price corrections from each market cycle that exceed 20%. Also I want you to add any other pertinent data that you find in your analysis.
Note: For this report the current price for Bitcoin on July 22, 2025 at 9:40 Eastern Standard time is $119,556.82
Below is a detailed analysis of the last two Bitcoin 4-year cycles (2015–2018 and 2018–2022), a comparison of their key metrics, an examination of the current cycle (starting November 21, 2022), and an exploration of global liquidity, U.S. M1 and M2 money supply trends, U.S. money printing, and their correlation with U.S. interest rates. I’ve included the requested metrics (durations, percentage gains/losses, key dates, and price corrections exceeding 20%) and additional pertinent data such as macroeconomic factors and on-chain metrics. Finally, I provide a speculative prediction for the current cycle’s peak based on historical patterns and current trends.
Analysis of Bitcoin 4-Year Cycles
Cycle 1: January 14, 2015 – December 15, 2018
Bear Market Low: January 14, 2015, $176.90
Halving Date: July 9, 2016 (block reward reduced from 25 to 12.5 BTC)
Market Cycle Peak: December 4, 2017, $19,666
Next Bear Market Low: December 15, 2018, $3,122
Durations
Bear Market Low to Halving: 542 days (January 14, 2015 – July 9, 2016)
Halving to Market Cycle Peak: 513 days (July 9, 2016 – December 4, 2017)
Market Cycle Peak to Next Bear Market Low: 376 days (December 4, 2017 – December 15, 2018)
Overall Market Cycle (Bear Market Low to Next Bear Market Low): 1,431 days (~3.92 years)
Price Movements
Percentage Gain (Bear Market Low to Peak): ($19,666 - $176.90) / $176.90 = 11,018.09%
Percentage Loss (Peak to Next Bear Market Low): ($19,666 - $3,122) / $19,666 = -84.12%
Price Corrections Exceeding 20%
May 2017: ~30% correction (from ~$2,700 to ~$1,900)
June–July 2017: ~40% correction (from ~$3,000 to ~$1,800)
September 2017: ~35% correction (from ~$5,000 to ~$3,250)
December 2017 – February 2018: ~65% correction (from $19,666 to ~$6,900)
April–May 2018: ~35% correction (from ~$9,700 to ~$6,300)
November–December 2018: ~50% correction (from ~$6,300 to $3,122)
Key Observations
The 2015–2018 cycle was characterized by a prolonged accumulation phase post-2015 low, with the halving in July 2016 acting as a catalyst for a bull run.
The market peak occurred ~17 months after the halving, driven by retail investor enthusiasm and the ICO bubble.
The bear market was severe, with an 84.12% drawdown, exacerbated by the ICO bubble collapse and regulatory concerns.
Cycle 2: December 15, 2018 – November 21, 2022
Bear Market Low: December 15, 2018, $3,122
Halving Date: May 11, 2020 (block reward reduced from 12.5 to 6.25 BTC)
Market Cycle Peak: November 8, 2021, $67,589
Next Bear Market Low: November 21, 2022, $15,476
Durations
Bear Market Low to Halving: 513 days (December 15, 2018 – May 11, 2020)
Halving to Market Cycle Peak: 546 days (May 11, 2020 – November 8, 2021)
Market Cycle Peak to Next Bear Market Low: 378 days (November 8, 2021 – November 21, 2022)
Overall Market Cycle (Bear Market Low to Next Bear Market Low): 1,437 days (~3.94 years)
Price Movements
Percentage Gain (Bear Market Low to Peak): ($67,589 - $3,122) / $3,122 = 2,064.22%
Percentage Loss (Peak to Next Bear Market Low): ($67,589 - $15,476) / $67,589 = -77.10%
Price Corrections Exceeding 20%
March 2020 (COVID-19 Crash): ~50% correction (from ~$10,000 to ~$5,000)
May–July 2021: ~50% correction (from ~$64,000 to ~$29,000)
November 2021 – January 2022: ~40% correction (from $67,589 to ~$40,000)
May–June 2022 (Terra/Luna Collapse): ~45% correction (from ~$40,000 to ~$18,000)
November 2022: ~25% correction (from ~$20,000 to $15,476)
Key Observations
The 2018–2022 cycle saw a shorter accumulation phase before the halving, partly due to the COVID-19-induced liquidity injection in 2020.
The bull run post-halving was fueled by institutional adoption (e.g., Tesla, MicroStrategy) and retail FOMO, amplified by global stimulus.
The bear market was less severe than the previous cycle (77.10% vs. 84.12%), but events like the Terra/Luna collapse and FTX bankruptcy triggered significant corrections.
Key Similarities
Cycle Duration: Both cycles lasted approximately 4 years (~1,431–1,437 days), reinforcing the 4-year cycle tied to Bitcoin’s halving schedule.
Halving as Catalyst: In both cycles, the halving (2016 and 2020) marked the start of significant bullish momentum, with peaks occurring 513–546 days post-halving.
Bear Market Drawdowns: Both cycles experienced severe drawdowns (84.12% and 77.10%), though the 2018–2022 cycle was less extreme, possibly due to increased market maturity.
Multiple Corrections: Both cycles saw 5–6 corrections exceeding 20%, reflecting Bitcoin’s high volatility during bull and bear phases.
Key Differences
Percentage Gains: The 2015–2018 cycle had a much higher percentage gain (11,018.09% vs. 2,064.22%), likely due to Bitcoin’s lower starting price and the speculative frenzy of the ICO bubble.
External Influences: The 2018–2022 cycle was heavily influenced by macroeconomic events (COVID-19 stimulus, institutional adoption), while the 2015–2018 cycle was more driven by retail speculation and the ICO boom.
Correction Triggers: The 2015–2018 bear market was driven by regulatory fears and the ICO bubble collapse, while the 2018–2022 bear market was exacerbated by crypto-specific events (Terra/Luna, FTX).
Current Cycle: November 21, 2022 – Present (July 23, 2025)
Bear Market Low: November 21, 2022, $15,476
Halving Date: April 19, 2024 (block reward reduced from 6.25 to 3.125 BTC)
Current Price (July 22, 2025): $119,556.82
Market Cycle Peak: January 2025, ~$112,000 (based on X post sentiment, not definitive)
Durations (As of July 23, 2025)
Bear Market Low to Halving: 514 days (November 21, 2022 – April 19, 2024)
Halving to Current Date: 460 days (April 19, 2024 – July 23, 2025)
Overall Duration to Date: 974 days (November 21, 2022 – July 23, 2025)
Peak to Current Date: ~190 days (January 2025 – July 23, 2025, assuming peak at ~$112,000)
Price Movements (As of July 23, 2025)
Percentage Gain (Bear Market Low to Current Price): ($119,556.82 - $15,476) / $15,476 = 672.58%
Percentage Gain (Bear Market Low to Assumed Peak): ($112,000 - $15,476) / $15,476 = 623.83% (based on ~$112,000 ATH in January 2025)
Percentage Change (Assumed Peak to Current Price): ($119,556.82 - $112,000) / $112,000 = +6.75% (indicating no bear market low yet)
Price Corrections Exceeding 20% (November 2022 – July 2025)
June–August 2023: ~25% correction (from ~$31,000 to ~$23,000)
April–July 2024: ~30% correction (from ~$73,000 to ~$50,000, post-halving dip)
February–April 2025: ~20% correction (from ~$112,000 to ~$90,000, based on X sentiment)
Similarities with Previous Cycles
Duration to Halving: The 514-day period from the bear market low to the halving aligns closely with the 513–542 days in previous cycles.
Post-Halving Bullish Momentum: Like the 2016 and 2020 halvings, the April 2024 halving preceded a significant price increase, with Bitcoin reaching ~$112,000 by January 2025 (a ~623% gain from the low).
Multiple Corrections: The current cycle has seen at least 3 corrections exceeding 20%, consistent with the 5–6 corrections in prior cycles.
Liquidity Correlation: The current cycle’s bull run aligns with global liquidity expansion (e.g., M2 growth from $102T to $107T by February 2025), similar to the 2016–2017 and 2020–2021 bull markets.
Differences from Previous Cycles
Lower Percentage Gain: The current cycle’s gain (623.83% to assumed peak) is lower than the 2015–2018 cycle (11,018.09%) and 2018–2022 cycle (2,064.22%), reflecting Bitcoin’s maturing market and higher starting price.
Influence of ETFs: The launch of U.S. spot Bitcoin ETFs in January 2024 bolstered demand, a new factor not present in prior cycles.
Supply Shocks: The release of long-dormant coins (e.g., Mt. Gox repayments, government seizures) in 2024 caused temporary oversold conditions, unique to this cycle.
Global Liquidity and Macroeconomic Analysis
U.S. M1 and M2 Money Supply Trends
M1 Money Supply (cash, checking deposits): M1 surged during the COVID-19 stimulus in 2020, peaking at ~$20T in 2021, but has since stabilized at ~$18T by mid-2025 due to tighter monetary policy.
M2 Money Supply (M1 + savings deposits, money market accounts): Global M2 grew from $102T to $107T between January and February 2025 (3.8% increase), signaling renewed liquidity expansion. U.S. M2 specifically has shown slower growth since 2022, correlating with Bitcoin’s bear market bottom, but recent upticks align with Bitcoin’s rally to $119,556.82.
Historical Correlation: Bitcoin’s bull markets (2016–2017, 2020–2021) coincided with rapid M2 growth, while bear markets (2018, 2022) aligned with M2 contractions. The current cycle’s rally since 2023 mirrors rising M2 year-on-year growth.
U.S. Money Printing and Interest Rates
Money Printing: Quantitative easing (QE) during 2020–2021 (e.g., $4T in U.S. stimulus) fueled Bitcoin’s 2020–2021 bull run. Since 2022, the Federal Reserve shifted to quantitative tightening (QT), reducing liquidity, but recent expectations of rate cuts in 2025 have spurred M2 growth and Bitcoin’s price recovery.
U.S. Interest Rates: The Federal Reserve raised rates from 0% to ~5.5% between 2022–2023 to combat inflation, correlating with Bitcoin’s 2022 bear market. Speculation of rate cuts in mid-2025 (potentially to 3–4%) has boosted risk assets, including Bitcoin, as lower rates increase liquidity and investor risk appetite.
Correlation: Bitcoin has a ~0.94 long-term correlation with global liquidity (M2), with a 56–60 day lag between liquidity increases and price rises. Higher interest rates suppress Bitcoin’s price by reducing liquidity, while anticipated rate cuts in 2025 are driving bullish sentiment.
Stablecoin Liquidity
Stablecoin supply (e.g., USDT, USDC) is a crypto-native liquidity metric with a stronger short-term correlation to Bitcoin’s price than M2. Positive 28-day changes in stablecoin supply often signal accumulation phases, while sharp declines align with local tops. Current stablecoin supply growth supports Bitcoin’s upward trajectory in 2025.
Prediction for Current Cycle Peak
Historical patterns suggest Bitcoin peaks ~1,060–1,070 days from the bear market low (35 months), or ~12–18 months post-halving. Based on:
Cycle Low: November 21, 2022
Historical Peak Timing: 1,060–1,070 days (October–November 2025)
Post-Halving Timing: 12–18 months from April 19, 2024 (April–October 2025)
Current Trajectory: Bitcoin’s price at $119,556.82 (974 days from low) and MVRV Z-Score <1 suggest further upside potential.
Speculative Peak Prediction: Bitcoin may peak between late Q3 and early Q4 2025 (September–November 2025), potentially reaching $150,000–$320,000, based on historical MVRV ratios (peak MVRV ~8) and liquidity trends. Risks include global recession, equity market corrections, or regulatory shocks.
Additional Pertinent Data
MVRV Z-Score: Currently <1, indicating undervaluation and room for growth compared to historical peaks (MVRV >3).
Net Unrealized Profit and Loss (NUPL): The current cycle is in the “Belief” stage, transitioning toward “Euphoria,” consistent with prior bull runs.
Exchange Reserves: Declining Bitcoin reserves on exchanges (e.g., CryptoQuant data) indicate HODLing, reducing available supply and supporting price increases.
Google Search Trends: Interest in “Bitcoin” and “crypto” peaked in prior cycles (2017, 2021) during bull runs. Current search volume is rising but below 2021 levels, suggesting the cycle may not yet be at its peak.
Correlation with Risk Assets: Bitcoin’s correlation with the S&P 500 and Nasdaq reached 0.73–0.76 in April 2025, reflecting its sensitivity to broader market sentiment.
Conclusion
The 2015–2018 and 2018–2022 cycles share structural similarities (4-year duration, halving-driven bull runs, severe bear markets), but differ in scale and drivers. The current cycle (2022–present) mirrors past cycles in timing and liquidity correlation, with unique factors like ETFs and supply shocks. Global liquidity, particularly M2 and stablecoin supply, remains a key driver, amplified by anticipated U.S. rate cuts in 2025. Bitcoin’s current price ($119,556.82) and metrics suggest a peak in September–November 2025, potentially at $150,000–$320,000, though external risks could alter this trajectory. Investors should monitor MVRV, NUPL, and liquidity trends for intra-cycle positioning.
As you can see this is a much more comprehensive analysis of the Bitcoin 4-year market cycle than my previous analysis. That being said the end result, at least when it comes to elapsed time similarities was about the same. It's obvious that for whatever reason the past two market cycles are amazingly similar in elapsed time. Moving forward it will be very interesting to watch as the rest of this current market cycle plays out. The major questions yet to be answered include. When will the market cycle peak occur? What will be the peak price? What will be the price of the next bear market low?
Looking at the price chart, especially when you view a line chart it is obvious that as Bitcoin ages as an asset, price volatility diminishes. Will this continue? Only time will tell. One thing that is undeniable is this has been an exciting and at times a frustrating market cycle. However, whether it is exciting or frustrating I am very thankful to be involved in it. I realize that this is a fairly long read so if you have made it this far, thank you! I really appreciate everyone who takes the time to read my ideas. Stay safe and get ready for a wild ride over the next five to six months.
Bitcoin - Trust the higher timeframe!⚔️Bitcoin ( CRYPTO:BTCUSD ) is still 100% bullish:
🔎Analysis summary:
For the past couple of months we have been seeing an overall consolidation on Bitcoin. But looking at the higher timeframe, Bitcoin remains in an underlying strong bullrun. Consolidations are always expected and no reason to freak out since everything is still bullish.
📝Levels to watch:
$100.000
🙏🏻#LONGTERMVISION
Philip - Swing Trader

BTCUSD Analysis is Ready BTC/USD 30-min chart shows a potential bounce from the support zone around 116,187.5, aiming for a bullish move toward the target at 121,640.6. Price may retrace before pushing upward.

BITCOIN UPDATE Bitcoin seems to be preparing to fix its lows so it’s time to target a trade to the up side because, it had dropped to a fair amount of lows
Accumulate BTC over 115K💎 BTC PLAN UPDATE (July 23rd)
NOTABLE NEWS ABOUT BTC
Bitcoin (BTC) and Ripple (XRP) are approaching their all-time highs, while Ethereum (ETH) continues to grow steadily toward the important $4,000 mark. These top three cryptocurrencies by market capitalization are showing signs of a new bullish momentum, supported by strong technical structures and increasing investor interest.
TECHNICAL ANALYSIS PERSPECTIVE
1. Main Trend
The overall trend remains bullish, with a clearly rising price channel (black diagonal line).
However, BTC is currently in a short-term correction phase, consolidating sideways after the recent strong surge.
2. Key Price Levels
🔵 Strong Support Zone: 116,000 – 117,000 USDT
This zone includes the 200-day moving average (MA200), horizontal support, and a previous bottom — making it a decisive area for the short-term trend.
If this zone breaks, BTC could fall to a deeper support area around 111,000 USDT.
🔴 Resistance Zone: 122,000 – 123,000 USDT
This is a previous peak and a recently “false breakout” area — a strong psychological resistance.
If broken convincingly, BTC could surge to the 130,000 USDT zone (Fibonacci extension 1.618).
3. Possible Scenarios
✅ Bullish Scenario:
Price retests the 116,000 – 117,000 support zone and then bounces.
If it breaks through the 122K resistance, the next target is 130,000 USDT.
❌ Bearish Scenario:
If price breaks below MA200 and the 116K support zone → it could drop to the deeper zone around 111,000 USDT.
4. Technical Signals
There is a triangle accumulation pattern (with flat tops and bottoms).
The “false breakout” at the resistance zone shows that buyers are not yet strong enough and a retest of support is needed.
Follow the channel for the latest and continuous updates on XAUUSD, CURRENCIES, and BTC.

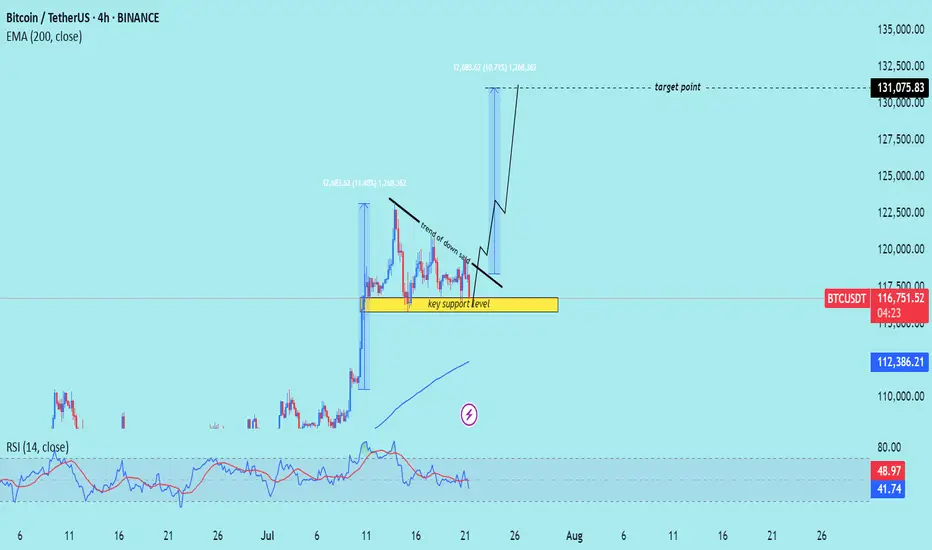
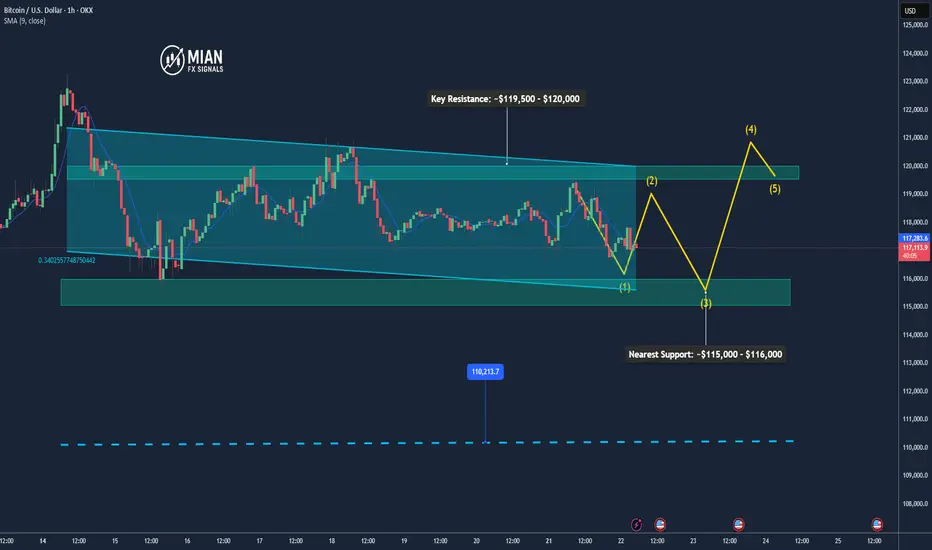
BTC/USD) Bullish trend analysis Read The captionSMC Trading point update
Technical analysis of Bitcoin (BTC/USDT) on the 4-hour timeframe, indicating a potential upward continuation after a period of consolidation above a key support level.
---
Analysis Summary
Pair: BTC/USDT
Timeframe: 4H
Current Price: 116,810.90
Bias: Bullish breakout continuation
---
Key Technical Insights
1. Key Support Zone:
The yellow box marks a strong support level, where price has bounced multiple times.
Acts as a launchpad for the next move higher.
2. Descending Trendline:
A trend of lower highs suggests short-term selling pressure.
Break above this trendline would signal a bullish breakout.
3. Projected Move:
If the breakout occurs, the projected target is around 131,075.83, representing a ~12% gain.
Similar move structure as the previous breakout earlier this month.
4. EMA 200 (Supportive):
Price remains above the 200 EMA at 112,386.80, affirming bullish trend bias.
5. RSI (14):
RSI hovering around 42–49, slightly oversold area, suggesting upside potential remains.
---
Target Point
Target: 131,075.83 USDT
Stop-Loss Suggestion: Below key support zone (~114,000)
---
Trade Idea
Direction Entry Stop-Loss Target
Buy Break above 118,000 Below 114,000 131,000–132,000
Mr SMC Trading point
---
Summary
Bitcoin is consolidating above a strong support zone and under a descending trendline. A confirmed breakout from this pattern could lead to a bullish rally toward 131,000+.
-
Please support boost 🚀 this analysis)
$RAYUSDT Breakout: 146% PotentialNASDAQ:RAY just broke out of a major downtrend and flipped key resistance into support around $3.208 –$3.352.
If it holds, a move toward $8+ is on the cards, nearly
146% upside.
Momentum appears strong; watch for a clean retest and potential continuation.
DYOR, NFA

$CUSDT Breakout Targeting $0.47BITGET:CUSDT just broke out of and is now retesting the $0.34–$0.35 resistance zone.
If this level holds, we could see a strong move toward $0.47, nearly a 47% upside.
Momentum looks solid, but confirmation will come with a clean bounce.
DYOR, NFA

A quick update on BYCThe correction turned a littl complex but I still seing the same structure
Levels in the chart
GG
"BTC/USD Breakout Strategy: Identifying Bullish Momentum BTC/USD Technical Analysis – July 22, 2025
📈 Market Structure Overview:
The chart illustrates a recent Break of Structure (BOS) both to the upside and downside, indicating volatility and a shift in market sentiment. The price action formed a descending channel, followed by a breakout with strong bullish candles, suggesting a momentum reversal.
🧱 Support Zone (Demand Area):
Key Level: $116,400 – $116,900
This zone has acted as a strong demand level, with clear evidence of buying pressure pushing BTC higher after testing this area. The volume profile (VRVP) supports this, showing heightened trading activity at this price.
🔄 Bullish Breakout Confirmation:
A bullish breakout from the descending channel occurred just above the support zone, aligning with the label "Bullish Momentum".
The breakout candle has closed above minor resistance, which increases the probability of a trend reversal.
📍 Price Target:
The projection points toward $120,000, aligning with previous resistance and psychological round-number resistance.
This target is highlighted by an expected bullish leg after a possible retest of the breakout zone around $117,500 – $117,800.
🧭 Key Levels to Watch:
Support: $116,400 – $116,900
Retest Zone (Buy Opportunity): $117,500 – $117,800
Immediate Resistance: $118,400
Major Resistance / Target: $120,000
📊 Summary:
BTC/USD has shown a bullish reversal signal from a well-respected support zone after a descending correction phase. The current price structure, volume buildup, and breakout momentum suggest a high probability of continued upside movement toward the $120,000 mark. A successful retest of the breakout zone would provide a strategic entry for long positions with tight risk management.

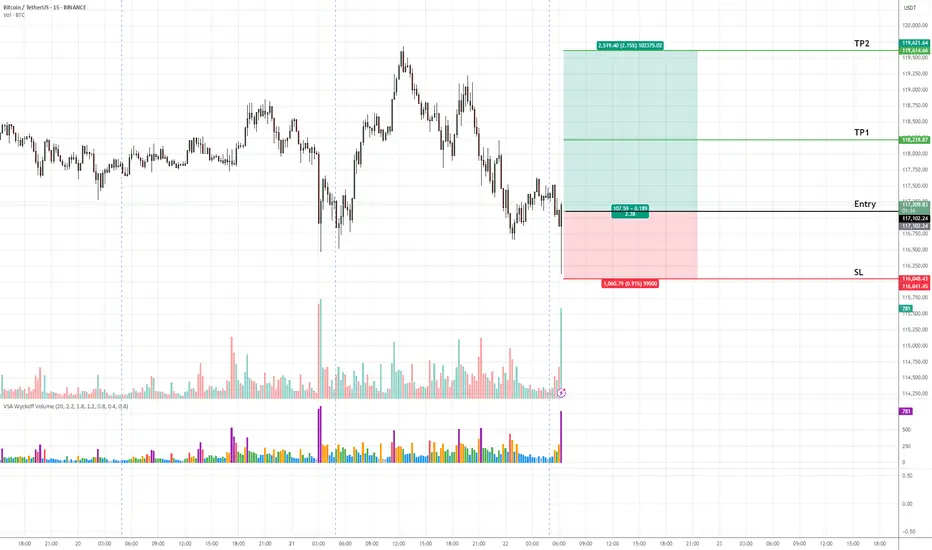
BTCUSD (Bitcoin) Buy Setup – VSA & Market Structure Analysis✅ Entry: As marked on chart
🎯 Take Profit 1 (TP1): Highlighted zone on chart
🎯 Take Profit 2 (TP2): Highlighted zone on chart
🛑 Stop Loss (SL): Defined below recent demand zone
📊 Technical Insight (VSA & Market Structure):
The recent decline into the support zone occurred on diminishing volume, indicating a lack of selling pressure.
A climactic volume spike (stopping volume) followed by a wide spread bullish candle suggests strong professional buying activity.
Subsequent bars show narrow range candles with low volume, characteristic of an absorption phase, hinting at smart money accumulation.
Price is now attempting to break above the previous minor resistance, which would confirm demand overcoming supply.
The broader market structure aligns with this setup: Bitcoin is in a higher timeframe accumulation range, and this move could initiate a markup phase as per Wyckoff/VSA principles.
📍 As long as price holds above the stop loss zone, we expect a bullish leg towards TP1 and TP2, in line with the emerging demand dominance.
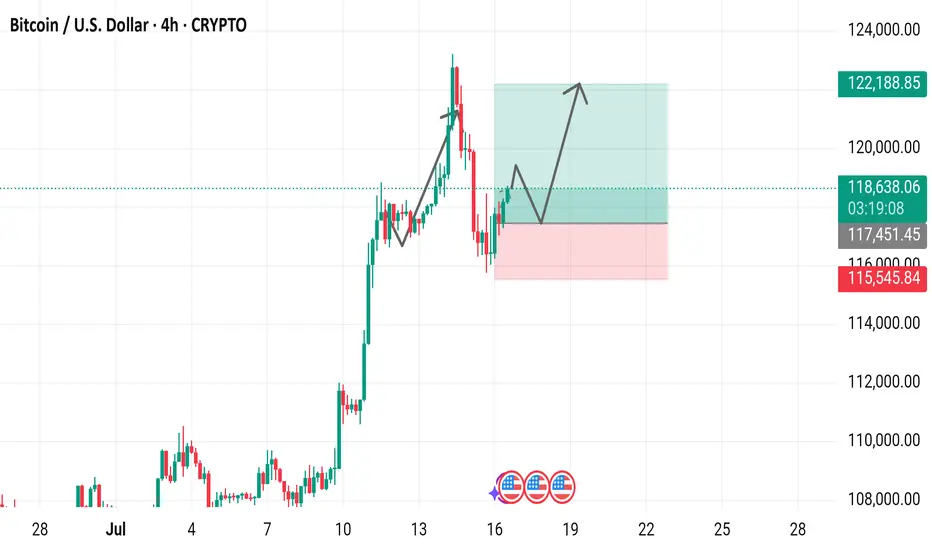
Bitcoin / U.S. Dollar 4-Hour Chart (July 2025)4-hour price movement of Bitcoin (BTC) against the U.S. Dollar (USD). The price has risen from 118,714.64 to 118,714.64 (+937.9 or +0.80%) over the period. Key levels include a support zone around 115,451.45 to 117,451.45 and a resistance zone near 120,000.00 to 122,188.85,
Bitcoin at the Threshold of the Fibonacci Gate - Silent Strain.⊢
⟁ BTC/USD - BINANCE - (CHART: 1W) - (July 22, 2025).
◇ Analysis Price: $119.209,03.
⊣
⨀ I. Temporal Axis - Strategic Interval - (1W):
▦ EMA9 - ($111.083,72):
∴ Price remains well above the EMA9, with consistent bullish spacing;
∴ The weekly candle closes with strength and full-body integrity above it;
∴ EMA9 slope continues upward, supporting ongoing momentum.
✴️ Conclusion: Short-term structure remains decisively bullish, with trend-following support intact.
⊣
▦ EMA21 - ($103.417,42):
∴ EMA21 is sharply rising and holds significant historical support;
∴ Price remains distanced, but no vertical stretch detected;
∴ Not touched since early 2024 - the bullish cycle is intact.
✴️ Conclusion: Mid-cycle momentum remains strong. No structural weakness under current trajectory.
⊣
▦ WMA200 - ($62.496,26):
∴ Remains deep below current price action - untouched since breakout phase in 2023;
∴ Its angle is now slowly tilting upward - reflecting macro regime change;
∴ Long-term holders remain in command; no gravitational pull is active.
✴️ Conclusion: WMA200 is no longer relevant for tactical reaction, but serves as a structural floor of the cycle.
⊣
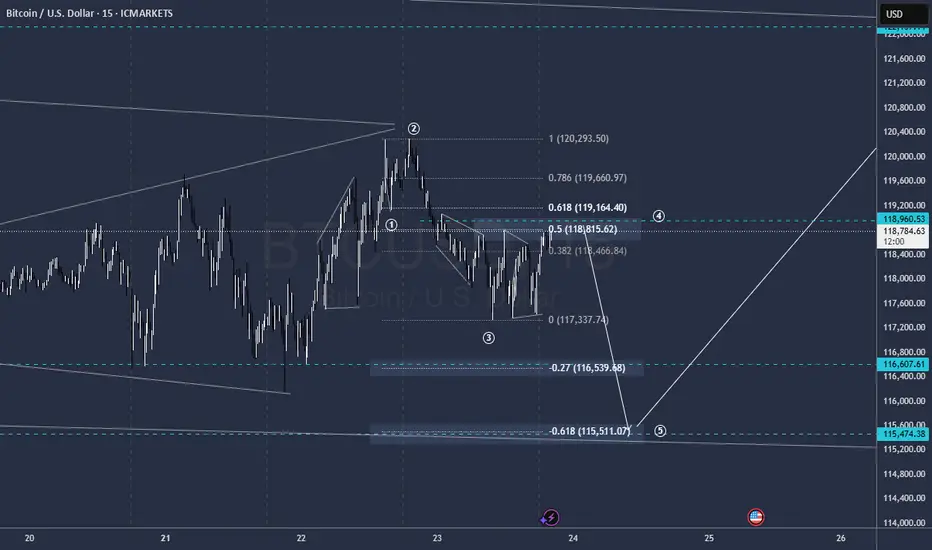
▦ Fibonacci Retracement - (Top: $122.056,95 / Bottom: $27.143,79):
✴️ Top: $122.056,95 - (07/14/2025) = 1 Fibo;
✴️ Bottom: $27.143,79 - (10/16/2023) = 0 Fibo.
∴ Price is now within 2.33% of the Fibonacci 1.0 extremity;
∴ Entire move from $27k to $122k retraced cleanly with structural respect to 0.382 ($63.400;62) and 0.618 ($85.800,12);
∴ Current pressure nears full extension, requiring caution;
✴️ Conclusion: Full retracement achieved. Continuation must now be fueled by external influx or will face rejection at golden gate.
⊣
▦ RSI (21) + EMA9 - (RSI: 66.65 / EMA9: 63.73):
∴ RSI remains below 70 - showing momentum without exuberance;
∴ RSI crossed above EMA9 with positive slope;
∴ No divergence present; momentum confirmation continues.
✴️ Conclusion: Silent bullish continuity. No signal of exhaustion.
🜏 ORACVLO ARCANE: (RSI = 66 - No Fibonacci/Guematria convergence).
⊣
▦ MACD (9,21) - (MACD: 7,666.30 / Signal: 5,976.56 / Histogram: +1,689.74):
∴ MACD lines widening - strong expansion phase;
∴ Histogram rising above prior week;
∴ Still in mid-cycle range - not overextended.
✴️ Conclusion: Momentum engine active. No current loss of acceleration.
🜏 ORACVLO ARCANE: (Histogram = 1,689.74 - No convergence).
⊣
▦ OBV + EMA9 - (OBV: 86.27K):
∴ OBV rising cleanly with price;
∴ No divergence detected on weekly timeframe;
∴ EMA9 supportive, confirming accumulation bias.
✴️ Conclusion: Volume structure confirms legitimacy of bullish move.
⊣
▦ Stochastic RSI - (3,3,21,9) - (K: 94.30 / D: 84.53):
∴ Both lines in extreme overbought zone;
∴ No bearish cross yet - but a turn may initiate in next 1-2 candles;
∴ Historical turning points often occur from this elevation.
✴️ Conclusion: Momentum peaking. Vigilance required for reversal trigger in next cycle.
⊣
🜎 Strategic Insight – Technical Oracle:
∴ Price is pressing against the final Fibonacci gate of $122K, with momentum indicators still aligned;
∴ However, overbought pressure is building, particularly on the Stoch RSI.
∴ Breakout will require force; otherwise, a pullback from the threshold is probable.
⊣
∫ II. On-Chain Intelligence – (Source: CryptoQuant):
▦ Exchange Netflow Total - (All Exchanges) - (+920 BTC):
∴ Influx into exchanges suggests potential distribution is being prepared.
⊣
▦ Funding Rates - (All Exchanges) - (+0.008):
∴ Mildly positive; no leverage overheating detected.
⊣
▦ Taker Buy Sell Ratio - (All Exchanges) - (0.959):
∴ Slight taker sell dominance - friction at high prices.
⊣
▦ Spent Output Profit Ratio - (SOPR) - (1.017):
∴ Profitable exits ongoing. Healthy, but could tilt if profit-taking accelerates.
⊣
▦ Realized Cap + (EMA9) - (Rising):
∴ Network is revaluing BTC upward - structurally healthy.
⊣
▦ MVRV Z-Score + (EMA9) - (2.32):
∴ Elevated. Historically a zone where caution is warranted.
⊣
▦ Miner Reserve - (All Miners) - (1.809M BTC declining):
∴ Long-term miner outflows continue - no sudden spike detected.
⊣
🜎 Strategic Insight - On-Chain Oracle:
∴ On-chain data supports the current trend, but with visible friction. Exchange inflow and profit-taking are warning signs that price is now dependent on sustained demand;
∴ This is a zone of silent strain: structurally sound, but tactically stretched. While the broader framework supports continuation, there is no buffer left for error;
∴ Weakness will be exploited if new inflows fail to materialize.
⊣
𓂀 Stoic-Structural Interpretation:
∴ Structurally Bullish - Tactically Suspended;
∴ Tactical Range Caution: ($114.000 / $122.056).
⊣
▦ Codicillus Silentii - Strategic Note:
∴ The CME gap and the proximity to Fibonacci 1.0 have formed a psychological and technical ceiling;
∴ If unbroken this week, the next cycle may revert to (0.786) as reversion.
⊣
▦ Momentum-wise:
∴ RSI remains in the bullish zone (66.65) without entering overbought - a sign of discipline in the ascent;
∴ MACD shows expansion with a growing histogram - no curvature loss;
∴ Stochastic RSI is in extreme overbought (K = 94.30), signaling elevated tension.
✴️ Conclusion: Momentum is intact but strained. A breakout is possible, but failure to continue will invite a flush.
⊢
✴️ Final Codex Interpretation:
∴ Bitcoin stands at the edge of the Fibonacci Gate, within breath of the 1.0 threshold ($122,056); ∴ While structure, momentum, and on-chain flows permit a push higher, the presence of inflows to exchanges, elevated MVRV, and extreme oscillator positioning suggest that the threshold is sacred - and only silence or strength may break it;
∴ Rejection here would not be collapse, but strategic regression to gather force beneath the gate.
⊢
⧉
· Cryptorvm Dominvs · MAGISTER ARCANVM · Vox Primordialis ·
⚜️ ⌬ - Silence precedes the next force. Structure is sacred - ⌬ ⚜️
⧉
⊢

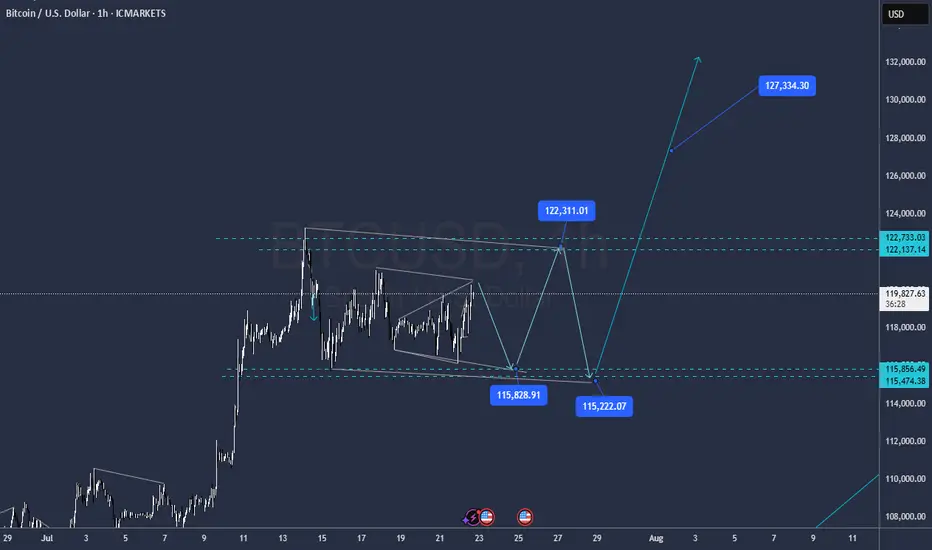
$BTC Breakout Coming?CRYPTOCAP:BTC is coiling up inside a symmetrical triangle on the 2H chart.
A breakout looks close if it clears resistance; we could see a 7.5% move toward the $127K–$128K zone.
Watch for volume confirmation.
DYOR, NFA

Bitcoin May Pull Back Slightly Before Resuming Uptrend📊 Market Overview
• Bitcoin is currently trading around $116,934, slightly down after hitting an intraday high of $119,524.
• The earlier rally was supported by inflows into Bitcoin ETFs, accumulation by major holders like Trump Media and MicroStrategy, and a pro-crypto regulatory stance in the U.S. (e.g., Genius Act, CLARITY Act).
• However, a surge in whale transfers to exchanges and declining BTC dominance suggests profit-taking and potential short-term volatility.
📉 Technical Analysis
• Key Resistance: ~$119,500 – $120,000 (intraday high and recent ATH)
• Nearest Support: ~$115,000 – $116,000, then $110,000
• EMA 09/20: Price is hovering around EMA 9/20 on H1–H4 timeframes, indicating a short-term uptrend but needing a pause or correction.
• Momentum / Volume: RSI is near overbought territory; falling volume hints at consolidation or a mild pullback. The overall trend remains bullish but slightly unstable.
📌 Opinion
Bitcoin is likely to pull back slightly in the short term toward the $115,000 – $116,000 zone due to profit-taking pressure, before potentially resuming the uptrend if it can break and hold above $119,500 – $120,000 with strong volume.
💡 Trade Setup
SELL BTC/USD at: $118,500 – $119,000
🎯 TP: $116,500
❌ SL: $120,000
BUY BTC/USD at: $115,000 – $116,000
🎯 TP: $118,500 – $119,500
❌ SL: $114,000
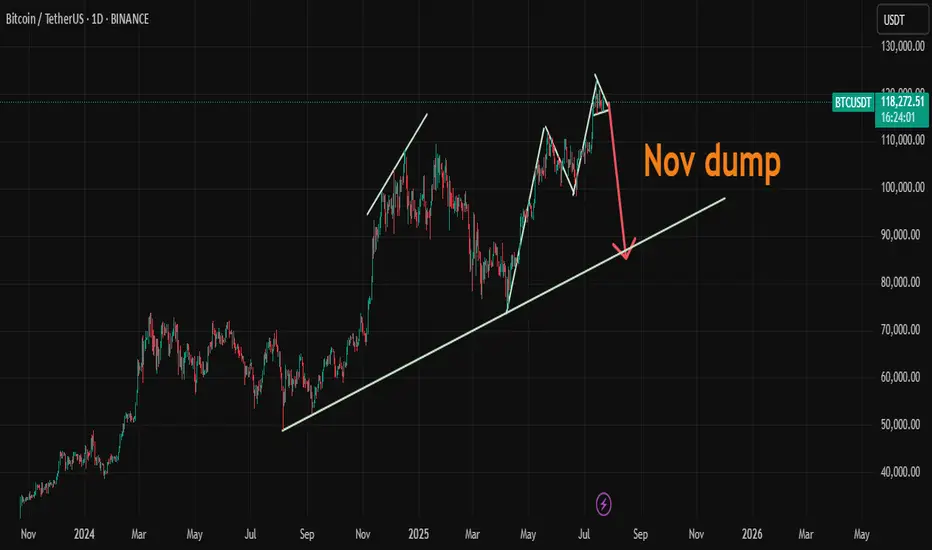
BTC/USDTHello friends, I hope you are well. We should probably expect a slight increase in Bitcoin after the big drop in the financial market, which will most likely start in November. What is your opinion?
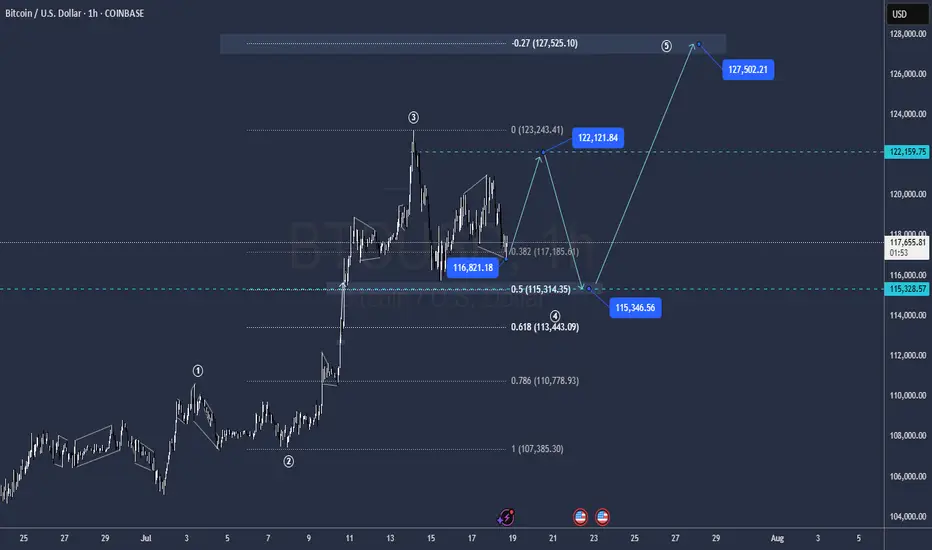
Bitcoin Weekend ForecastIts in the middel of wave 4 correction, impulses are tradeable
Levels Highlighted in the chart
BTCUSD BULLYING Bitcoin is still respecting price and is buying can expect some nice moves (New Highs)