Grass / Usdt GATEIO:GRASSUSDT
📊 **Chart Overview – GRASSUSDT (4H):**
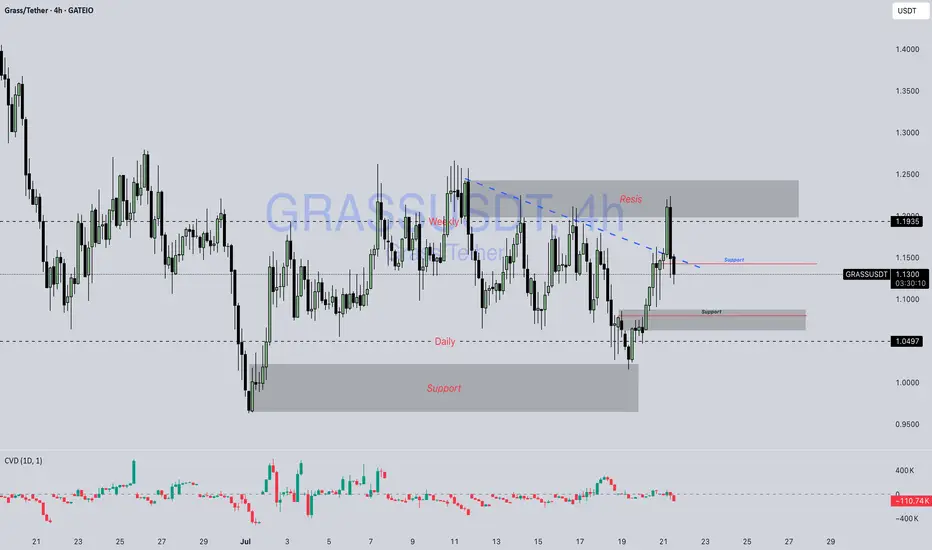
* 💰 **Current Price:** \$1.1362
* 🔻 **Previous Trend:** Downtrend has been challenged; price broke above the **descending trendline (blue dashed)**.
* 🟦 **Key Support Zones:**
* \$1.10 (recent demand area retest)
* \$1.05 (major support below, seen from earlier bounce zone)
* 🟥 **Key Resistance Zone:**
* \$1.19 – \$1.25 (major supply area where price got rejected again)
---
### 🔍 **Technical Breakdown:**
1. **Break and Retest Attempt:**
* Price **broke the descending trendline** and tapped into the \$1.19 resistance.
* Currently pulling back — possibly a **retest of the broken trendline** and the previous support near \$1.10–\$1.13.
2. **Supply Zone Rejection:**
* Strong rejection from **\$1.19–\$1.25**, which aligns with the upper supply zone.
* Sellers are actively defending this area.
3. **Bullish Case:**
* If GRASS holds above **\$1.10**, it may gear up for another push toward **\$1.19–\$1.25**.
* A clean break and hold above \$1.1935 could open room toward \$1.30+.
4. **Bearish Case:**
* Failure to hold \$1.10 or a breakdown below \$1.05 could invalidate bullish bias and revisit the lower demand zone near **\$0.95–\$1.00**.
---
📌 **Market Summary:**
GRASS is at a **critical zone**, attempting to flip trendline resistance into support. The reaction from \$1.10–\$1.13 will be key to deciding whether it can revisit higher supply levels or turn back toward major support.
---
⚠️ **Disclaimer:**
*This is **not financial advice**. All information provided is for **educational and informational purposes only**. Always perform your own analysis and manage your risk properly before trading.*
---
Btcusdanalysis
BTC-----Sell around 118300, target 116000 areaTechnical analysis of BTC contract on July 21:
Today, the large-cycle daily level closed with a small negative line yesterday, the K-line pattern continued to fall, the price was below the moving average, and the fast and slow lines of the attached indicator showed signs of a dead cross, and the overall trend has been in a sluggish state recently. The trend in the big trend also showed obvious signs of falling, so we have to pay attention to the strength and continuation of the retracement next; the short-cycle hourly chart price fell under pressure in the early morning, and the current K-line pattern continued to fall, the price was below the moving average, and the attached indicator was dead cross, so the price fell to the previous low of 115700 area. So you can sell after the pullback during the day, and pay attention to the breakout and strength and weakness trend of the European session.
Today's BTC short-term contract trading strategy:
Sell in the 118300 area, stop loss in the 118600 area, and target the 116000 area;

$CUSDT Breakout: Eyes on 94% Upside.BITGET:CUSDT is showing signs of strength again.
After a healthy pullback, it held support and broke out of the falling wedge.
This move could kickstart the next leg up, with a potential target near $0.53882, almost 94% from here.
Keep it on your radar if momentum picks up.
DYOR, NFA

BTC/USDT LONG SET UP (BITCOIN)Entry Price 1: $118,000
Entry Price 2: $116,500
Stop Loss: $115,000
Take Profit 1: $121,000 (Close 25%)
Take Profit 2: $124,000 (Close 50%)
Take Profit 3: $127,000 (Close 75%)
Take Profit 4: $130,000 (Close 100%)

Urgent Bitcoin Prediction: Longs Beware!!! Bitcoin longs should be careful, as we are below an important resistance and the market looks bearish. Wait for the confirmations I’ve shown in the video before making any moves! Trade professionally with a proper strategy and well-defined entry tactics!

Bitcoin Trading Update: Consolidation, Patterns, and What's NextHey Fellow Traders! 👋
Bitcoin (BTC) has been on a wild ride after hitting its all-time high (ATH)! 📈 Since then, it’s been consolidating, generating liquidity, and setting the stage for the next big move. Meanwhile, altcoins are absolutely booming, stealing the spotlight! 💥 As we kick off the week, let’s dive into what’s happening with BTC and what to watch for.
📊 Technical Analysis Breakdown
Here’s what I’m seeing on the charts:
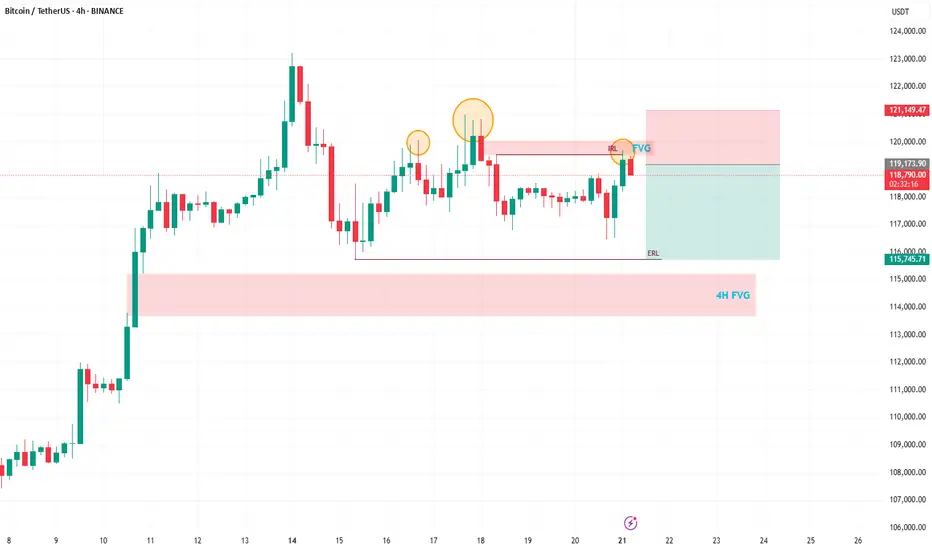
Head and Shoulders Pattern: A clear head and shoulders has formed on BTC, signaling a potential bearish move. 🐻
Daily Timeframe Order Blocks: These are in play, showing key levels of support and resistance.
Filled Fair Value Gap (FVG): A recent FVG on the daily chart has been filled, but there’s still a beautiful 4H FVG waiting to be tested below.
Liquidity Sweep: After the ATH, BTC needs to clear the liquidity from the past few days before it can push for new highs.
🔍 What’s Next for BTC?
I’m expecting a bearish reaction in the near term, with BTC targeting the sell-side liquidity around $115,800. This move should also fill the 4H FVG, setting the stage for a potential bounce and another shot at the ATH. 🚪 Keep an eye on these levels, as they’ll be critical for the next big move!
🔔 Stay in the Loop!
Let’s keep the conversation going! 💬 Follow for more updates, like if you found this helpful, and drop a comment with your thoughts or what you’re seeing in the markets. Are you trading BTC or riding the altcoin wave? Let’s hear it! 👇
Happy trading, and let’s make this week count! 💪
#Crypto #Bitcoin #Trading #TechnicalAnalysis
BTC 4H Structure Break – Long Bias with Conditions🚀 BTC (Bitcoin) has clearly broken bullish market structure on the 4-hour timeframe.
📈 My bias is to ride the momentum and look for a pullback to enter long.
✅ I follow a specific entry criteria — price must pull back into the imbalance, find support, and then form a bullish break of structure on a 15m chart to trigger an entry.
❌ If that setup doesn't play out, we simply abandon the idea.
⚠️ This is not financial advice.

BTCUSDT - UniverseMetta - Signal#BTCUSDT - UniverseMetta - Signal
H4 - Formation of a triangular formation in continuation of the trend, for a more confident entry you can wait for a retest and formation of the 3rd wave. Stop behind the minimum of the 1st wave.
Entry: 119294.13
TP: 123240.75 - 127823.91 - 130624.74 - 135239.73
Stop: 115824.93
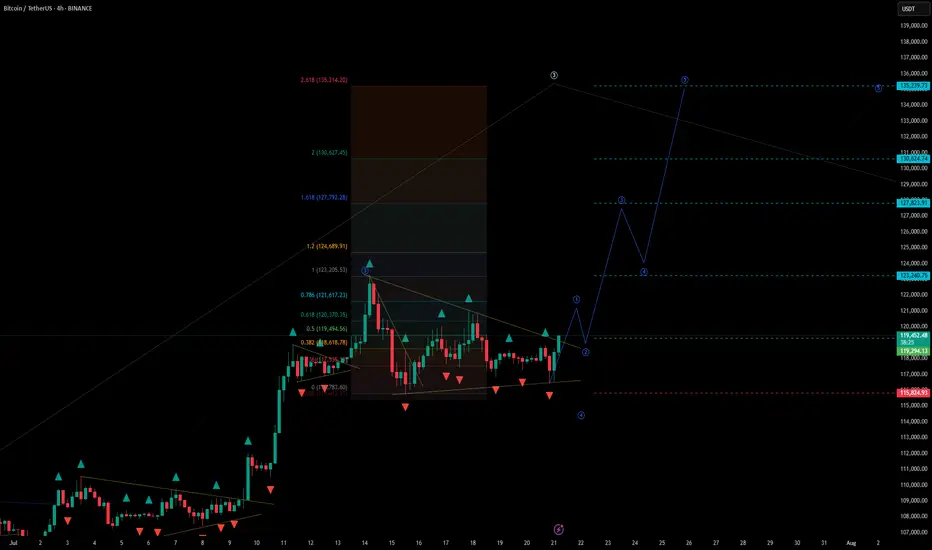
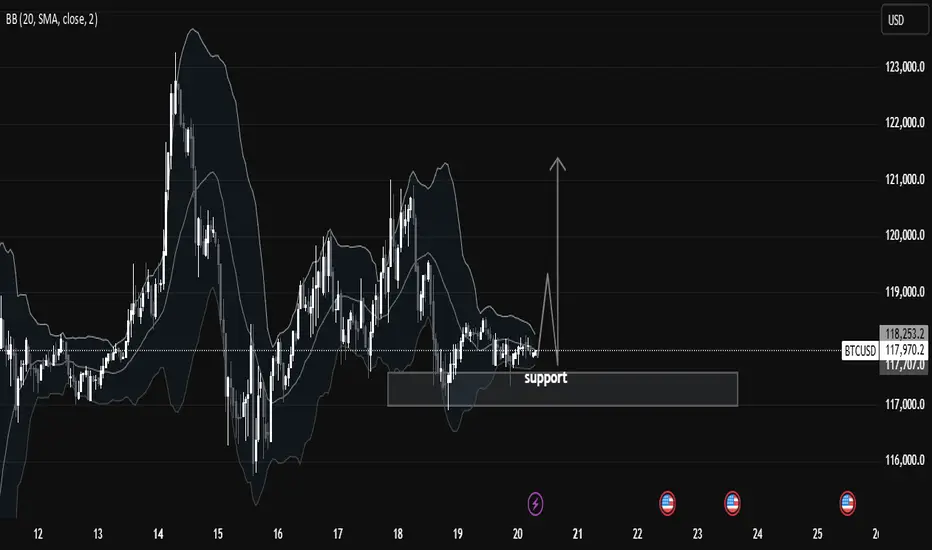
Chart Analysis: BTCUSD Consolidating at Key Support LevelIn this 1-hour BTCUSD chart, we observe that price is currently respecting a key support zone between $117,500 and $118,000, which has held strongly over the past few sessions. This region has acted as a strong demand zone, with visible buying pressure every time the price dips into it. The chart clearly shows multiple rejections from this zone, indicating that smart money participants are accumulating here.
We also see the Bollinger Bands (20 SMA) tightening around the price. This narrowing of the bands signifies low volatility and a potential expansion move. Such squeezes are often followed by impulsive breakouts or breakdowns, and traders should be alert for a decisive candle close above or below the range to confirm direction.
🧠 Market Structure & Technical Insights:
Support Holding: Price is consolidating above a major support level at $117,500–$118,000, which has been tested multiple times but not broken.
Accumulation Phase: The sideways structure after a previous impulsive move suggests that price is possibly in a re-accumulation phase before another leg up.
Liquidity Above Range: There's a visible liquidity pool above recent highs (~$118,600–$119,000), which could be targeted if bulls take control.
Volatility Squeeze: Bollinger Bands are compressing, showing signs of accumulation. Such patterns typically lead to a breakout move, especially if paired with volume.
Candle Behavior: Long wicks from below the support show aggressive buying interest, rejecting lower prices. This is a bullish signal.
🎯 Potential Scenarios:
1. Bullish Breakout:
If BTCUSD breaks and closes above the mini resistance near $118,600–$119,000, we may see a quick move toward $120,500 and $122,000.
A breakout backed by volume and momentum would confirm strength and trend continuation.
2. Bearish Breakdown:
A break below $117,500 with a strong bearish candle and increased volume would invalidate the bullish bias and may open the downside toward $116,000 and possibly $114,500.
This would indicate failure to hold support, transitioning into a distribution phase.
3. Range-Bound:
Until we get a clear break in either direction, price may continue to range between $117,500 and $118,600. Best approach is to remain patient and wait for breakout confirmation.
📚 Educational Note:
This is a textbook setup for many smart money traders—a compression near a strong support level with low volatility. Such patterns reflect market indecision, but also the potential energy build-up for a significant move. Traders should focus on risk management and confirmation instead of predicting direction blindly.
✅ Key Levels to Watch:
Support: $117,500
Resistance: $118,600 – $119,000
Breakout Target: $120,500 – $122,000
Breakdown Target: $116,000 – $114,500
BTC Bull & Bear historical Periods 3 Bull & Bear Markets
Bull markets took around 152 weeks...
then
V
v
v
v
v
Bear Markets took around 52-59 weeks..
then
v
v
v
v
v
v
v
Bull Market gain...
----------------------------------------------------------------------------------------------------------
After 2021 ATH
BTC recorded his current bottom after 52 weeks ( 15500 $).
BTC pumped after 59 weeks .
then what ?
Will the history will repeat itself again ??
if we will be alive inshallah ,we will see the next 152 weeks to ( October - November 2025 ) if this will be the New ATH of the next bull market or not :D
It is not a financial advice , PLZ DYOR

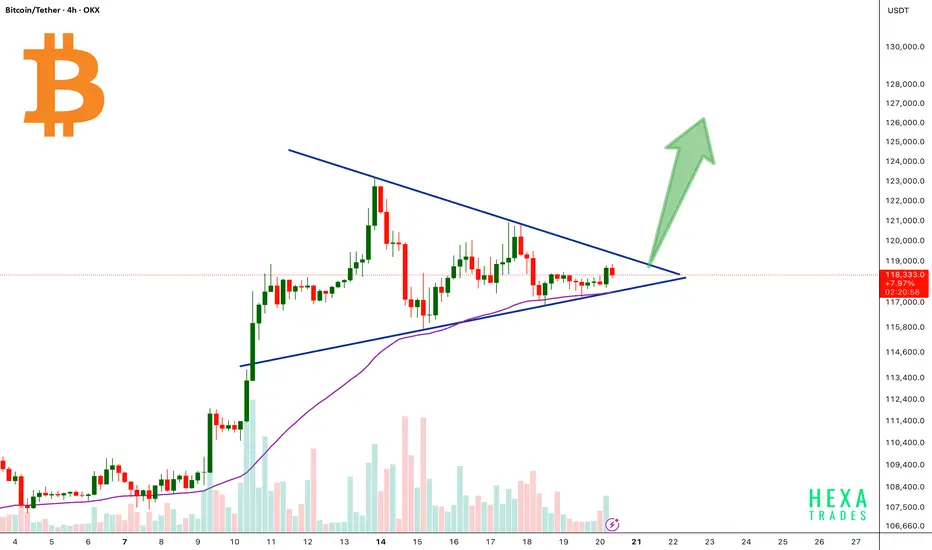
BTC Forming Bullish Triangle!Bitcoin is currently consolidating inside a symmetrical triangle pattern after a strong bullish rally. The price is approaching the apex of the triangle, signaling a potential breakout soon.
The 50 EMA is acting as dynamic support, perfectly aligned with the triangle’s lower trendline, reinforcing the bullish structure.
A confirmed breakout above the triangle resistance could trigger a strong upward move, with a potential target near the $125,000–$130,000 zone.
Cheers
Hexa
BINANCE:BTCUSDT CRYPTOCAP:BTC
BTC - Breakout, Fakeout… or Loading Zone?BTC is back inside the $116K–$117K demand zone — same level that launched the last breakout.
But this time? Consolidation. Stoch RSI stuck mid-range. Unclear momentum.
The Hull Suite Strategy nailed the previous breakout with clean stacked buys — but it’s showing hesitation now.
This is where strategy testing really matters. Not every system handles chop the same.
📊 We test these setups across multiple variations — especially in zones like this where most signals lose edge.
Support flip or breakdown brewing? Watching closely.
—
#BTCUSD #Bitcoin #HullSuite #StrategyTesting #BacktestBetter #QuantTradingPro #CryptoAnalysis #TradingView

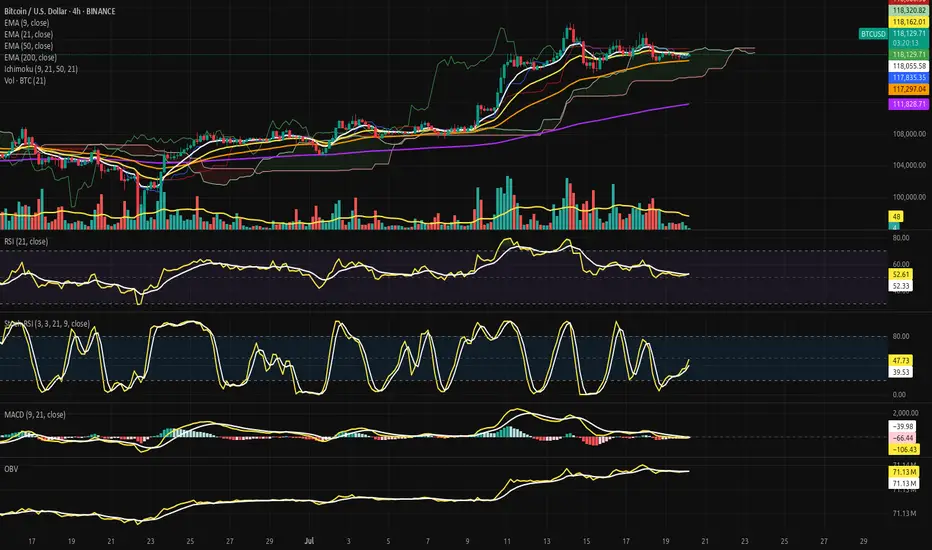
Bitcoin Suspended Beneath the Ichimoku Silence.⊢
⨀ BTC/USD - BINANCE - (CHART: 4H) - (July 20, 2025).
◇ Analysis Price: $117,919.29.
⊣
⨀ I. Temporal Axis - Strategic Interval - (4H):
▦ EMA9 - (Exponential Moving Average - 9 Close):
∴ Price is currently hovering just below the EMA9 at $118,035.43, showing weakening immediate momentum;
∴ EMA9 is now flat-to-downsloping, indicating short-term loss of control from intraday bulls;
∴ Recent candles have failed to reclaim closes above EMA9, reflecting micro-resistance and tactical fragility.
✴️ Conclusion: Logic sealed - EMA9 has lost command; tactical control has shifted to neutrality with bear undertones.
⊢
▦ EMA21 - (Exponential Moving Average - 21 Close):
∴ EMA21 currently sits at $118,164.50, acting as an overhead suppressor;
∴ The gap between EMA9 and EMA21 is compressing, signaling potential for either crossover or volatility breakout;
∴ Price action is now trapped between EMA9 and EMA50, with EMA21 forming the upper barrier of a tactical box.
✴️ Conclusion: Logic sealed - EMA21 serves as containment lid; rejection here confirms tactical indecision.
⊢
▦ EMA50 - (Exponential Moving Average - 50 Close):
∴ EMA50 rests at $117,262.74, offering foundational support within the current structure;
∴ Price has respected this level on multiple dips since mid-July, confirming its strategic function as mid-term equilibrium;
∴ The slope remains mildly upward - no sign of reversal, only compression beneath.
✴️ Conclusion: Logic sealed - EMA50 maintains its structural role as mid-range dynamic floor.
⊢
▦ EMA200 - (Exponential Moving Average - 200 Close):
∴ EMA200 remains well below at $111,765.30, untouched since early July;
∴ Its wide distance from price confirms that the broader structure remains in bullish territory;
∴ Its trajectory continues upward, anchoring the uptrend beneath all volatility.
✴️ Conclusion: Logic sealed - EMA200 secures the long-term structure; market remains elevated far above reversal threshold.
⊢
▦ Ichimoku Cloud - (9, 21, 50, 21):
∴ Price is currently within the Kumo (cloud) zone, defined between SSA and SSB - a region of ambiguity and compression;
∴ The Senkou Span A and Span B are nearly flat, signaling lack of directional command in the near term;
∴ Kijun and Tenkan lines are converged, offering no trend bias - equilibrium is dominating.
✴️ Conclusion: Logic sealed - Ichimoku confirms a neutralized compression state; breakout required for trend clarity.
⊢
▦ RSI (21) + EMA9 - (Relative Strength Index with Signal Smoothing):
∴ RSI value stands at (51.48), while the EMA9-signal rests at (52.25) - confirming a soft bearish crossover;
∴ The RSI has declined from its recent peak and now oscillates around the neutral 50-line;
∴ Momentum is waning without structural damage, indicating tactical cooling.
✴️ Conclusion: Logic sealed - RSI confirms suspended momentum; structural neutrality prevails beneath fading thrust.
⊢
▦ Stochastic RSI - (3, 3, 21, 9):
∴ Current values are: (%K = 35.33), (%D = 32.68) - with %K slightly above %D, forming a mild bullish crossover;
∴ The oscillator has just risen from oversold levels, indicating potential energy buildup;
∴ Prior cycles in this zone have produced false starts, so confirmation is essential.
✴️ Conclusion: Logic sealed - Stoch RSI hints at rebounding energy, but with fragile structure and low reliability.
⊢
▦ MACD - (9, 21, 9 - EMA/EMA):
∴ MACD Line = (–105.52), Signal Line = (–129.07), Histogram = (+23.55) - confirming a bullish crossover;
∴ The crossover occurred below the zero line, indicating a possible reversal from weakness rather than strength;
∴ Slope of MACD is positive but modest - insufficient to declare dominant shift.
✴️ Conclusion: Logic sealed - MACD is in bullish transition mode, but still recovering from beneath structural base.
⊢
▦ OBV + EMA9 - (On-Balance Volume with Trend Overlay):
∴ OBV currently reads (71.13M), and is slightly above its EMA9, signaling retention of volume without strength;
∴ Volume has not left the system - but neither has it surged; this is passive accumulation at best;
∴ No divergence exists for now, but lack of buildup implies neutral positioning.
✴️ Conclusion: Logic sealed - OBV is stable and neutral; no buyer escape, but no commitment surge either.
⊢
▦ Volume + EMA21 – (Volume Profile with Trend Average):
∴ Current volume bar = (13.91), sitting below the EMA21 baseline;
∴ The volume profile across recent sessions is declining - suggesting consolidation or exhaustion;
∴ No breakout volume spike has accompanied price stabilization - trend is under silent compression.
✴️ Conclusion: Logic sealed - volume fails to validate price levels; tactical fragility remains unresolved.
⊢
🜎 Strategic Insight – Technical Oracle:
∴ The H4 structure presents a state of compression beneath a neutral cloud, suspended between tactical short-term EMA's (9, 21) and safeguarded by a rising EMA50 backbone;
∴ Momentum oscillators (RSI, Stoch RSI, MACD) converge toward reactivation, yet none have broken decisively above neutral thresholds - reflecting potential, not power;
∴ Volume participation is inconsistent and fading, offering no confirmation for breakout - the market is in silent observation mode, not assertion;
∴ Ichimoku confirms indecision: price floats within Kumo, without command or breakout - equilibrium reigns;
∴ Price positioning remains elevated above the deeper structure (EMA200), but its current zone between EMA9 and EMA50 represents a coil of indecision;
∴ The overall condition is not bearish - but it is tactically suspended, lacking conviction, awaiting external ignition.
✴️ Conclusion: The Oracle confirms - the structure is intact, but tactical initiative is lost; the field is poised, not marching.
⊢
∫ II. On-Chain Intelligence – (Source: CryptoQuant):
▦ Short-Term Holder (SOPR):
∴ SOPR currently reads (1.001), meaning short-term holders are spending coins with no significant profit or loss - a signal of economic neutrality;
∴ The chart displays persistent lateral volatility around the (1.0) threshold since early July - no emotional dominance in market behavior;
∴ This pattern historically coincides with pre-expansion compression phases, rather than breakdown events.
✴️ Conclusion: Logic sealed - SOPR confirms behavioral neutrality among short-term holders; the market remains in a state of expectation, not realization.
⊢
▦ STH-MVRV - (Short-Term Holder Market Value to Realized Value):
∴ The metric is currently oscillating around (1.30), well above the danger zone at (1.0), but far below the euphoria threshold at (1.8);
∴ The structure reflects multiple euphoria rejections, followed by a return to balance - a classic cooling-off pattern without structural failure;
∴ Convergence between market price, realized value, and short-term cost basis indicates the market is retesting foundation zones.
✴️ Conclusion: Logic sealed - STH-MVRV confirms post-euphoric cooling with structural support intact; no active trend, no breakdown.
⊢
▦ Exchange Inflow Spent Output Age Bands - (All Exchanges):
∴ Inflows to exchanges have been consistently low in recent weeks, particularly among young coins (0d–1d, 1d–1w) - showing no urgency to sell;
∴ Aged outputs (>6m) remain dormant - long-term holders are not mobilizing;
∴ The absence of inflow pressure signals no macro panic or exit event, reinforcing the diagnosis of tactical compression.
✴️ Conclusion: Logic sealed - muted inflows confirm a lack of distribution catalysts; stable structure sustains the technical silence on the 4H chart.
⊢
🜎 Strategic Insight - On-Chain Oracle:
∴ All three on-chain metrics converge into a clear state of tactical equilibrium - not bearish, not euphoric, but suspended between action and observation;
∴ Short-Term Holder SOPR stabilizes at (1.001), marking a precise psychological stasis - profit-taking and panic-selling are both absent;
∴ STH-MVRV confirms a post-euphoria cooldown with structural preservation, implying that short-term holders have recalibrated expectations without abandoning their positions;
∴ Exchange inflows remain historically depressed, with no aged coins activating - a hallmark of silent markets preparing for resolution;
∴ The chain speaks softly: no exit, no aggression, no irrationality - only latency, and the potential energy of stillness.
✴️ Conclusion: The Oracle confirms - the on-chain architecture reflects suspended initiative; nothing is broken, nothing is charged - only paused.
⊢
𓂀 Stoic-Structural Interpretation:
▦ Structurally: Bullish;
∴ Price remains well above the EMA200 and EMA50, with no breach of long-term support;
∴ All EMA's (9, 21, 50) are compressing, but retain upward trajectory - confirming structural integrity;
∴ Ichimoku Kumo holds price within a neutral band, but does not reflect a breakdown.
⊢
▦ Momentum-wise: Suspended Compression.
∴ MACD shows bullish crossover from beneath, but lacks amplitude to confirm trend reversal;
∴ RSI is parked around 50 with a bearish signal crossover - signaling stagnation, not strength;
∴ Stochastic RSI is climbing out of oversold, but with no impulsive follow-through.
⊢
✴️ Final Codex Interpretation:
∴ The H4 structure is consolidating beneath short-term resistance and within equilibrium clouds;
∴ Momentum is rebuilding, but flow remains stagnant;
∴ Buyers have not exited, but neither have they re-initiated force;
∴ The chart breathes - but does not speak.
⊢
⧉
· Cryptorvm Dominvs · MAGISTER ARCANVM · Vox Primordialis ·
⚜️ ⌬ - Silence precedes the next force. Structure is sacred - ⌬ ⚜️
⧉
⊢
BTC/USDT – 4H Chart Technical AnalysisBTC/USDT – 4H Chart Technical Analysis
Market Structure & Trend
Overall Trend : Bearish (clearly defined by a consistent downtrend channel).
Current Structure : Price is in a corrective downtrend within a descending channel, after multiple rejections from the supply zone.
Key Technical Zones
1. Supply Zone
Strong rejection zone where the price previously reversed sharply.
Still acting as resistance, located around the upper range.
2. Demand Zone
Currently being retested for the fifth time, weakening its strength.
Recent price action shows liquidity sweep and swing low break inside this zone, potentially trapping early longs.
Fair Value Gaps (FVG) & Fibonacci Levels
1D FVG sits below the current demand, aligning with:
Golden Pocket (0.618–0.65 Fib).
Acts as a high-probability bounce zone for long entries if demand fails.
A break below this FVG could open up deeper downside toward the 0.786 Fib or beyond.
Psychological Levels
105,000 – Major resistance & potential take-profit area for long positions.
100,000 – Key support and liquidity magnet if the demand zone fails.
Volume Profile
High Volume Node: 102,000 – 106,800 — price tends to gravitate here, indicating potential consolidation or resistance.
Low Volume Area: Below 100,500 — suggests thin liquidity, which may cause sharp moves if price drops into this range.
Scenarios & Trade Ideas
Bullish Scenario
If price holds above the demand zone (after multiple retests) and confirms on LTF:
Potential Long to local resistance.
On breakout, target the 105,000 psychological level.
Confluence: High volume area offers both support and a magnet.
Bearish Scenario
If price fails to hold the demand zone:
Enter short position targeting the 1D FVG and 100,000 psychological level.
If that breaks, expect sharp continuation due to low volume below.
Conclusion
Price is at a pivotal point — currently balancing on weakened demand after multiple retests. Watch for LTF confirmation:
Above demand = bullish recovery setup.
Below demand = bearish continuation toward 100,000 and the FVG.
Manage risk tightly due to the proximity of both key zones.

Bitcoin in Tactical Suspension - Beneath the Compression Veil.⊣
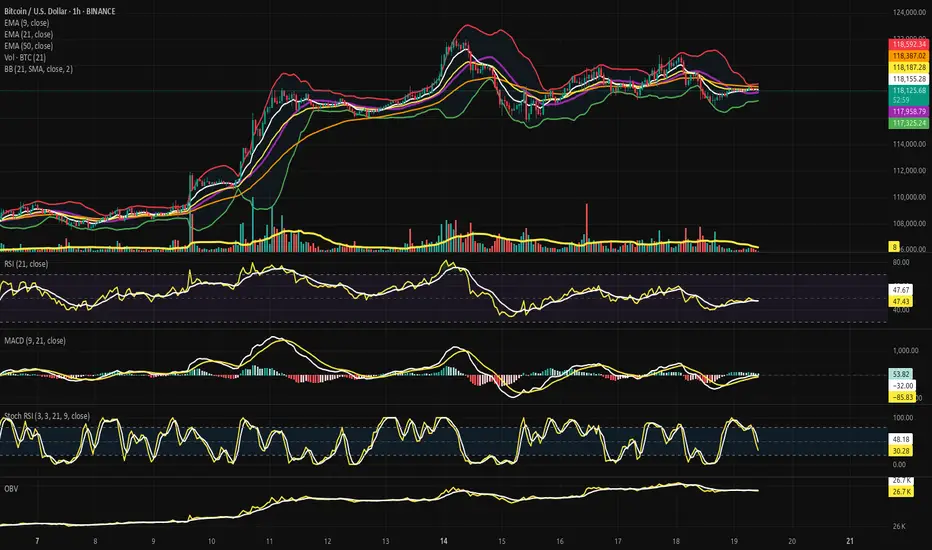
⨀ BTC/USD – BINANCE – (CHART: H1) – (July 19, 2025).
◇ Analysis Price: $118,192.34.
⊣
⨀ I. Temporal Axis - Strategic Interval - (H1):
▦ EMA9 - (Exponential Moving Average - 9 Close):
∴ Price: $118,192.34 | EMA9: $118,176.07;
∴ EMA9 is currently being pierced by price - neither clearly above nor decisively rejected;
∴ The EMA9 has flattened - signaling short-term equilibrium tension, not momentum dominance;
∴ Price candles are compressing into the EMA9 without thrust - indecision at the microstructure.
✴️ Conclusion: Logic sealed - EMA9 reflects tactical stalling; energy coiled at surface level.
⊢
▦ EMA21 - (Exponential Moving Average - 21 Close):
∴ EMA21: $118,199.53 - now above current price, acting as immediate tactical resistance;
∴ A minor bearish slope is forming in EMA21, reflecting recent downside pressure;
∴ Price failed to sustain any candle close above this level in the last 5 sessions - confirming resistance activation.
✴️ Conclusion: Logic sealed - EMA21 has turned from guide to barrier; tactical trend favors compression below.
⊢
▦ EMA50 - (Exponential Moving Average - 50 Close):
∴ EMA50 stands at $118,400.31, well above both price and the shorter EMA's - defining a ceiling of short-term exhaustion;
∴ Its curve is turning sideways, indicating that dominant upward momentum has faded;
∴ The last time price touched EMA50 was during the failed attempt to reclaim the upper Bollinger band - sign of rejection.
✴️ Conclusion: Logic sealed - EMA50 confirms the upper boundary of compression; the short-term trend remains capped.
⊢
▦ Bollinger Bands - (21 SMA, 2 Standard Deviations):
∴ Current BB range:
• Upper Band: $118,586.19;
• Lower Band: $117,291.33;
• Midline - (SMA21): $117,938.76;
∴ Price sits marginally above the midline, but beneath the upper band - indicating a neutral stance within the envelope;
∴ Bands are in a state of mild contraction, reflecting reduced volatility and lack of decisive breakout pressure;
∴ Price has failed to close above the upper band on multiple attempts, suggesting exhaustion without thrust;
✦ Tactical Signal:
• The flattened curvature of the bands and the centering of price near the midline indicates that the market is in compression;
• This condition favors mean-reversion trades or breakout anticipation setups, but lacks directional conviction;
• No squeeze pattern is imminent - but energy is coiling slowly.
✴️ Conclusion: Logic sealed - Bollinger structure is balanced, with compression overtaking directional thrust; breakout not yet awakened.
⊢
▦ Volume + EMA21 - (Tactical Volume Profile H1):
∴ The latest H1 volume candle registers 9 (unit scale), significantly below the average trend of the prior days;
∴ There has been a consistent decline in volume since the spike observed near the $120k rejection zone - participation is fading;
∴ Volume EMA21 is now visibly above most recent volume bars, signaling that market energy has dropped beneath its tactical baseline;
✦ Tactical Diagnosis:
• A market with low volume near compression zones often reflects lack of initiative, not calm;
• The absence of sellers is not strength - it is hesitation;
• The lack of follow-through volume confirms that current price action is drifting, not being driven.
∴ No volume-led breakout is forming - the structure is floating within silence.
✴️ Conclusion: Logic sealed - tactical volume profile confirms stasis; market awaits external spark to ignite movement.
⊢
▦ RSI (21) + EMA9 - (Relative Strength Index – H1):
∴ RSI value: 48.13, EMA9 of RSI: 47.86 - both seated precisely on the neutral axis (50), indicating momentum equilibrium;
∴ RSI has been flatlining between 45/50 for several hours, reflecting a lack of directional force from both bulls and bears;
∴ The minor bullish crossover of RSI over its EMA9 is present, but lacks slope, strength, or historical reliability in the current formation;
✦ Interpretation Layer:
• This is a classic pause zone - RSI not weak enough to signal reversal, not strong enough to suggest advance;
• The close proximity of RSI and its EMA9 suggests a market suspended in technical indecision;
• No bullish or bearish divergence is visible - just momentum silence.
∴ Tactical RSI echoes the broader reading: structure without drive, energy held in restraint.
✴️ Conclusion: Logic sealed - RSI reflects equilibrium; momentum direction is undefined and dormant.
⊢
▦ MACD (9,21) - (Tactical Momentum Engine - H1):
∴ Current MACD Line: (+165.21), Signal Line: (+188.36) - forming a bearish crossover, with the MACD line now trailing the signal line for multiple candles;
∴ The histogram is negative and expanding, confirming that bearish momentum is actively growing, not stalling;
∴ The slope of the MACD line has turned definitively downward, with no flattening in sight - this indicates a sustained momentum bleed;
✦ Tactical Interpretation:
• The momentum crest occurred near $119,700, and since then, MACD has been fading consistently;
• Price has failed to reclaim the MACD highs despite proximity, suggesting a divergence in effort vs. energy;
• This is not a false cross - but a validated tactical downturn with histogram acceleration.
∴ The engine beneath the structure is declining in output - the wheels turn, but they no longer drive.
✴️ Conclusion: Logic sealed - MACD confirms tactical momentum decay; the engine is reversing beneath the surface.
⊢
▦ Stochastic RSI (3,3,21,9) - (Short-Term Momentum Oscillator - H1):
∴ %K: 51.29, %D: 68.32 - a confirmed bearish crossover has occurred, with %K now beneath %D and both values descending;
∴ The oscillator has recently exited the overbought region (>80) and is now transitioning through the mid-zone, reflecting short-term loss of thrust;
∴ Price has failed to respond to prior overbought readings with continuation — indicating momentum dissipation without execution;
✦ Microstructure Insight:
• The current descending arc of %K + %D shows that micro-traders are unwinding positions;
• The zone between 50/70 is a tactical fading region, not a place of strength;
• Absence of a rebound in %K suggests that short-term buyers are standing down.
∴ This oscillator confirms that momentum is not only absent - it is actively declining at the tactical level.
✴️ Conclusion: Logic sealed - short-term momentum cycle is unwinding; compression reigns over velocity.
⊢
▦ OBV + EMA9 - (On-Balance Volume with Tactical Smoothing - H1):
∴ Current OBV: (–89.21K, EMA9 of OBV: –89.02K) - OBV remains slightly below its moving average, indicating a net negative flow of volume;
∴ While price has drifted sideways, OBV has continued to tilt downward, reflecting silent capital outflow beneath surface price stability;
∴ There is no upward curvature or crossover attempt - the OBV line remains submissive, signaling passivity or tactical retreat from market participants;
✦ Strategic Implication:
• The sustained divergence between OBV and price implies that larger hands are not accumulating - rather, they are disengaged;
• This condition often precedes fake breakouts or downward drifts, especially when unconfirmed by volume or RSI;
• The EMA9 serving as a lid rather than support confirms that internal flow is structurally bearish at the H1 frame.
∴ The tactical OBV structure reveals the undercurrent: orderless and hollow, despite price still holding ground.
✴️ Conclusion: Logic sealed - OBV confirms quiet withdrawal of pressure; tactical structure lacks foundational support.
⊢
🜎 Strategic Insight - Technical Oracle:
∴ The H1 tactical frame reveals a market in constrained inertia - price floats between short-term EMA's, yet every major momentum engine (MACD, Stochastic RSI, OBV) confirms internal recession;
∴ EMA's no longer guide - they constrain;
∴ Bollinger Bands contract - but hold no breakout;
∴ Volume is absent - and OBV confirms retreat;
∴ The chart is alive in form, yet dead in force;
∴ No element acts as initiator - only sustainers remain;
∴ The next tactical move must emerge externally, not organically.
✴️ Conclusion: The Tactical Oracle speaks - market energy is sealed beneath compression; movement is possible, but currently unprovoked.
⊢
▦ Structurally (H1):
✴️ Structurally: Neutral.
∴ Price floats near EMA9, below EMA21 and EMA50 - without rejection or breakthrough;
∴ No directional dominance has been established in the current cycle;
∴ Compression prevails over construction - this is not collapse, but pause.
✴️ Conclusion: Logic sealed - the structure is balanced but unsustained; no active trend is in command.
⊢
▦ Tactically: Suspended under Soft Compression:
∴ Momentum indicators (MACD, Stoch RSI, OBV) are all aligned in tactical decay - no upside thrust is evident;
∴ Volume remains below threshold and fails to accompany price fluctuations - a sign of apathy, not conflict;
∴ Price is trapped between EMA's and centered within Bollinger range - with no pressure buildup for breakout.
✴️ Conclusion: Logic sealed - the market is in tactical suspension, drifting within a soft compression chamber; movement requires external ignition.
⊢
⧉
· Cryptorvm Dominvs · MAGISTER ARCANVM · Vox Primordialis ·
⚜️ ⌬ - Wisdom begins in silence. Precision unfolds in strategy - ⌬ ⚜️
⧉
⊢
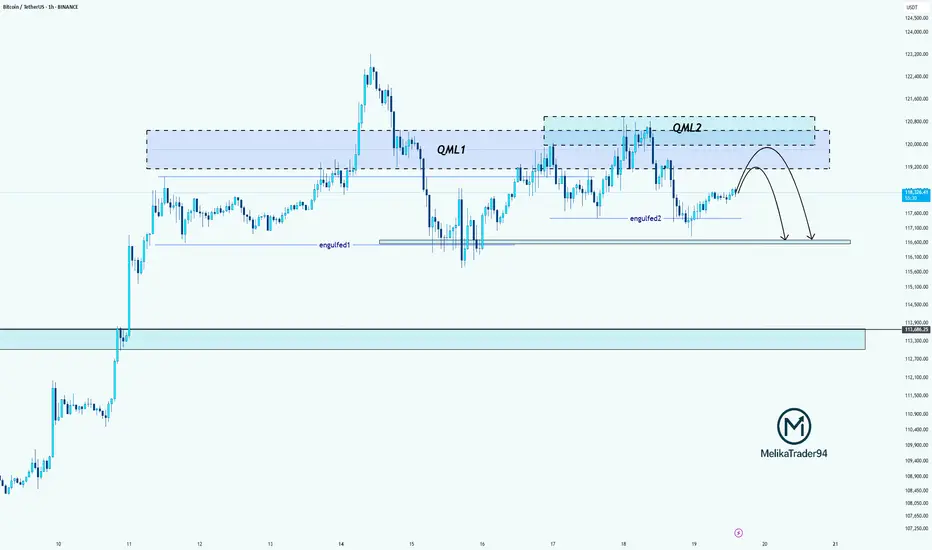
BTC Double QML Setup: Is Another Drop Loading?Hello guys!
Do you remember the last analysis?
Now this BTC chart shows a textbook example of two consecutive QML (Quasimodo Level) patterns forming (QML1 and QML2), each confirmed by clean engulfed lows.
QML1 caused a strong drop after the high was broken and a new low formed.
Price retraced and created QML2, again with a confirmed engulfed low (engulfed2).
We're now likely to see a reaction at the QML2 supply zone.
If price respects this second QML zone, we could see another bearish move toward the 116k zone, possibly lower.
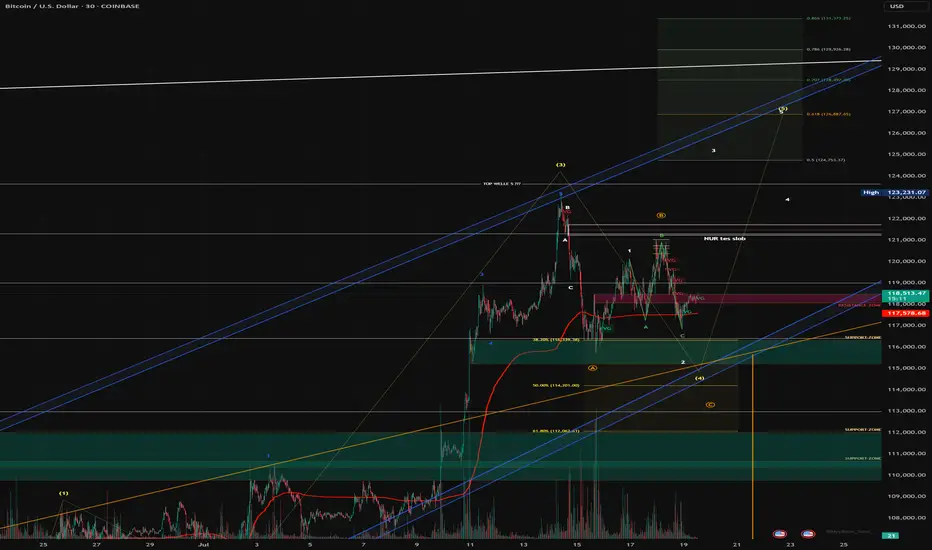
LAST BTC PUSH? Dear Community,
in order to expand my skills analysis, I will regularly share my analyses and ideas here on TradingView. I still consider myself a beginner in the “stock market” and “crypto” area and am therefore very much looking forward to your comments and input!
My primary assumption is that we are still in a final upward move. However, I am also pursuing alternative scenarios that could lead to significantly higher levels.
BTC analysis - 1H chart
In my analysis, wave (3) in yellow is complete and we are currently in wave (4) correction, which may not be complete yet.
My guess:
- Wave B (yellow) has been completed, wave C has extended and could still reach USD 113 679, where the Fibonacci 100 level is located. There is also an FVG in the 1H chart.
- A retest of the blue trend channel would be quite possible in order to pick up liquidity at this level before wave 5 (yellow) is completed between USD 126,887 and USD 130,000.
- My risk management is down to USD 107,326 (Fibonacci 1.866).
- We have already tested the Fibonacci 0.5 level (pullback level) and seen a positive reaction. However, we currently lack volume in the market.
- If the blue channel and the Fibonacci 100% level break, I have to assume an alternative count.
In this case, wave 4 would still have scope to reach the Fibonacci 61.8% level in the yellow box at USD 112,062.
If my current forecast does not materialize, I assume that we have already completed wave A and are in the correction to wave B, which will be followed by wave C - with a target of around USD 130,000 for the final impulse.
This scenario also fits in well with risk management up to the Fibonacci level of 1.866. There are also high liquidity areas (long) at this level, which are very attractive for market makers.
What do you think?
Bitcoin 2013 Fractal chart UPDATE = Nailed the PA target
Been posting this chart for the last few years and drew that Circle that PA hit, back in Feb..Way befppre PA arrived there.
I also drew that dashed Arrow line at the same time ad, as we can see frm the Daily chart beow, PA is bang on that line.
Why is it importnat that you know this ?
Because those Circles and Dashed lines are transposed from teh 2017 - 2021 fractal !
We do seem to have moved from one Fractal to another.
This has yet to be fully confirmed and the July Candle Close will certainly help identify this if we get a large green candle.
So, for now, we wait.
I will post more details about this later but fir now, if we follow this line, we can expect a cycle ATH of around 270K - 322K in Q4 2025
And then the BIG question is "What is next ?" because, as I have pointed out n another posts, we are also leaving a long term cycle (2009 - 2025 ) line of resistance....that we just broke free of...but need to remain above.
Judy is CRUCIAL

Home / UsdtHTX:HOMEUSDT
### 🧠 **Technical Breakdown of HOME/USDT (2h chart)**
#### 🔲 **Supply Zone (Resistance)**
* **Price Range:** 0.02550 – 0.02633
* This gray zone has previously caused multiple rejections.
* Several upper wicks indicate sellers are active here, absorbing buying pressure.
#### 📍 **Current Price Position**
* Price is **hovering at the edge of the supply zone** (\~0.02549).
* Candle bodies are struggling to close strongly above this region.
#### 🕳️ **Liquidity Wicks**
* A spike near **0.02664** signals liquidity hunts or stop-loss triggers.
* Repeated failures to close above this area suggest **supply dominance** for now.
#### 🔻 **Support Levels**
* **0.02469** – Weak intraday support
* **0.02257** – Strong structure support (tested and held)
* **0.02072 & 0.02036** – Deep support area; significant bounce occurred here previously
---
### 📌 Summary:
* The asset is **testing a known resistance** after recovering from lower levels.
* Behavior in the 0.02550–0.02633 zone is **critical**: either price gets absorbed and reverses, or buyers overpower and break higher.
* Support levels below are clearly defined in case of a retracement.

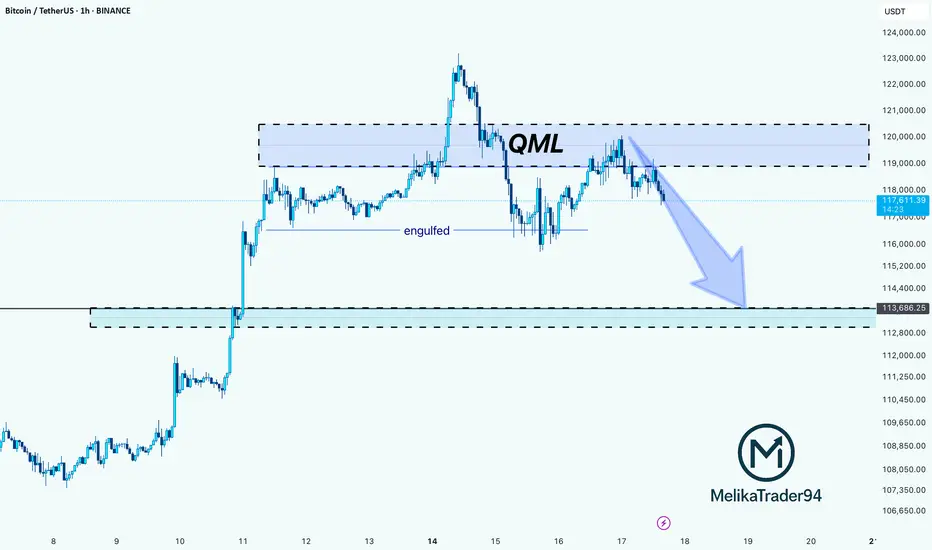
BTC Rejection from QML Zone: Towards on 113,600 SupportHello guys!
This chart shows a QML (Quasimodo Level) setup in play on Bitcoin. After price created a new high and engulfed the previous structure, it returned to the QML zone (around $119K–$121K) and reacted exactly as expected: strong rejection.
The sharp selloff from the QML area confirms a bearish shift in structure, and now the momentum is tilted to the downside.
The next key level to watch is the 113,600 demand zone, where the price may either bounce or consolidate.
As long as the price stays below the QML zone, bears have control.
You should consider that the main trend is bullish, and the stop loss may be hit, so please manage your risk!
BTC-----Buy around 118000, target 120000 areaTechnical analysis of BTC contract on July 18:
Today, the large-cycle daily level closed with a small positive line yesterday, the K-line pattern continued to rise, the price was above the moving average, and the attached indicator was golden cross and running with shrinking volume. The large-scale upward trend is still very obvious. After the previous strong performance, there was a short-term shock correction trend. According to the current trend rules, it is a correction and a trend of market demand. The trend has not changed; the short-term hourly chart yesterday's European session price support rebound, the current K-line pattern continued to rise and the attached indicator was golden cross, so we still have to look at the continuation of the break in the day and the European session. The moving average support position is 120,000 area; the high point is near 121,000 area.
Today's BTC short-term contract trading strategy:
Buy in the 118,000 area, stop loss in the 117,000 area, target the 121,000 area, break the position and look at the 121,500 area;

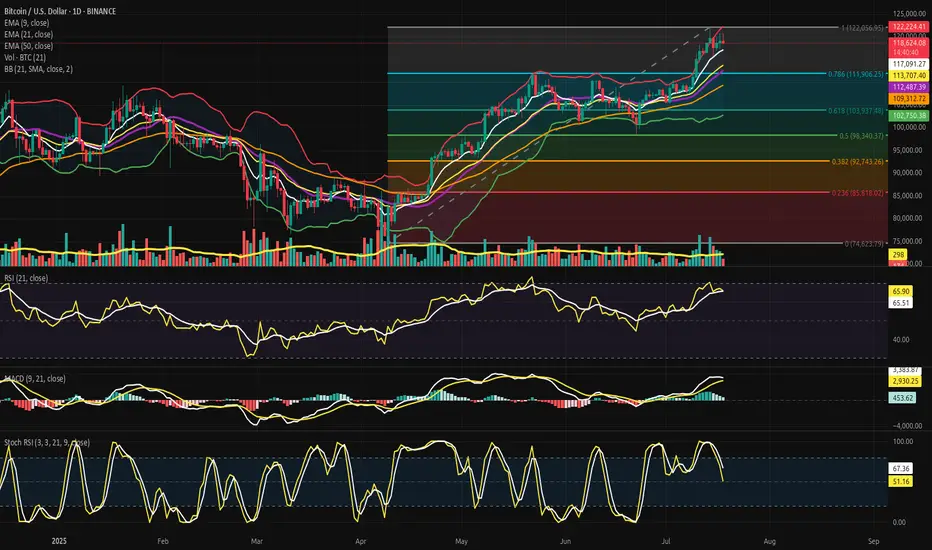
Bitcoin at the Edge of the Fibonacci Gate - Silent Strain.⊣
⟁ BTC/USD - BINANCE - (CHART: 1D) - (Jul 18, 2025).
◇ Analysis Price: $118,866.60.
⊣
⨀ I. Temporal Axis - Strategic Interval - (1D):
▦ EMA9 - (Exponential Moving Average - 9 Close):
∴ EMA9 is currently positioned at $119,077.81, closely tracking the current price, acting as dynamic micro-support;
∴ The slope of EMA9 remains upward, with price consistently closing above it in the past sessions;
∴ Compression candles are forming above this line, suggesting it is being defended as a tactical floor.
✴️ Conclusion: EMA9 is structurally supportive, signaling short-term bullish control beneath compression.
⊣
▦ EMA21 - (Exponential Moving Average - 21 Close):
∴ EMA21 is placed at $118,537.29 and holds a clear upward slope;
∴ Recent pullbacks have tested the region near EMA21 but failed to close beneath it;
∴ EMA21 is establishing itself as the primary mid-range buffer zone within this bullish phase.
✴️ Conclusion: EMA21 confirms intermediate momentum preservation and mid-term trend integrity.
⊢
▦ EMA50 - (Exponential Moving Average - 50 Close):
∴ EMA50 is located at $116,804.80 and remains untouched during the current rally phase;
∴ The distance between EMA21 and EMA50 is widening, confirming structural momentum;
∴ This line now functions as the lower tier of the bullish envelope - a defensive anchor.
✴️ Conclusion: EMA50 reflects resilient bullish understructure and rising support basin.
▦ Fibonacci Retracement - (ATH = $122,056.95 / Low = $74,623.79):
∴ Price is currently positioned just under the 0.786 level, a classic tension zone before ATH retests;
∴ The 0.618 level has already been claimed and held as support, showing strength through key retracements;
∴ The market is coiling between 0.786 and 1.000 in preparation for decisive expansion or rejection.
✴️ Conclusion: BTC sits within the golden gate - structurally pressurized near final resistance thresholds.
⊢
▦ Bollinger Bands:
∴ Bands are visibly contracting, forming a volatility funnel around the current price zone;
∴ The price is maintaining proximity to the upper band without closing beyond it;
∴ The base band remains far beneath ($116k zone), indicating untriggered potential.
✴️ Conclusion: Volatility is compressing structurally; directional resolution is imminent.
⊢
▦ Volume + EMA21:
∴ Volume bars have declined steadily during this upper-range consolidation;
∴ EMA21 on volume confirms weakening participation relative to early July moves;
∴ Absence of breakout-volume suggests either stealth accumulation or passive stalling.
✴️ Conclusion: Volume behavior is non-confirmatory - the structure floats without conviction.
⊢
▦ RSI - (21) + EMA9:
∴ RSI(21) currently prints 60.45, above its own EMA9 at 59.41, suggesting net upward pressure;
∴ The RSI slope remains neutral-to-positive without entering overbought;
∴ The absence of bearish divergence confirms internal momentum coherence.
✴️ Conclusion: RSI structure is clean, moderate, and aligned with sustainable trend energy.
⊢
▦ Stochastic RSI - (3,3,21,9):
∴ K = 78.78 | D = 71.55 - both above 70, nearing the overbought ceiling;
∴ The fast line (K) shows minor inflection but no confirmed cross;
∴ Momentum is elevated, but historical context shows price can remain extended.
✴️ Conclusion: Momentum is entering saturation zone - caution on short-term exhaustion.
⊢
▦ MACD - (9,21):
∴ MACD line (540.52) remains above the signal line (414.93) in sustained bullish crossover;
∴ The histogram has begun flattening, indicating reduced acceleration;
∴ There is no bearish cross yet, but momentum build is slowing.
✴️ Conclusion: MACD supports bullish continuation, but thrust intensity is decaying.
⊢
▦ OBV + EMA9:
∴ OBV reads 71.13M and is currently flat, with no new highs in accumulation;
∴ EMA9 on OBV closely hugs the raw OBV line, confirming stagnation;
∴ Prior upward surges in OBV are not being extended, showing tactical pause in conviction.
✴️ Conclusion: Liquidity expansion has halted; OBV structure is tactically neutral.
⊢
🜎 Strategic Insight - Technical Oracle:
∴ The BTC/USD structure is entering a compressed apex between structural momentum (EMA stack, RSI, MACD) and tactical exhaustion signals (Stochastic RSI, Bollinger Band constriction, flattening OBV);
∴ Price is stabilizing just beneath the ATH gate ($122,056), indicating a threshold scenario - where breakout and rejection probabilities are approaching parity;
∴ Volume decline reflects the absence of forced participation, and suggests that the next move will be event-triggered or liquidity-engineered. The current environment favors volatility re-expansion, not trend reversal;
✴️ This is a threshold phase: structurally bullish, tactically suspended, awaiting ignition.
⊢
∫ II. On-Chain Intelligence – (Source: CryptoQuant):
▦ Exchange Netflow Total + EMA9:
∴ Current Netflow: -938 Bitcoins - sustained negative flow over time indicates coins leaving exchanges;
∴ Persistent outflows reflect holding sentiment and reduced immediate sell pressure;
∴ Price action shows historical upside alignment when netflows remain negative across clusters.
✴️ Conclusion: Exchange behavior signals macro holding bias, not liquidation cycles.
⊢
▦ Binary CDD + EMA9:
∴ Binary CDD has spiked into high activity zones in the past week, showing awakened dormant coins;
∴ This metric historically precedes localized tops when synchronized with weak flows;
∴ However, no consistent clusters are forming - signals remain scattered.
✴️ Conclusion: Binary CDD reflects isolated movements, not systemic awakening or distribution.
⊢
▦ Exchange Whale Ratio + EMA9:
∴ Current ratio hovers at ~0.62 - elevated but not extreme;
∴ Sustained whale activity near 0.60+ can precede volatility events;
∴ Trendline is rising since May, showing gradual uptick in dominance from top senders.
✴️ Conclusion: Whale activity is tactically elevated, implying latent strategic intent.
⊢
▦ Supply-Adjusted Dormancy + EMA9:
∴ Dormancy values are near historical lows, indicating old coins are staying inactive;
∴ EMA9 confirms a downward trend in dormant supply movement;
∴ Long-term holders are not distributing at this level.
✴️ Conclusion: Structural dormancy supports holder conviction - no exit signals from old supply.
⊢
▦ Realized Cap + EMA9:
∴ Realized Cap is now exceeding $1T, rising consistently without parabolic spikes;
∴ EMA(9) and line are in lockstep - a healthy ascent;
∴ No acceleration = no blow-off = sustainable revaluation.
✴️ Conclusion: Value accumulation remains organic, not euphoric.
⊢
▦ MVRV Ratio + EMA9:
∴ MVRV sits at 2.36 - below historical overvaluation levels (>3.0);
∴ EMA(9) confirms gradual slope upward, consistent with price;
∴ Ratio is not overheated - risk/reward remains structurally favorable.
✴️ Conclusion: MVRV indicates non-euphoric regime - mid-phase of value appreciation.
⊢
▦ BTC vs GOLD vs S&P500 - (BGemetrix Comparative Graph):
∴ BTC continues to outperform both GOLD and SPX in long-term slope, even after corrections;
∴ Current phase shows GOLD flattening and SPX slightly lagging BTC in verticality;
∴ This divergence hints at BTC leading in speculative rotation while traditional assets stabilize.
✴️ Conclusion: BTC holds macro-dominance position, operating as the apex volatility proxy in current intermarket structure.
⊢
🜎 Strategic Insight - On-Chain Oracle:
∴ Despite short-term compression, the on-chain structure reveals no distribution threats;
∴ Holder conviction, realized valuation, and MVRV slope all suggest controlled structural appreciation, not mania;
∴ Whales are tactically present, but dormancy and exchange flows confirm no mass exit;
∴ This is an internally coherent, tactically patient regime.
✴️ Bitcoin is preparing, not peaking.
⊢
𓂀 Stoic-Structural Interpretation:
▦ Structurally Bullish - Tactically Suspended:
∴ All key EMA's (9/21/50) are stacked and rising; price remains elevated yet non-parabolic;
∴ Fibonacci apex is active, with price compressing beneath the ATH zone ($122,056), not retreating;
∴ On-chain intelligence confirms long-term conviction, with no distribution from whales or dormants.
✴️ Conclusion: The system retains structural strength; pressure is latent, not expired. The architecture is bullish, not euphoric.
⊢
▦ Tactical Range Caution:
∴ Stochastic RSI and MACD show early-stage exhaustion;
∴ Volume has declined into apex, favoring liquidity traps or volatility bursts;
∴ Whale Ratio elevation implies pre-positioning behavior, not public confirmation.
✴️ Conclusion: Tactical maneuvering is dominant. Breakout potential exists but is not trustable until confirmed by volume and displacement.
⊢
⧉
Cryptorvm Dominvs · ⚜️ MAGISTER ARCANVM ⚜️ · Vox Primordialis
⌬ - Wisdom begins in silence. Precision unfolds in strategy - ⌬
⧉
⊢
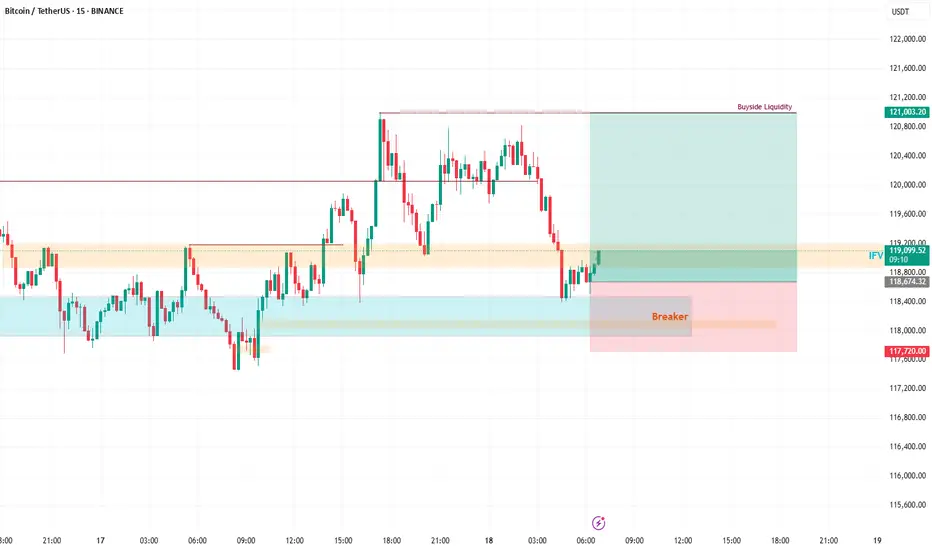
The Setup: Bullish Breaker in Play!Yesterday, BTC smashed into a strong bullish breaker and bounced like a champ. Today, it’s retracing back to this key level, setting up for what I expect to be another explosive buy reaction. Why? Because this breaker is rock-solid, and the price action is giving us all the right signals! Plus, it’s Friday—the last trading day of the week—and I’m betting BTC will stretch its legs to cover the weekly range. 🏃♂️
🎯 Trade Details: Where to Jump In
Buy Area: Right now, the price is teasing the breaker zone.
Stop Loss: Protect your capital with a stop loss at around ~117,700.
Target: We’re aiming for the Buyside Liquidity sitting pretty around 121,000. That’s a juicy move with solid risk-reward potential! 💪
🧠 Why This Trade Makes Sense
Bullish Breaker Strength: This level has proven itself as a springboard for price action.
Weekly Range Play: Fridays often see BTC push to cover its weekly range, and we’re in prime position to catch it.
Liquidity Grab: The Buyside Liquidity at 121,000 is like a magnet for price—let’s ride it there!
⚠️ Risk Management Reminder
Always trade smart! Use proper position sizing, stick to your risk management rules, and don’t go all-in like it’s a casino. Keep those stops tight to avoid getting wrecked by any sudden volatility. 😎
💬 Join the Conversation!
What do you think of this setup? Are you jumping on this BTC train or waiting for more confirmation? Drop your thoughts in the comments below! 👇 Also, if you like this idea, smash that LIKE button ❤️ and follow for more trade ideas to keep your portfolio poppin’! 🚀
Happy trading, and let’s stack those pips! 💰
#BTC #CryptoTrading #BuyTrade #Bullish #TradingView