Bitcoin (BTC/USD) Trade Setup: Potential Reversal & Target Proje200 EMA (Blue): 86,960.21
30 EMA (Red): 86,149.39
The price is currently below both EMAs, indicating a short-term bearish trend.
Key Levels:
Stop Loss: 83,954.20 (marked in blue at the bottom)
Re-entry Level: 86,198.54 (near the 30 EMA)
Target Price: 89,056.91
Support & Resistance Zones:
Strong Support Zone: Around 83,954.20
Intermediate Resistance: Near 86,198.54
Major Resistance Zone: Close to 89,056.91
Trade Setup & Projection:
The chart suggests a potential reversal from the support zone.
The expected price movement shows a bounce from support, a breakthrough of the intermediate resistance, and a push toward the target price (89,056.91).
The expected gain is 4,509.86 points (5.34%).
Conclusion:
If BTC holds the support zone, an upside move is likely.
Breaking above 86,198.54 would confirm a bullish reversal.
Failing to hold support at 83,954.20 could lead to further downside.
Btcusdbuy
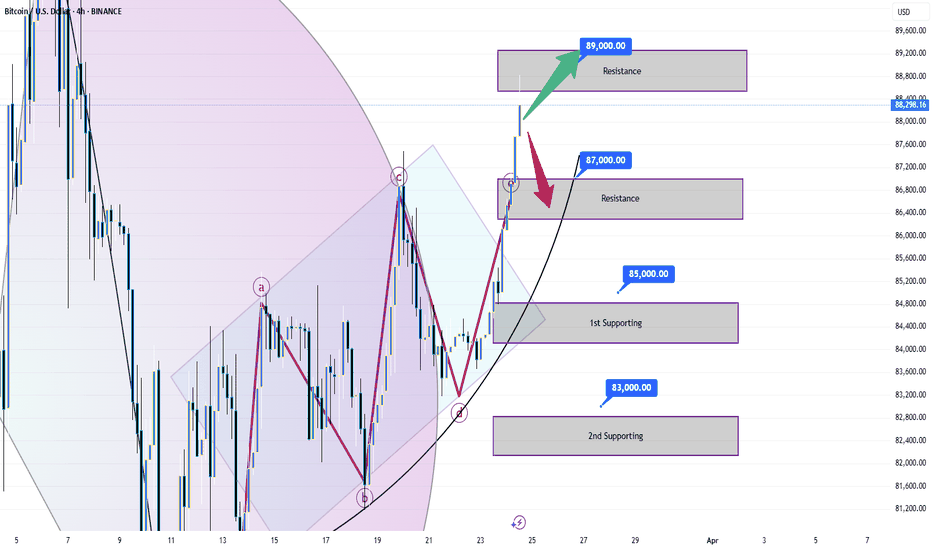
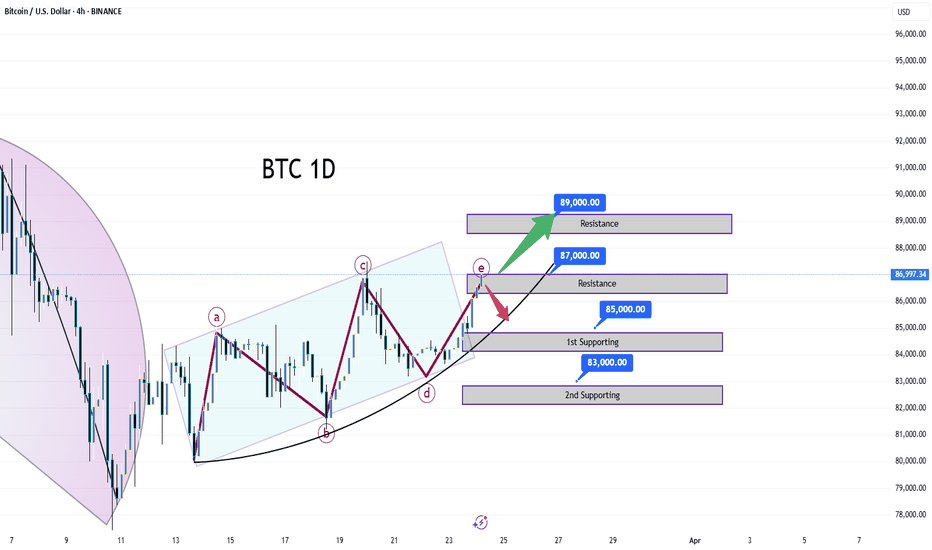
Buy@85500 - 86500Presently, Bitcoin is firmly ensconced within a robust upward trajectory. Having transitioned from a sideways trading phase at 84000 last week, it has executed a remarkable rally, surging directly into the resistance corridor in the vicinity of 89000. With the current trading price hovering at 87000, the market exudes a palpable sense of bullishness.
Should BTC sustain a stable sideways oscillation between 87000 and 88000, the bulls stand to methodically amass upward momentum. Once primed, a breakthrough of the 89000 threshold by BTC appears all but inevitable.
From a technical vantage point, Bitcoin has convincingly breached the sideways trading range. Its moving averages exhibit a distinct bullish configuration, with the 85000 level solidifying as a crucial support.
On the fundamental front, a confluence of factors—including the prevailing global economic uncertainties, the buoyant market sentiment, and the relatively permissive regulatory environment—collectively conspire to propel the continued ascent of its price.
💎💎💎 BTCUSD 💎💎💎
🎁 Buy@85500 - 86000
🎁 TP 87000 88000 89000
The market has been extremely volatile lately. If you can't figure out the market's direction, you'll only be a cash dispenser for others. If you also want to succeed,Follow the link below to get my daily strategy updates
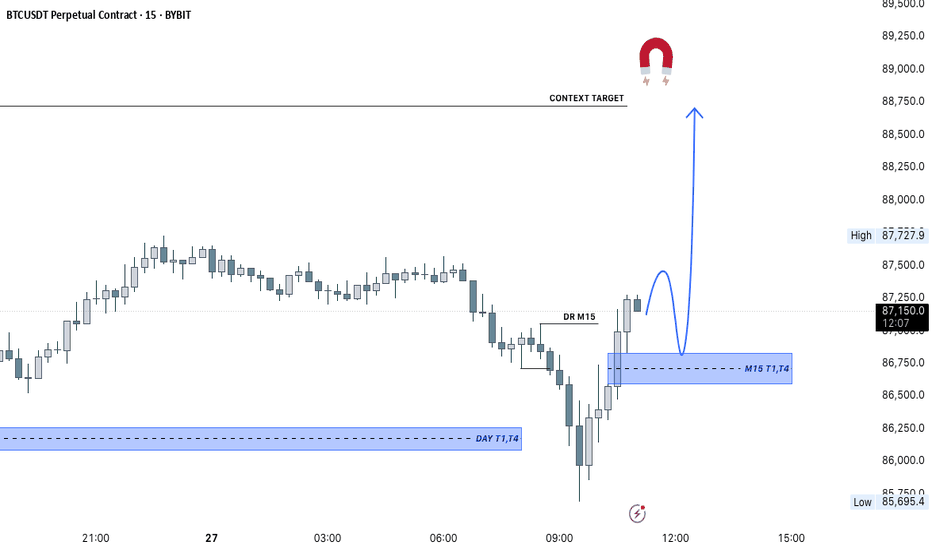
Trade Idea: BTCUSDT (15m Chart)Trade Idea: BTCUSDT (15m Chart)
Price has aggressively pushed up from the daily demand zone and is now forming a potential bullish continuation setup. A retracement into the M15 FVG zone is expected. If price respects this zone and forms a bullish reaction, a long opportunity aligns well with the context target above.
Bias: Bullish
Context: Price is targeting upside liquidity after reclaiming structure. Expecting continuation following a healthy retracement.
Trade with confirmation and risk management.
BTC(20250327) market analysis and operationYesterday, the small level broke through the previous low and then rebounded. Today, pay attention to 87000 points. If the 4-hour level can stand above this point, the correction will end and the market will continue to rise. Pay attention to the upper pressure levels near 88500, 90045 and 91250. If the 4-hour level falls below 87150 and cannot be recovered, the small rebound will be weak, and there is a high probability of sideways or retracement at a small level. Pay attention to the lower support levels near 86370, 85530 and 84775.
BTC-----Sell around 87000, target 86500 areaTechnical analysis of BTC on March 27: Today, the large-cycle daily level closed with a small negative line yesterday, the K-line pattern was a single negative with continuous positive, the attached indicator golden cross was running with shrinking volume, and the fast and slow lines were below the zero axis. The general trend was still bearish. The four-hour chart was under pressure near the 88,800 area after the rebound last week. The current K-line pattern was a continuous negative, and the attached indicator was dead cross running. There was an obvious retracement and decline trend. Let's take a look at the continuation and strength first; the short-cycle hourly chart yesterday's European session fell and the US session continued to break the previous day's low position, and the high position was corrected in the early morning near the 87,500 area. In this way, if we continue to see a retracement and fall and break the low today, then the rebound cannot break the pressure point position, otherwise it will be difficult to fall.
Today's BTC short-term contract trading strategy: sell at the rebound 87,000 area, stop loss at the 87,500 area, and target the 85,600 area;
Bitcoin Looking Bullish on 4 hour - printing a bull FlagBitcoin is certainly looking Bullish on the lower time frames and, in my opinion, continur to fall in the Flag till we get near that lower Trend line of Ascending channel we been making since the Low around 76K
The 4 hour MACD is falling Bearish and support the idea of a continues Drop to lower Trend line
I think the Margins are too tight to do any day trading
Just Sitting, waiting.
Longer term, I am still prepared to see another Drop Lower but maybe not to the 76K range again.
The Monthly candle for March is currently Green off an expected RED.
It has Long wicks above and Below, showing a good fight between Bulls and Bears.
The Body of this candle is not Big but it would take a serious drop out of range to turn it red
So, RELAX
We should be OK
BITCOIN Trending Higher - Can Bulls Maintain Momentum?COINBASE:BTCUSD is trading within a well-defined ascending channel, with price action consistently respecting both the upper and lower boundaries. The recent bullish momentum indicates that buyers are in control, suggesting a potential continuation toward higher levels.
The price has broken above a key resistance zone and successfully retested it as support, confirming the bullish structure. This retest strengthens the case for further upside, with the next target aligning with the upper boundary of the channel near $91,000.
As long as the price remains above this newly established support, the bullish outlook stays intact. However, if the price fails to hold above this zone, a deeper pullback toward the midline or the lower boundary of the channel could come into play.
Remember, always confirm your setups and trade with solid risk management.
Best of luck!
Is BTC Bitcoin Overextended? My Bias Is Bullish With Conditions!This 30-minute chart 🌟 shows Bitcoin consolidating within a descending channel after a recent bullish breakout 🚀, with a potential bullish structure forming. The price is currently testing the upper boundary of the channel near $87,500 🛡️. If the price breaks below the channel and retests the equilibrium support, it could present a strong buy opportunity 💰 . Considering the broader analysis 🌍, a break above $87,926 with strong volume 🔥 would confirm bullish momentum toward $90,000 🎯 . Not financial advice. ✨
BTC/USDT 1H: Double Top Reversal – Short Setup Below $88KBTC/USDT 1H: Double Top Reversal – Short Setup Below FWB:88K
🚀 Follow me on TradingView if you respect our charts! 📈 Daily updates!
Current Market Conditions (Confidence Level: 8/10):
Price at $87,146, showing bearish momentum following a confirmed double top formation.
Hidden bearish divergence on RSI, with lower highs while price made equal highs—classic SMC signal.
Market Makers appear to be distributing in the $88,000 – $88,250 resistance zone.
Trade Setup (Short Bias):
Entry: Current price around $87,146 is optimal for short positions.
Targets:
T1: $86,250 (-1%)
T2: $85,500 (-1.9%)
Stop Loss: $88,300 (+1.3%) above resistance zone.
Risk Score:
7/10 – High-volume rejection at resistance supports this setup, but RSI nearing oversold adds some short-term bounce risk.
Key Observations:
Strong resistance cluster at $88,000 – $88,250.
RSI at 40, approaching oversold, but divergence signals outweigh reversal for now.
Smart Money activity shows clear signs of short positioning with large bearish wicks and volume spikes.
Recommendation:
Short positions favored with tight risk management.
Consider scaling out at each target level to lock in profits.
Monitor price action closely at $86,250 for signs of absorption or bounce.
🚀 Follow me on TradingView if you respect our charts! 📈 Daily updates!
#BTC/USDT Update! This is the only Bullish trigger point!#BTC has reached our key resistance zone, the exact area I've been highlighting since last week.
So far, we've seen a clear rejection from this level.
Bitcoin still needs more momentum to break above this zone convincingly.
As long as we remain below this range, it won’t be smooth sailing for BTC or altcoins.
📊 I’ll be sharing some important altcoin charts later today.
Stay tuned!
Please hit the like button to support my content and share your views in the comment section.
Thank you
#PEACE
When will BTC break through 89,000?Currently, Bitcoin is in a strong upward trend. It has soared directly from a sideways movement at 84,000 to the resistance zone near 89,000. Now, with the price at 86,000, the market sentiment remains bullish.
If BTC maintains a stable sideways movement between 87,000 and 88,000, the bulls can gradually accumulate upward momentum. Once ready, BTC will undoubtedly break through 89,000.
Technically, Bitcoin has broken through the sideways range, and its moving averages show a bullish alignment. The 85,000 level has emerged as a significant support.
Fundamentally, factors such as global economic uncertainties, exuberant market sentiment, and a relatively relaxed regulatory environment are jointly driving the continuous upward movement of its price.
💎💎💎 BTCUSD 💎💎💎
🎁 Buy@85500 - 86000
🎁 TP 87000 88000 89000
The market has been extremely volatile lately. If you can't figure out the market's direction, you'll only be a cash dispenser for others. If you also want to succeed,Follow the link below to get my daily strategy updates
BTC:BTC is expected to continue to rise to 95000BTC has built a perfect upward structure in an oscillating upward manner, and has continuously strengthened the bottom support during the oscillation process. BTC is expected to continue to rise. However, BTC is facing the 88500-89500 resistance area, so BTC needs to accumulate energy to break through this resistance area, so we should focus on the 86500-85500 area support below. Once BTC touches this area and stops falling and rebounds, BTC is bound to break through the 88500-89500 resistance area and is expected to continue to 95000.
So in terms of short-term trading, if gold pulls back to the 86500-85500 area, we can go long on BTC.I will make more detailed trading plans and trading signals every day according to the real-time market situation, which is also the testimony of every successful transaction and profit of mine; the article has a certain lag, if you want to copy the trading signals to make a profit, or master independent trading skills and thinking, you can choose to join the channel at the bottom of the article
Continue to wait for BTC to break through 89,000Currently, Bitcoin is in a strong upward trend. It has soared directly from a sideways movement at 84,000 to the resistance zone near 89,000.
If BTC maintains a stable sideways movement between 87,000 and 88,000, the bulls can gradually accumulate upward momentum. Once ready, BTC will undoubtedly break through 89,000.
💎💎💎 BTCUSD 💎💎💎
🎁 Buy@85500 - 86000
🎁 TP 87000 88000 89000
The market has been extremely volatile lately. If you can't figure out the market's direction, you'll only be a cash dispenser for others. If you also want to succeed,Follow the link below to get my daily strategy updates
BTCUSD:Wait for a rebound before going shortThe fluctuations are not big now, judging from the structure of the 30M icon. The probability of rebounding and then falling later is relatively high. My trading idea is to wait for the rebound to go short. The short orders entered near 88K yesterday are now generally profitable. They can be closed first and then entered after the rebound to prevent the price from rising directly.
Losing profits is a trivial matter, but turning from profit to loss would be very uneconomical.
BTC READY TO EXPLODE? POTENTIAL 1H ENTRY!Hi traders! , Analyzing Bitcoin on the 1H timeframe, spotting a potential entry :
🔹 Entry: 87,509 USD
🔹 TP: 92,003 USD
🔹 SL: 81,206 USD
BTC is respecting the trendline and maintaining its bullish momentum. If this support holds, we could see a continuation toward 92K. RSI is overbought, but price action remains strong.
⚠️DISCLAIMER: This is not financial advice. Trade responsibly.
Position Open in BTC! Ready for TakeoffHi Traders ! Bitcoin has reached a key support zone, where it has historically shown bullish reactions. Additionally, the RSI at oversold levels (21.66) reinforces the possibility of an imminent rebound.
🔥 I have already entered long, expecting a bullish move toward the $85,500 - $86,000 zone, with a possible extension to $89,000 - $90,000 if it breaks the descending resistance.
📈 Key Factors to Watch:
✅ Confirmation of the bounce at support.
✅ Increase in buying volume.
✅ Break above the 20-period EMA.
Let’s see how this plays out! What are your thoughts? 🔥
⚠️ Disclaimer: This is not financial advice. I am simply sharing my analysis and personal trade. Always do your own research before trading!
BTCHello friends
You can see that after the price fell in the specified support area, the price was supported by buyers and caused the resistance to break, and now, when the price returns to the specified ranges, you can buy in steps and move with it to the specified targets, of course, with capital and risk management...
*Trade safely with us*
JUST IN: Bitcoin Reclaims $88K, Eyes $100K Breakout!The Price of Bitcoin shocked sceptics surging nearly 4% today, reclaiming the FWB:88K pivot- now setting its coast for $100k breakout amidst a bullish symmetrical triangle Pattern.
On the daily time frame, CRYPTOCAP:BTC has formed 2 bullish candlesticks, should a third identical candlestick evolve, it will lead to a breakout of the ceiling of the symmetrical triangle formed- placing CRYPTOCAP:BTC in the $90,000 - $96,000 range. A break above this pivots would cement the the move to $100k and beyond.
Similarly, should the asset faced selling pressure into making it dip below the $81k range, a selling spree could emerged.
Bitcoin Price Live Data
The live Bitcoin price today is $88,452.78 USD with a 24-hour trading volume of $29,835,452,540 USD. Bitcoin is up 3.95% in the last 24 hours, with a live market cap of $1,755,025,651,822 USD. It has a circulating supply of 19,841,384 BTC coins and a max. supply of 21,000,000 BTC coins.
the price of BTC has gone upIn the recent analysis of the cryptocurrency market, I have continuously been optimistic about the price trend of BTC. Since the last analysis, the price of BTC has steadily climbed from around 84,000 to the current 85000, further verifying the previous upward expectations.
🎁 Buy@83500 - 84000
🎁 TP 86000 - 87000
The market has been extremely volatile lately. If you can't figure out the market's direction, you'll only be a cash dispenser for others. If you also want to succeed,Follow the link below to get my daily strategy updates
BTC encountered strong resistance 89000I made an analysis this morning. I said that if the price of Bitcoin breaks through the resistance level of 87,000, it's very likely to rise all the way to 88,000 in one go, and then it will encounter the resistance level at 89,000. Look, my analysis has been verified now. It has been proven that the resistance level at 89,000 is indeed effective.
At present, it's not advisable to engage in short - selling. Instead, one can consider taking long positions again at the support level.
💎💎💎 BTC 💎💎💎
🎁 Buy@85000 - 86000
🎁 TP 88000 - 89000
The market has been extremely volatile lately. If you can't figure out the market's direction, you'll only be a cash dispenser for others. If you also want to succeed,Follow the link below to get my daily strategy updates
BTC Today's analysisLast week, BTC was in a sideways oscillation around $84,000. The competition between bulls and bears was intense, and the market was filled with strong wait - and - see sentiment, constantly waiting for a clear direction. Yesterday, the price rose to $85,000, and today it reached the $87,000 resistance point analyzed previously.
Currently, the resistance at $87,000 is significant. A large number of sell orders have gathered, putting great pressure on the price and causing frequent fluctuations. There are two reasons for this resistance. First, investors who bought at high levels earlier are selling here to stop losses or lock in profits, increasing the selling pressure. Second, investors generally expect strong resistance at this price level, so they either sell or wait and see, exacerbating the resistance.
If BTC breaks through the $87,000 mark, there is a high chance of a new upward trend in the short term. Technically, the breakthrough will attract trend - followers to enter the market and push up the price. In terms of market sentiment, it can boost confidence and trigger chasing buying. Based on the current momentum and historical experience, the price may quickly rise to the range of $88,000 - $89,000. If it fails to break through, the price may retrace to the range of $85,000 - $86,000 to seek support and start a new consolidation to accumulate upward momentum. Therefore, it is crucial to closely monitor the breakthrough of the $87,000 resistance point in the following days, as it is of great significance for investment decisions.
💎💎💎 BTC 💎💎💎
🎁 Buy@85000 - 86000
🎁 TP 88000 - 89000
The market has been extremely volatile lately. If you can't figure out the market's direction, you'll only be a cash dispenser for others. If you also want to succeed,Follow the link below to get my daily strategy updates


