BTC Today's analysis
BTC has been fluctuating at 84000 to 84500 yesterday, very stable, like a crocodile waiting for food to come, so we should always be vigilant
BTC 🎁 Buy@83000 - 83200
🎁 SL 83500
🎁 TP 84500 - 84800
If you're struggling to find direction or generate profits in finance,
I'm here to help. As a seasoned financial analyst,
I'm great at decoding market signals for profit - making chances.
I'll customize a plan for you. Contact me now to start seeing financial gains!
Btcusdbuy
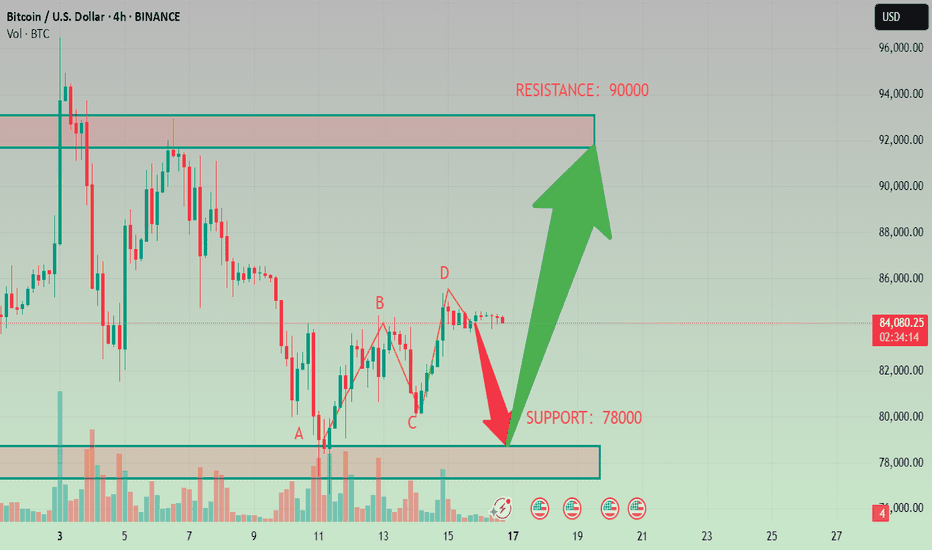
BTCUSD Analysis StrategyToday's Bitcoin market shows the dual characteristics of technical correction and cautious market sentiment. The short - term risk is inclined to the downside, but there is still rebound potential in the medium - and long - term.
The fact that the price of Bitcoin has fallen below $84,000 does not mean the end of Bitcoin. Instead, it is just a part of the market operation. For investors, the key to success lies in understanding the underlying factors of the market and correctly assessing the risks and opportunities. In a market full of uncertainties, only by staying calm and conducting rational analysis can one seize the future opportunities.
Bitcoin Trading Strategy
sell @ 90000
buy @ 78000
Finally, I'd like to remind every investor that the cryptocurrency market is inherently highly volatile, and every decision you make may have an impact on your investment returns. In this rapidly changing market, what we need is not just luck, but also a keen mind. You are all welcome to follow me. Let's discuss the future of Bitcoin together. Perhaps it is through the collision of ideas between you and me that we can gain a clearer understanding of this market.
Bitcoin Reversal or Dead Cat Bounce? Here's My Trading Plan! Analyzing BTC on the higher timeframe, we observe a clear structural shift in the prevailing trend 📊. Dropping down to the 4-hour chart, there is a decisive bullish break 📈, leaving behind an imbalance following the initial move—an area that could serve as a retracement target 🎯. Notably, this imbalance aligns with a Fibonacci retracement into equilibrium 📐, adding confluence to the setup.
I am considering a long position 💰, but only if the key conditions outlined in the video materialize ✅. If those conditions fail to align, I will discard this trade idea ❌.
⚠️ Not financial advice.
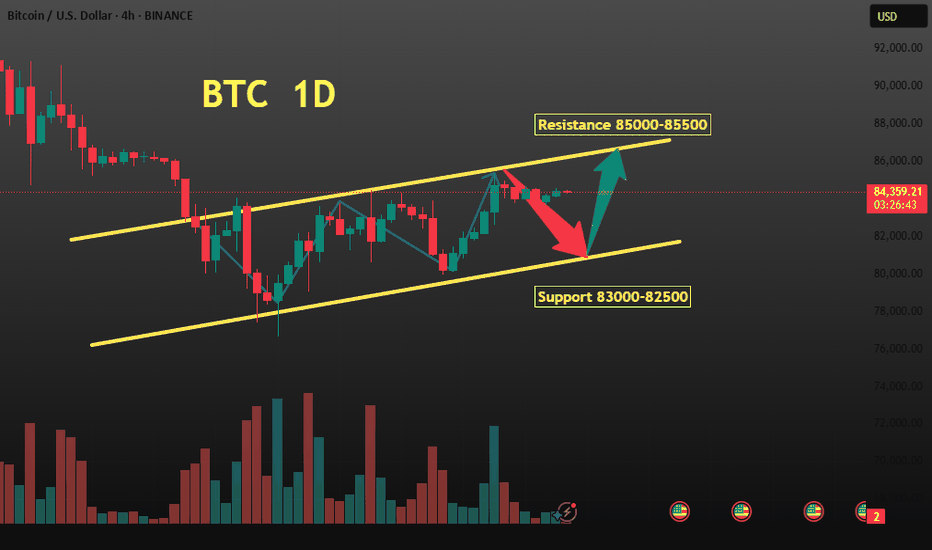
BTC Today's strategyToday, Btc is like a well baby constantly hovering around 84,300.
However, we all know that it can be deadly at any time, just as we know that its price will rise. We are merely trying to make some money in the process.
BTC 🎁 Buy@83800 - 84000
🎁 SL 83500
🎁 TP 84800 - 85000
If you're struggling to find direction or generate profits in finance,
I'm here to help. As a seasoned financial analyst,
I'm great at decoding market signals for profit - making chances.
I'll customize a plan for you. Contact me now to start seeing financial gains!
BTCUSD Trading StrategyBitcoin is currently trading at approximately $84,364.87, with a 24-hour gain of 2.96% and a 7-day cumulative decline of -2.81%. Recently, influenced by news about the Trump administration's strategic reserves, the price experienced a "sell-the-news" style pullback, retreating from its high of around $100,000 to consolidate within the $80,000 range. The short-term support level stands at $74,000, while the resistance level is at $85,000.
Bitcoin Trading Strategy
sell @ 90000
buy @ 78000
If you're currently dissatisfied with your Bitcoin trading outcomes and seeking daily accurate trading signals, you can follow my analysis for potential assistance.
Potential reversal for a short term bullishTrading Plan:
1) Buy Area: 79,243 - 78,807
2) Sell Area: 87,414.31 - 88,198.32 - 88,790.43
A potential short-term bullish reversal for BTC may occur today once it hits the fair value gap. However, please note that the overall trend remains bearish, and there is a possibility that this trend will continue due to market uncertainty driven by geopolitical factors.
BTC/USDT Trade Setup & Analysis – Key Support Bounce & TargetsSupport: The lower purple zone indicates a strong support level where the price has bounced.
Resistance: The upper purple zone marks a resistance area where price has been rejected multiple times.
2. Moving Averages:
200 EMA (Blue): At 82,800.42, acting as dynamic resistance.
30 EMA (Red): At 82,090.72, indicating short-term trend direction.
3. Trade Setup:
A long position is planned from the current support level.
Entry: Around 80,026.98 (near support).
Stop Loss: Around 76,980.09 (below support).
Take Profit Targets:
TP1: 81,636.34
TP2: 82,800.42 (near 200 EMA)
TP3: 84,481.83
TP4: 86,260.26
Final Target: 88,297.36
4. Conclusion:
The setup expects a bounce from support with a target back towards resistance levels.
Breaking 82,800 (200 EMA) is crucial for further bullish momentum.
If the price falls below 80,000, the setup might get invalidated.
Would you like a deeper breakdown on any part? 🚀
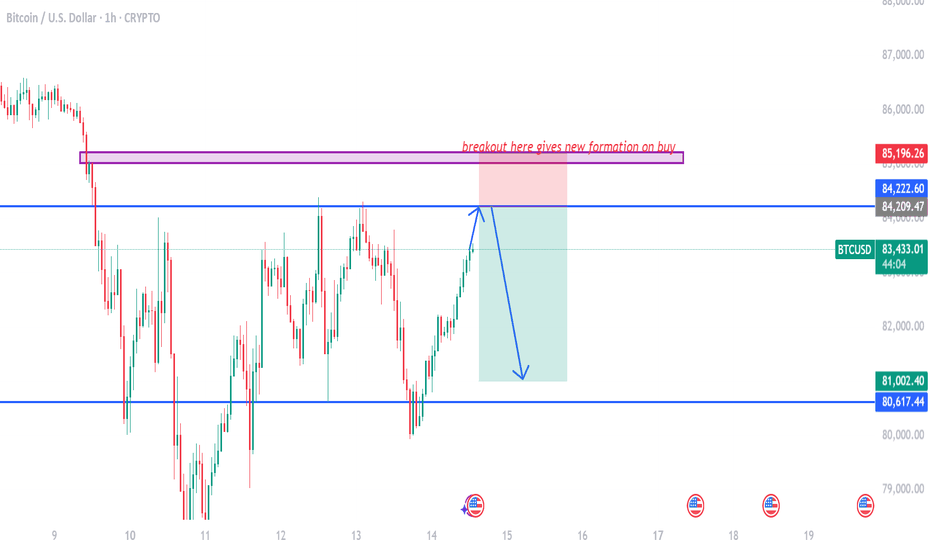
btcusd on bearish retrace#BTCUSD price have multiple retest below 81k, now we await for next double rejection to sell.
If price touch 84200 then bearish retracment is active which will drop the price till 81k. Stop loss at 85196.
Above 85196 have bullish breakout which forms new buy to reach 88k-90k limit.
BTC/USDT Reversal scenariosThere is bear mood in market, its exactly what is needed for reversal, lets have a look closer. I see 3 options.
1) Manipulation is over, we reached the target of local FIBO 1.618 at 77055$
2) Level 73764$ - its the target of Double TOP , the edge/high of the last block and 0.618 level of grand FIBO
3) POC level of last accumulation block which lasted for 255d at 67436$ - we could reach this level only with fast squeeze and fast buy back, leaving long needle on higher timeframe
BTC Buy at this Level - NFP News This Week (Volatility Risk!)Short term Buy idea on Bitcoin. This is a riskier idea because:
A) BTC is showing signs of Weakness (so we are counter trend trading)
B) This idea is based on NFP news timing
I may wait until Monday to get clarity (unless you also trade on the weekend)
Overall Idea for this is:
- W1/M candles have big rejection wicks to the downside, retesting the previous Week's wick, hinting at some Buyside potential
- We see divergence with ETH.
- The LTF H4 shows a Break of Structure, momentum move to the upside.
- We've already had a retracement down after, and it validated the gap in price (blue zone), reacting off it, hinting that it will hold.
- Now I'm waiting for the next best price to enter.
Again, NFP volatility can create bigger than usual spikes, so keeping that in mind.
If NFP takes it higher without coming to a better price, so be it - the train will leave without me. Will wait for further PA.
Price will be giving the validation to enter.
Bitcoin's market share rises despite decline in active usersThe data shows that Bitcoin's dominance has been rising steadily since 2022. It also highlights that Bitcoin's market share of active users has fallen over time. The data shows that on-chain activity in Ethereum and other layer 1 (L1) networks has increased.
OnChain data shows that Bitcoin's dominance has increased since 2022, and the upward trend is the longest in history. The data also shows that Bitcoin's active user market share has fallen as on-chain activity on the Ethereum network has increased.
Amid declining users, Bitcoin dominance has increased;
Matrixport shows that Bitcoin dominance has increased to a new high of over 61%. The analytics platform put the dominance higher, which was stronger than expected in the US jobs report. It said that the increased job rate indicates that the economy is recovering. COINBASE:BTCUSD BITSTAMP:BTCUSD BYBIT:BTCUSDT.P BINANCE:BTCUSDT
Bitcoin at $80,000. A Defining Crossroads: $65,000 or $120,000?Bitcoin stands at a critical juncture at $80,000, where market participants are engaged in a decisive battle between bullish momentum and bearish resistance. The outcome of this struggle will shape the next major move, with two distinct scenarios emerging.
Scenario 1: A Retracement Toward $65,000
If Bitcoin fails to maintain its current momentum, profit-taking and increased selling pressure could lead to a decline toward $65,000. This level serves as a crucial support zone, where demand may re-emerge to stabilize the price before any potential recovery. A break below this threshold would signal a deeper correction, potentially delaying any further upside in the near term.
Scenario 2: A Breakout Toward $120,000
For Bitcoin to sustain a move toward $120,000 by late March or early April, the market must see uninterrupted buying pressure over the next 10 days. There can be no hesitation—buyers need to absorb selling liquidity consistently, preventing any major pullbacks. The key level to watch in this scenario is $109,000, a major resistance zone that has the potential to act as the final barrier before BTC enters price discovery. A clean break and consolidation above this level would significantly increase the probability of an accelerated move toward $120,000.
At this stage, Bitcoin is at a make-or-break point, and the direction it takes from here will set the tone for the coming weeks. Whether it experiences a healthy correction or an explosive rally depends entirely on how market participants respond at these critical price levels.
BTCUSDT Price Action | March 12, 2025BINANCE:BTCUSDT.P is now trying to recover from its 50% daily time frame correction. As per my analysis 79444 is now Buyers interest level to go long with stop loss of 76560 for targets of 83593, 85765 (50% Pullback level in 4 hour time frame).
Note. This is my personal analysis, please do your analysis and take decision for buy or sell with strict risk management. Thanks.
The impact of the decline in Tesla's stock price on the BTCUSDThe change in Tesla's stock price has an impact on BTCUSD, mainly in the following aspects:
Investor sentiment transmission: As a highly influential listed company, a significant drop in Tesla's stock price will undermine investors' confidence in technology and innovative assets. This negative sentiment may spread to the cryptocurrency market, causing investors to lose confidence in investing in Bitcoin. Consequently, they may sell off Bitcoin, leading to a decline in the price of BTCUSD. For example, on March 10, 2025, Tesla's stock price plummeted by more than 15%, closing at $222.15, marking its worst single-day performance since 2020. During the same period, the price of Bitcoin also saw a significant drop.
Fund flow transfer: When Tesla's stock price drops, investors may withdraw funds from Tesla stocks and related investment portfolios to seek other more attractive investment opportunities. If there are no obvious other investment targets with high returns and low risks in the market, some funds may flow into the cryptocurrency market, such as Bitcoin, pushing up the price of BTCUSD. However, if the overall market risk appetite decreases, funds are more likely to flow into traditional safe-haven assets, such as gold and bonds, rather than Bitcoin, resulting in a decline in the price of Bitcoin.
BTCUSD sell @84000-84500
tp: 78500-78000
BTCUSD Buy @78000-78500
tp: 82000-82500
Traders, if you liked this idea or if you have your own opinion about it, write in the comments. I will be glad
If you also aspire to achieve financial freedom,Follow the link below to get my daily strategy updates
BTC/USDT 1H: Bullish Breakout Retest – Targeting $89K?BTC/USDT 1H: Bullish Breakout Retest – Targeting GETTEX:89K ?
🚀 Follow me on TradingView if you respect our charts! 📈 Daily updates!
Current Market Structure (Confidence Level: 8/10):
Bullish trend confirmed after breaking the Fair Value Gap (FVG) at $83,200.
RSI shows strong momentum, with a bullish divergence from recent lows, supporting further upside.
Smart Money Analysis:
Accumulation phase evident between $77K - $78K, confirming institutional positioning.
Multiple bullish order blocks formed, reinforcing higher-low structure.
RSI confirms institutional buying pressure, with momentum favoring continuation.
Trade Setup:
Entry: $83,200 - $83,400 (current retest of breakout).
Targets:
T1: $86,400 (previous high).
T2: $89,000 (major resistance).
Stop Loss: $82,000 (below recent swing low).
Risk Score:
7/10 – Favorable risk-to-reward, but market volatility must be considered.
Key Levels:
Support: $82,000, $80,500.
Resistance: $86,400, $89,000.
Market Maker Activity:
Currently engineering a liquidity grab above $84K, likely before a continued move higher.
Volume profile supports bullish continuation, with Smart Money positioning for another leg up.
Recommendation:
Long positions remain favorable on the $83,200 - $83,400 retest.
Watch for price reaction at $84K, as liquidity may be grabbed before a strong move to targets.
🚀 Follow me on TradingView if you respect our charts! 📈 Daily updates!
Cold thinking on Bitcoin's "pullback moment"This morning, Bitcoin prices fluctuated again, falling below the $77,000 mark and currently fluctuating around $80,000. The market seems to have entered the "pullback moment" again. Faced with price fluctuations, I believe many friends are thinking about the same question:
Is it "getting off the train to avoid risks" or "entering the market at a low point" now?
This question seems simple, but it is actually complicated. Especially in the cryptocurrency market, short-term fluctuations are drastic, and various information noises are intertwined, which can easily make people lose their way. When we are in the "pullback moment", we need a calm thinking, and we should take our eyes off the price fluctuations in front of us and put them into the larger "trend" and "cycle" framework to examine.
Let's take a closer look at what a trend is and what a cycle is.
1. What are trends and cycles?
To understand any market, we should first distinguish between the two key concepts of "trend" and "cycle", and the crypto market is no exception.
Trend: Trend is the long-term direction of the development of things and a grand and lasting force. It represents the most essential and core trend of things, just like a surging river, once formed, it is difficult to reverse.
Cycle: The cycle is the short-term fluctuation in the development of things, and it is the rhythmic change of swinging around the trend line.
Simply put, the cycle is in the trend. However, simple inclusion is not enough to express the complex relationship between them. If the "trend" is compared to the trunk of a tree, the "cycle" is like the rings on the trunk.
When 96% of the world's population does not yet hold Bitcoin, when sovereign funds begin to include crypto assets in their balance sheets, and when blockchain technology becomes a new battlefield for the game between major powers - this galloping "digital ark" has just sailed out of the dock where it was built. COINBASE:BTCUSD BITSTAMP:BTCUSD BYBIT:BTCUSDT.P PEPPERSTONE:XAUUSD BINANCE:BTCUSDT
BTC/USD (1D) Technical Analysis – March 10, 2025Today, the lowest bitcoin 79201, the highest 84088, the current sharp decline, short-term consideration to buy around 79000, to 81500 sold
BTCUSD Buy @79000-79500
tp: 81500-82000
Traders, if you liked this idea or if you have your own opinion about it, write in the comments. I will be glad
If you also aspire to achieve financial freedom,Follow the link below to get my daily strategy updates
Tips to make a profit of 5000+ on BTCUSDShort-term accurate signal analysis shows support near 76300. The current price rebounded to a maximum of 82000, with a profit margin of 5000+. The current price has rebounded to a maximum of 82,000, and the profit margin has reached 5,000+. There is no chance or luck in the transaction, and only strength can lead to victory.
If you don’t know when to buy or sell, please pay close attention to the real-time signal release of the trading center or leave me a message, so that you can quickly realize the joy of profit. COINBASE:BTCUSD BITSTAMP:BTCUSD BYBIT:BTCUSDT.P BINANCE:BTCUSDT
BTCToday's strategyShort - term Trend
Recently, the price of Bitcoin has been fluctuating significantly. On March 11, it rebounded from the oversold area but struggled to rise when facing the resistance level. If the bulls can continue to exert force and break through the current resistance level of $80,375.59, it may further climb to $84,119.82. If it fails to break through, it may decline again and even fall below the key support level of $76,605.75.
Long - term Trend
From a long - term perspective, since its inception, Bitcoin has generally shown an upward - trending price, despite experiencing several significant pullbacks on the way. Some financial institutions and experts are also optimistic about the long - term value of Bitcoin. For example, Standard Chartered Bank predicts that Bitcoin could reach $500,000 by 2028.
Market Sentiment and Capital Flow Analysis
Market Sentiment
Investors' attitudes towards Bitcoin are divided. On one hand, companies like MicroStrategy continue to increase their Bitcoin purchases, demonstrating the firm confidence of some investors in its long - term value. On the other hand, the market's sharp fluctuations have also made some investors worried and cautious, remaining on the sidelines.
Yesterday, I bought near 79,000, and then the lowest fell near 76500, and then increased the position at 77000, and now sell at 81500, waiting for the next buy point
BTCUSD sell @81500-82000
tp: 78000-78500
BTCUSD Buy @77500-78000
tp: 81500-82000
Traders, if you liked this idea or if you have your own opinion about it, write in the comments. I will be glad
If you also aspire to achieve financial freedom,Follow the link below to get my daily strategy updates
Heikin Ashi Trade IdeaCOINBASE:BTCUSD
In this video, I’ll be sharing my analysis of BTCUSD, using my unique Heikin Ashi strategy. I’ll walk you through the reasoning behind my trade setup and highlight key areas where I’m anticipating potential opportunities.
I’m always happy to receive any feedback.
Like, share and comment! ❤️
Thank you for watching my videos! 🙏


