BTC Era, continue to create new ATH💎 BTC WEEKLY PLAN UPDATE (14 July )
NOTABLE NEWS ABOUT BTC
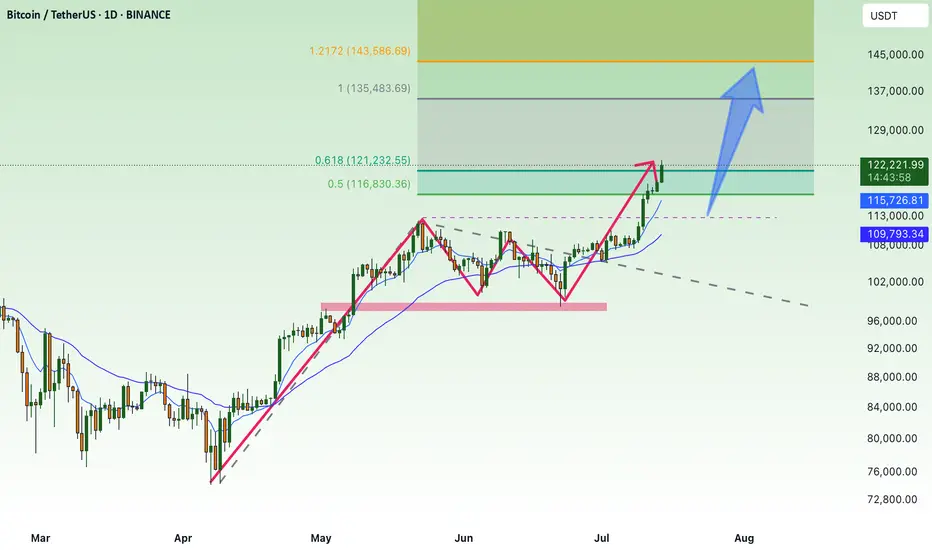
Bitcoin (BTC) broke above a key milestone on Friday, setting a new all-time high of $119,999 with no signs of slowing down. The technical outlook supports further gains as momentum indicators remain strong and price action is solidly in price discovery mode, with the next potential target at $135.000
Bitcoin’s Next Stop: $135.000
Bitcoin entered price discovery on July 9, and since then, the king of cryptocurrencies has surged toward the $120,000 target—a key psychological level for traders. Early Monday during the Asian session, BTC climbed to a peak of $119,999, marking a new all-time high and the closest the asset has come to this milestone.
TECHNICAL ANALYSIS PERSPECTIVE
Two key momentum indicators on the daily timeframe signal underlying bullish momentum in Bitcoin, suggesting a potential for further upside. The Relative Strength Index (RSI) reads 76, and the Moving Average Convergence Divergence (MACD) is flashing green histogram bars above the neutral line.
However, if BTC undergoes a correction, it may extend its pullback to find support near the lower boundary of the Fair Value Gap (FVG) around $115,222.
Derivatives market data shows that $76 million was liquidated over the past 24 hours as BTC surged toward its new high. The long/short ratio, which is considered an indicator of bullish or bearish trader sentiment, is above 1—indicating that more derivative traders are optimistic about Bitcoin and are expecting further gains in the king of cryptocurrencies.
Stay tuned to the channel for updates.
Btcusdbuy
BTC: Next price Halving 📊Analysis by AhmadArz: #BTCUSD
By calculating the price growth in the 4-year halving time frame, we came to the conclusion that with the growth of the Bitcoin market cap, its growth will be halved and we can expect $120,000 from Bitcoin, and it is expected to grow up to 270,000 dollars in halvings.
🔗"Uncover new opportunities in the world of cryptocurrencies with AhmadArz.
💡Join us on TradingView and expand your investment knowledge with our five years of experience in financial markets."
🚀Please boost and💬 comment to share your thoughts with us!

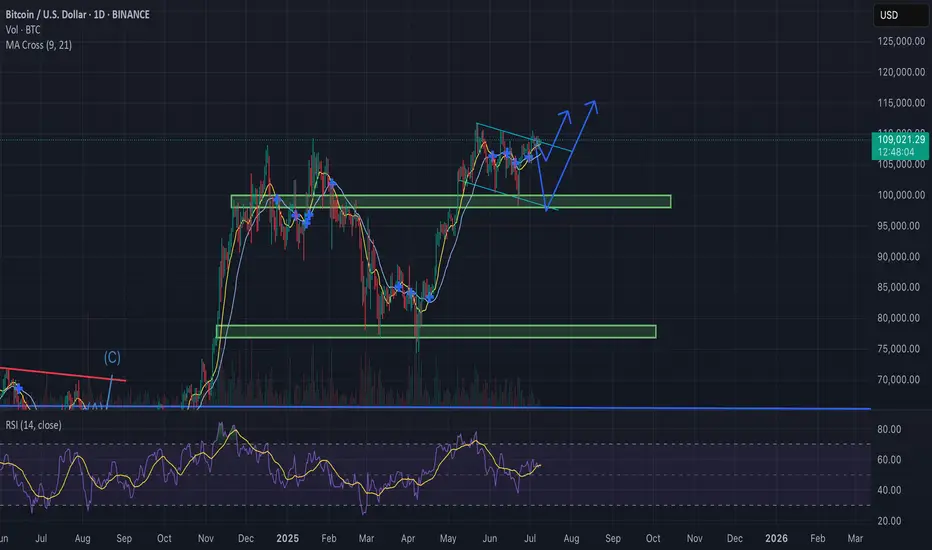
BTCUSD Chart Analysis (Daily Timeframe)Chart Analysis – BTC/USD (Daily Timeframe)
Trend Overview:
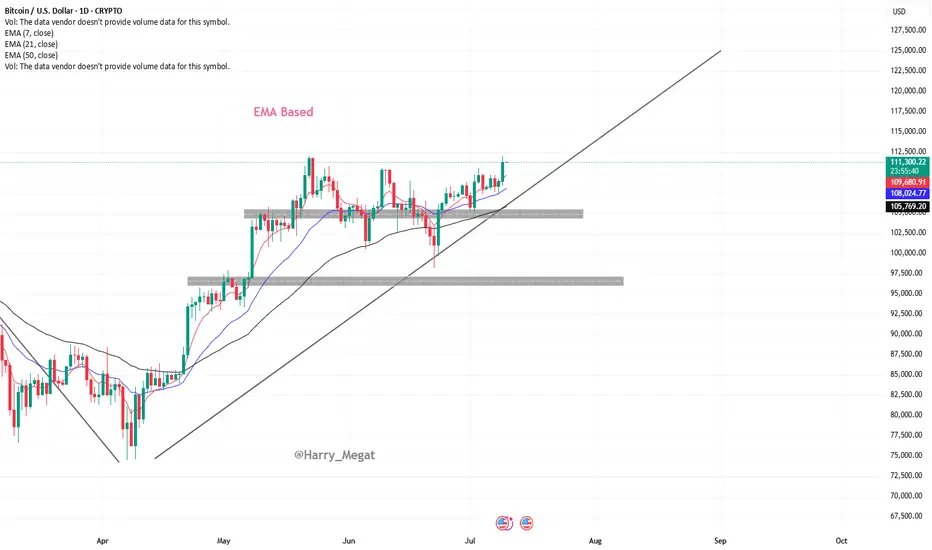
* The chart shows **Bitcoin (BTC/USD)** on the **daily timeframe**.
* Price is in a **clear uptrend**, making **higher highs and higher lows**.
* The recent breakout above **\$111,000** suggests a **bullish continuation**.
Moving Average Analysis (EMA 7, 21, 50):
* **EMA 7 > EMA 21 > EMA 50** — this alignment confirms **strong bullish momentum**.
* Price is **well above all EMAs**, especially the 50 EMA (\~\$105,546), showing trend strength and possible institutional support.
* EMAs are **sloping upward**, which further confirms the upward momentum.
Recent Breakout:
* BTC broke out of a **short-term consolidation zone** between \~\$108,000–\$111,000.
* Today’s candle shows a **strong bullish close**, indicating fresh buying interest.
* If this breakout holds, price could extend toward the **next psychological level of \$115,000–\$117,500**.
Support Zones to Watch:
* **Minor support:** \~\$109,000 (EMA 7 + breakout retest area)
* **Stronger support:** \~\$105,500 (EMA 50 and previous swing low)
A break below **\$105,500** could signal a trend shift or deeper pullback.
Summary:
Bitcoin is showing **strong bullish structure** on the daily chart with EMAs aligned upward and a recent breakout above \$111,000. If momentum holds, next upside targets are around **\$115,000–\$117,500**. The bullish trend remains intact unless price breaks and closes below **\$105,500**.
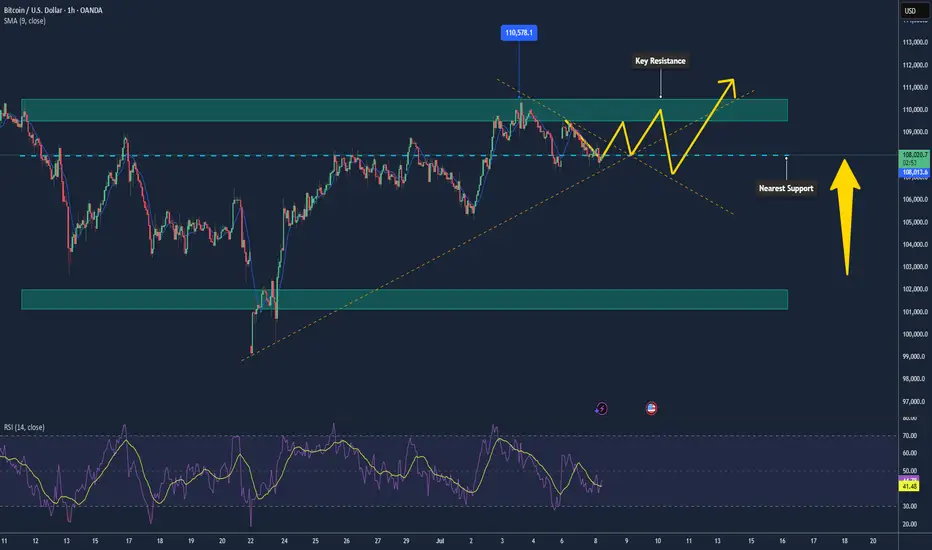
Bitcoin May Continue Rising After Breakout📊 Market Overview:
• Bitcoin recently broke above $118,000, reaching a weekly high of $118,740, fueled by expectations of a Fed rate cut in September and strong ETF inflows into the market
• Katie Stockton from Fairlead Strategies highlights a bullish cup-and-handle pattern, supporting a potential 14% upside toward $134,500
📉 Technical Analysis:
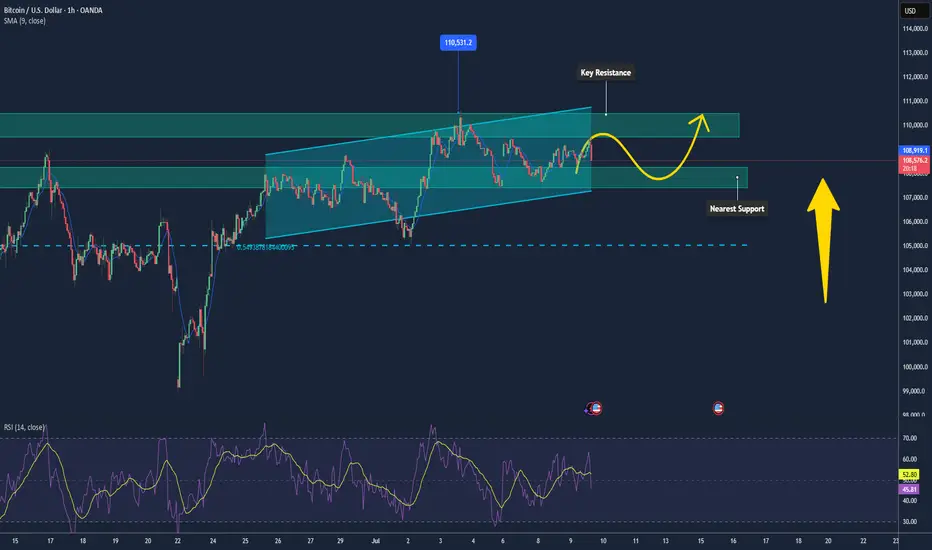
• Key Resistance: $120,000 – $128,500 (based on Fibonacci projection).
• Nearest Support: ~$108,300 – previous resistance turned support, along with ~$107,000 near the 50-day EMA.
• EMA 09: Price is trading above the 9-day EMA, indicating a short-term bullish trend.
• Patterns & Volume:
o A cup-and-handle breakout suggests continued upside potential.
o Rising volume on breakouts reflects strong buying interest.
o MACD is bullish, and RSI is not yet overbought — allowing further room to rise.
📌 Outlook:
Bitcoin may continue to rise in the short term if it holds above the 9-day EMA and avoids a sharp drop below the $108k–110k support zone. A break below this area could trigger a deeper correction toward $100k.

BTCUSDTWait for breaked ATH for 115K target.
BINANCE:BTCUSDT.P
Now price is in two level trading renge but come entry volume of buyers.


#BTC/USDT Bitcoin Recovers Above 108,000 $#BTC
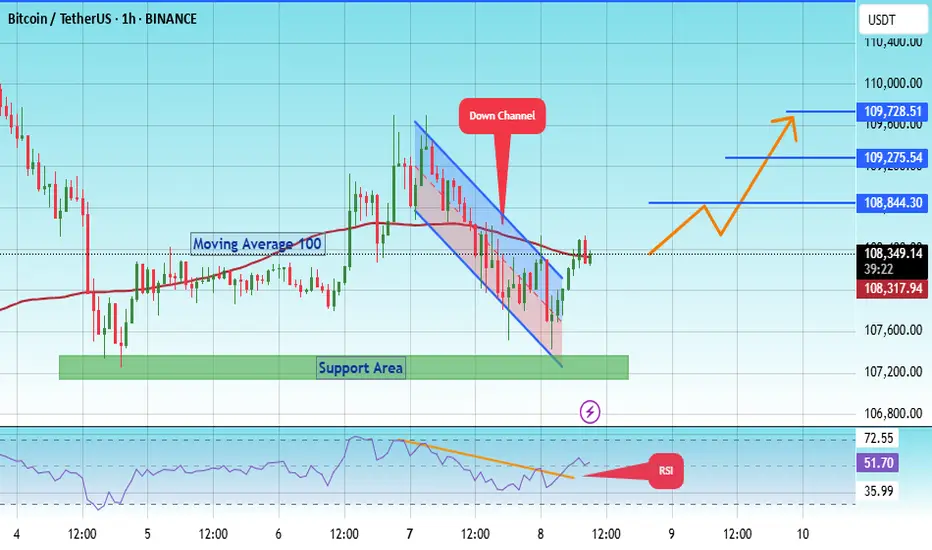
The price is moving within a descending channel on the 1-hour frame, adhering well to it, and is on its way to breaking it strongly upwards and retesting it.
We are seeing a bounce from the lower boundary of the descending channel. This support is at 107600.
We have a downtrend on the RSI indicator that is about to break and retest, supporting the upside.
There is a major support area in green at 107217, which represents a strong basis for the upside.
Don't forget a simple thing: ease and capital.
When you reach the first target, save some money and then change your stop-loss order to an entry order.
For inquiries, please leave a comment.
We are looking to hold above the Moving Average 100.
Entry price: 108337.
First target: 108844.
Second target: 109275.
Third target: 109728.
Don't forget a simple thing: ease and capital.
When you reach the first target, save some money and then change your stop-loss order to an entry order.
For inquiries, please leave a comment.
Thank you.
Prepare for the 2025 Crypto Summer as Bitcoin Shatters RecordBitcoin Experiences Impact of a $12B Short Squeeze: Here is How to Prepare for Imminent Crypto Summer
July 12, 2025 - The digital asset landscape has been irrevocably altered. In a move that will be etched into financial history, Bitcoin has shattered its previous all-time highs, surging with a ferocity that has left bears in utter ruin and bulls in a state of euphoric disbelief. After decisively breaking the formidable $109,000 barrier, the world’s premier cryptocurrency rocketed past $118,000, liquidating an estimated $12 billion in leveraged short positions in a cascade of forced buy-ins that added jet fuel to an already roaring fire.
This is not just another bull run. This is the manifestation of a market that has fundamentally matured. The "Crypto Summer" of 2025, long whispered about in investor circles, has arrived, and it is being majorly fueled by an unprecedented influx of institutional capital and a newly established clear regulatory outlook. While the price charts paint a picture of blistering gains, the underlying story is one of a structural shift in the global financial order.
For those who have watched from the sidelines, the question is no longer if they should pay attention, but how they can possibly prepare for the seismic shifts to come. This article will dissect the anatomy of this historic market event, explore the powerful forces driving this new paradigm, and offer a guide to navigating the thrilling, albeit treacherous, terrain of the 2025 Crypto Summer.
Part 1: The Anatomy of a $12 Billion Cataclysm
To comprehend the sheer violence of Bitcoin's recent ascent, one must first understand the market dynamics that preceded it. A short squeeze is a market phenomenon that occurs when a heavily shorted asset experiences a rapid price increase. This forces traders who bet on a price drop (short sellers) to buy back the asset to cover their positions and cut their losses. This sudden surge in buying demand creates a feedback loop, pushing the price even higher and liquidating more short positions along the way.
In the weeks leading up to the breakout, a palpable sense of bearishness had settled among many derivative traders. They saw the price range between $100,000 and $110,000 as a formidable distribution zone—a ceiling where bulls would run out of steam. Emboldened by this conviction, they began to build massive short positions. It's estimated that prior to Bitcoin’s bullish breakout above $109k, short traders had accumulated around $12B in leveraged positions, with many of these bets entered around the $118k level, anticipating a strong rejection from that point.
The trap was set. But it was the bears, not the bulls, who were about to be caught.
The initial catalyst was the clean break above the $109,000 resistance. This was followed by a swift move above a key bearish trend line that had formed on shorter timeframes, with resistance at $111,000. As the price then confidently reclaimed the $112,500 zone and began trading above the 100-hourly Simple Moving Average, the first wave of liquidations began.
What followed was a textbook short squeeze of epic proportions. As automated margin calls were triggered, computer algorithms began to market-buy Bitcoin at any price to close the losing short positions. This forced buying pressure propelled BTC through $113,000, then $114,000, and $115,000 in what felt like mere moments. The higher the price went, the more short sellers were forced to capitulate. The $12 billion in leveraged positions, once a wall of sell-side pressure, became a colossal wave of buy-side demand. The price action culminated in a spectacular surge past $116,000 and eventually screaming past $118,800, leaving market commentators and traders alike breathless. This event was a brutal lesson in the inherent risks of shorting a structurally bullish asset in a high-leverage environment.
Part 2: A New Paradigm: Institutional Capital and Regulatory Clarity
While the short squeeze provided the explosive catalyst, the true engine of this bull market is fundamentally different from those of the past. The frenzied, retail-driven manias of 2017 and 2021 have been replaced by a more deliberate, capital-heavy, and institutionally-led advance. The "Crypto Summer" of 2025 is built on the bedrock of legitimacy that only Wall Street and a clear regulatory stance could provide.
The ETF Revolution Matures
The launch of spot Bitcoin ETFs in early 2024 was a watershed moment, but 2025 is the year their impact has become undeniably dominant. These regulated financial products have provided a secure and familiar bridge for institutional investors, hedge funds, and even sovereign wealth funds to gain exposure to Bitcoin. The results have been staggering. In a clear sign of a changing of the guard in the world of alternative assets, spot Bitcoin ETFs have captured an astonishing 70% of gold’s inflows in 2025.
This statistic is more than just a headline; it represents the tangible manifestation of the "digital gold" narrative. For years, proponents have argued that Bitcoin's provable scarcity and decentralized nature make it a superior store of value to the yellow metal. Now, the flow of funds from the world's largest asset managers is proving this thesis correct. BlackRock’s IBIT, in particular, has shattered ETF records, becoming one of the fastest-growing funds in history and signaling to the entire financial establishment that Bitcoin is no longer a fringe asset but a core portfolio component.
The Certainty of Regulation
For years, the spectre of regulatory uncertainty has cast a long shadow over the crypto markets, deterring conservative institutional players. A key driver of the 2025 bull market has been the emergence of a clear regulatory outlook in major jurisdictions like the United States and Europe. With comprehensive market structure bills passed, clear guidelines on custody, and a defined tax framework, the biggest obstacle for institutional adoption has been removed.
This regulatory clarity has done more than just open the floodgates for capital; it has legitimized the entire asset class. Institutions operate on long-term horizons and require predictable rules of engagement. With these in place, they are no longer making a speculative bet but a strategic allocation to a new, globally recognized asset class. This influx of what is often called "stickier" capital—long-term investment rather than short-term speculation—is helping to build a more stable market foundation and reduce some of the notorious volatility associated with Bitcoin.
Part 3: Reading the Charts and Chains
The story of this bull run is written not only in the headlines but also in the data. A confluence of technical chart patterns, on-chain analytics, and market sentiment indicators paints a uniquely bullish picture, suggesting that this rally may have much further to run.
Technical Analysis: Echoes of the Past, Pointers to the Future
For seasoned market observers, the BTC price action in 2025 has mirrored the 2017 macro bullish breakout. The fractal nature of Bitcoin's four-year cycles, often centered around its programmatic "halving" events, appears to be playing out once again. The structure of the consolidation below $100,000 and the subsequent explosive breakout bears a striking resemblance to the patterns that preceded the parabolic run to $20,000 in 2017.
On a more granular level, the price has decisively conquered several key technical levels. The break above the bearish trend line at $111,000 was a critical signal that the downtrend pressure had been absorbed. Now, with the price trading firmly above $113,500 and the 100-hourly Simple Moving Average, these former resistance zones are expected to act as strong support levels for any potential pullbacks. The next major hurdle appears to be the $116,800 resistance zone, a level that, if cleared, could open the door to a much larger upward expansion.
Perhaps the most tantalizing model for predicting the cycle top is the Bitcoin "power law" model. This model suggests that Bitcoin's price growth over time follows a predictable exponential path when plotted on a logarithmic scale. Developed by analyst Giovanni Santostasi, the model views Bitcoin's long-term growth not as a random walk but as a structured, measurable trajectory akin to natural growth phenomena. According to analysts applying this model, Bitcoin is currently trading ahead of its long-term power law curve. Historically, this has been a sign that the market is entering the final, euphoric phase of its bull cycle. Based on this model, some analysts believe a Bitcoin Christmas rally to $200K or even $300K is possible, with the parabolic rally potentially lasting until the end of the year.
On-Chain Analysis: A Supply Shock in the Making
On-chain analysis, which involves examining data directly from the blockchain, provides a transparent view of investor behavior. One of the most encouraging signs for this rally is that Bitcoin Supply On Exchanges Remain Low Amid Latest Milestone. When investors move their BTC off exchanges, it is typically to place them in secure, self-custody wallets for long-term holding. This reduces the immediately available supply that can be sold on the market, creating a "supply shock" dynamic where even a small increase in demand can have an outsized impact on price. The current trend indicates that new institutional buyers and long-term believers are accumulating coins and have no intention of selling at current prices.
Further bolstering the bullish case is the metric of profitability. The market has reached a point where Bitcoin has broken records with 100% profitable days and unmatched returns. This means that for a vast majority of its history, buying and holding Bitcoin has been a profitable endeavor, reinforcing its narrative as one of an incredibly successful long-term asset.
However, a note of caution comes from on-chain analytics firm Glassnode, which warns that despite the breakout to over $118,000, liquidity is still thin. This means the order books on exchanges are not particularly deep. While this can amplify moves to the upside, it also means that a large sell order could cause a sharp and swift correction. This thin liquidity explains the continued volatility and serves as a reminder that the market, while more mature, is still susceptible to violent price swings.
Sentiment Analysis: A Rally Without the Mania
Perhaps the most compelling argument for further upside potential is what is absent from this rally: hype. In previous cycle tops, the market was characterized by a palpable mania. Bitcoin dominated mainstream news, celebrity endorsements were rampant, and stories of overnight crypto millionaires were inescapable.
This time is different. In a sign that suggests significant further upside potential, the current Bitcoin All-Time High Lacks Hype. Google Trends for "Bitcoin" are not at their peak, social media is not yet in a state of collective FOMO (Fear Of Missing Out), and the general public is not yet clamoring to get in. This suggests that the rally so far has been driven by the "smart money" of institutions. The retail-driven "mania phase," which typically marks the final blow-off top of a bull cycle, has not yet begun. This quiet confidence, devoid of irrational exuberance, is seen by many analysts as one of the healthiest indicators for the market's future.
Part 4: The Macroeconomic Tailwinds
A key factor is the falling dollar and anticipated Federal Reserve interest rate cuts. The US Dollar Index (DXY), which measures the greenback against a basket of foreign currencies, has been in a significant downtrend throughout 2025, hitting its lowest levels in over two decades relative to its moving averages. There is a historically strong inverse correlation between the DXY and Bitcoin; a weaker dollar makes assets priced in dollars, like BTC, more attractive to foreign investors and also pushes domestic investors to seek hedges against currency debasement.
Furthermore, the anticipation of interest rate cuts by the Federal Reserve to stimulate a slowing economy makes holding cash and low-yielding government bonds less attractive. This monetary policy shift encourages a "risk-on" environment, where capital flows out of safe-haven assets and into those with higher growth potential. As the ultimate digital risk-on asset, Bitcoin stands as a major beneficiary of this capital rotation.
The magnitude of this rally has also had fascinating side effects, such as the fact that the Bitcoin Surge Pushes Satoshi Nakamoto Into Global Top 15 Rich List. Based on the estimated 1.1 million BTC held by Bitcoin's pseudonymous creator, the recent price surge would place their net worth among the wealthiest individuals on the planet—a testament to the incredible value creation of this new technology.
Part 5: How to Prepare for the Imminent Crypto Summer
With a potential parabolic rally to $200,000 or $300,000 on the horizon, the central question for every investor is how to position themselves. The answer depends heavily on one's experience and risk tolerance. (This section is for informational purposes and should not be construed as financial advice).
For the Newcomer:
1. Education Before Allocation: Before investing a single dollar, take the time to understand what Bitcoin is. Learn about its core principles of decentralization, scarcity, and self-custody. Do not simply buy based on FOMO.
2. Dollar-Cost Averaging (DCA): Entering a market that is already in a parabolic uptrend can be risky. DCA involves investing a fixed amount of money at regular intervals, regardless of the price. This strategy reduces the risk of buying the top and smooths out your average entry price over time.
3. ETFs vs. Self-Custody: For the first time, investors have a simple choice. Buying a spot Bitcoin ETF through a traditional brokerage account is easy and secure. However, the core ethos of Bitcoin is self-sovereignty ("not your keys, not your coins"). Learning to use a hardware wallet to take self-custody of your coins is the ultimate way to embrace the technology, but it comes with greater personal responsibility.
For the Experienced Investor:
1. Prudent Risk Management: The warning of thin liquidity should be heeded. Volatility will remain high. Use stop-losses to protect capital, avoid excessive leverage, and do not get caught up in the euphoria. Have a clear plan for both entry and exit points.
2. Develop a Profit-Taking Strategy: No asset goes up forever. It is crucial to have a plan for taking profits. This could involve selling a certain percentage of your holdings at pre-determined price targets (e.g., $150k, $200k, $250k) or using technical indicators to signal a potential market top.
3. Look Beyond Bitcoin: Historically, a major Bitcoin rally paves the way for a subsequent "alt-season." As Bitcoin's dominance peaks, capital often rotates into Ethereum and other alternative cryptocurrencies with strong fundamentals, leading to explosive gains in those assets. Researching promising projects now could position you for the next phase of the crypto summer.
Finally, it is essential to address the question: Breakout Or Brutal Bull Trap? While all signs point to a sustained, institutionally-backed bull market, the risk of sharp corrections remains. Parabolic advances are often followed by equally dramatic pullbacks. The thin liquidity could exacerbate such a move. Staying grounded, managing risk, and sticking to a well-defined plan are the keys to surviving and thriving.
Conclusion
The Bitcoin story of 2025 is a symphony of powerful forces playing in perfect harmony. The violent crescendo of a $12 billion short squeeze announced its arrival, but the enduring melody is one of profound structural change. The unwavering commitment of institutional capital, flowing through newly approved and highly successful ETFs, has provided a stable and deep foundation for the market. This, combined with a clear regulatory framework and supportive macroeconomic tailwinds from a weakening dollar, has created the conditions for a historic "Crypto Summer."
Unlike the retail-driven manias of the past, this rally is characterized by a quiet confidence, a lack of widespread hype, and on-chain data that points to a severe supply shock. Models like the power law suggest that the journey is far from over, with potential targets that would have seemed fantastical just a year ago.
The road ahead will undoubtedly be volatile. But for those who understand the underlying dynamics at play—the institutional shift, the market structure, the on-chain truths—the path to navigating this new era is clear. The summer has just begun.

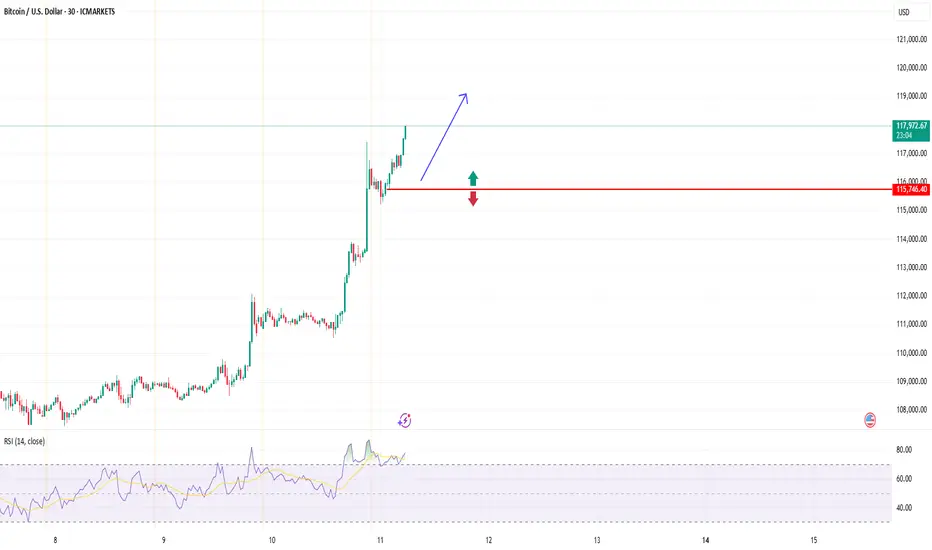
BTCUSD (Bitcoin): Forex Technical AnalysisDate: 11 July 2025
Momentum: Up
First Scenario : long positions above 115,706.14 with targets at 117,269.52, 117,904.51 and 118,513.05
Second Scenario : short positions below 115,706.14 with targets at 114,544.35, 113,774.89 and 113,053.39
Comment: RSI - Bullish.
Supports and resistances :
118,513.05 **
117,904.51 *
117,269.52
116,747.25 - Last price
114,544.35
113,774.89 *
113,053.39 **
Bitcoin ATHBINANCE:BTCUSDT This is amazing for crypto community because this level-up all of lover crypto currencies.
Next target: 120.000K
Best for pollback levels: 111.000K & 105.500K
👓We are this time keep calms emotional in buy or sell.

BTC Leg2 115KBINANCE:BTCUSDT major movement from base 98K S to 106K $.BTC want to next movement to 115K $ but in middle of way 110K $ level there are sellers.
Support: 106.000 - 102.000
Resistance: 110.400 - 115.000
⚠️Control Risk Management

Bitcoin Maintaining Mild Uptrend, Poised Toward $110k📊 Market Overview:
• Strong ETF inflows continue, with over $13.5 billion in YTD flows into BTC, now making up nearly 70% of gold ETF inflows.
• Institutional investors like BlackRock (IBIT currently holds ~700k BTC) are still accumulating. The U.S. is also building a “Strategic Bitcoin Reserve,” reinforcing long-term confidence.
📉 Technical Analysis:
• Key Resistance: $109,000–$110,000, opening the path toward $110,500–$110,600 (Supertrend around $110,174).
• Nearest Support: $108,300 (EMA), followed by $107,800–$108,000; deeper pullback support at $105,000.
• EMA 09: Price is above this EMA → short-term trend remains bullish.
• Candlestick/Volume/Momentum: RSI is neutral around 58; MACD is converging near the zero line, signaling weakening bearish momentum and possible base formation.
📌 Outlook:
Bitcoin may continue its mild upward movement if it holds above $108,300–$108,000 and breaks clearly above $109k–110k with strong volume. Failure to do so could trigger a pullback toward $107,000–$108,000.
💡 Suggested Trading Strategy:
📉 SELL BTC/USD at: 109,500–110,000
🎯 TP: 108,000
❌ SL: 110,400
📈 BUY BTC/USD at: 108,200–108,500
🎯 TP: 109,500–110,000
❌ SL: 107,800
BTCUSD BULLISH MORE all time high again The price may briefly break above the 113,000–114,000 level (first target) to trap long positions, then sharply reverse.
Support Break Warning:
If BTC fails to hold the 110,000–108,000 support zone, it could accelerate a drop to deeper supports:
Support Area 1: 106,000
Support Area 2: 102,000
Extreme Bearish Target: 96,000–94,000
What to Watch:
Bearish divergence on lower timeframes
Volume drop on new highs = possible fakeout
Candle rejection from 113,000–114,000 zone

BTC Correction's 📉 Significant Bitcoin Correction During Uptrend
After a strong bullish rally, Bitcoin has entered a correction phase, retracing nearly 25% of its recent gains. Interestingly, this correction aligns exactly with the 200-period moving average on the 4-hour chart, marking a potential key support level.
🔍 Is Bitcoin’s Correction Over or Just Beginning?
The overlap with the 200 MA could signal the end of the correction, but if this zone fails to hold, deeper targets between the 35% and 75% retracement levels may come into play.
🛡️ Potential Support Levels for Bitcoin if the Correction Continues:
First support: 102,200 USD – 25% correction
Second support: 93,200 USD – 35% correction
Third support: 84,100 USD – 50% correction
Fourth support: 74,600 USD – 75% correction

Bitcoin on Fire: Targeting $110K in Relentless Uptrend!Hi traders! , Analyzing BTC/USD on the 30 minute timeframe, price is currently respecting an upward channel and showing consistent higher highs and higher lows. The recent bounce from dynamic support suggests bullish continuation.
🔹 Entry: 109,545
🔹 Take Profit (TP): 110,612
🔹 Stop Loss (SL): 108,438
Price is trading above both the 50 and 200 EMA, confirming bullish momentum. The RSI remains above the midline, indicating buyers are still in control. This long setup offers a favorable risk-reward ratio within the context of the broader uptrend.
A confirmed breakout from the short-term resistance, combined with trendline support and channel structure, adds confluence to this idea. Watch for potential resistance near the 110,612 zone.
⚠️ DISCLAIMER: This is not financial advice. Every trader is responsible for their own decisions and risk management.

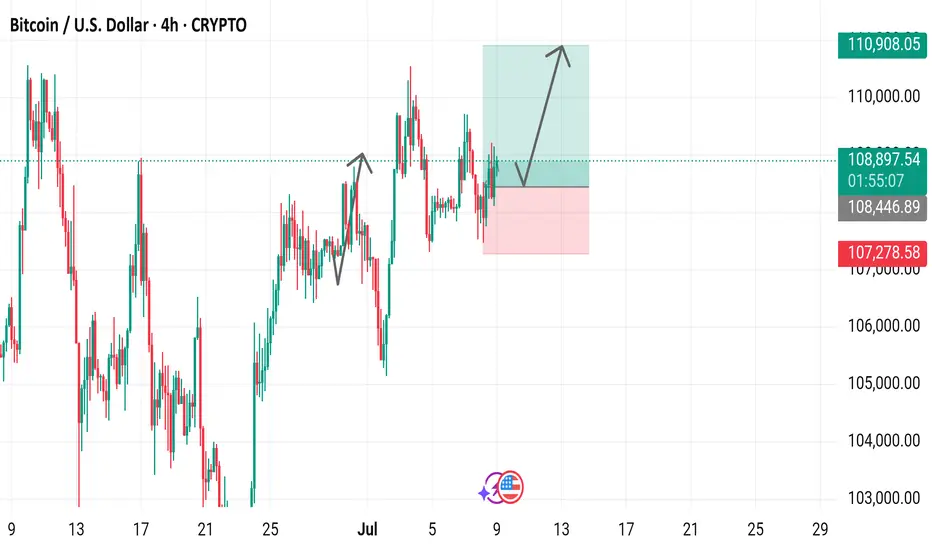
Bitcoin / U.S. Dollar 4-Hour Chart (BTCUSD)4-hour candlestick chart displays the price movement of Bitcoin (BTC) against the U.S. Dollar (USD) from late June to early July 2025. The current price is $108,895.04, with a 24-hour change of +$619.70 (+0.57%). Key levels include a support zone around $107,278.58 and a resistance near $110,908.05. The chart highlights recent price action, including a potential upward trend indicated by a green shaded area, with buy and sell signals marked at $108,895.04.

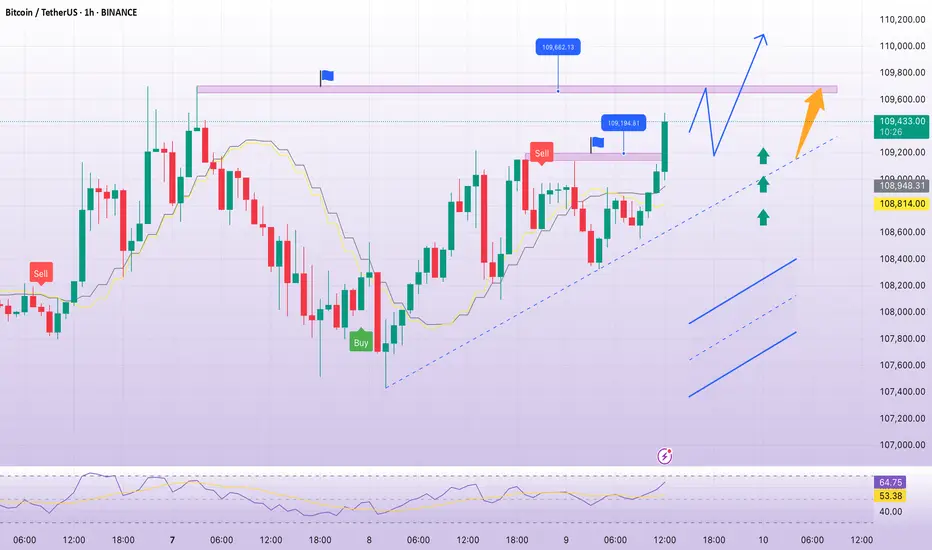
BTC back to 110K, ATH effortPlan BTC today: 09 July 2025
Related Information:!!!
Cryptocurrencies are trading in a volatile environment driven by tariff-related uncertainties ahead of the release of the Federal Reserve's (Fed) Minutes from the June meeting, scheduled for Wednesday. Bitcoin (BTC) continues to exhibit technical weakness, trading below the key resistance level near $109,000. Trading activity in the spot market remains subdued, with K33 Research reporting a 4% decline in weekly volume to $2.1 billion.
Aside from a few selective rallies, as evidenced by Wednesday’s top-performing tokens, most altcoins are underperforming relative to Bitcoin, reflecting limited engagement from the retail segment. Nonetheless, Ethereum (ETH) is showing early signs of a potential upward move after breaking above the former resistance-turned-support level at $2,600. Ripple (XRP), meanwhile, has extended its recovery above $2.33, posting over 1% in intraday gains.
personal opinion:!!!
Continued efforts by the bulls, breaking ATH above the 110,000 price zone. The time is near for the FED to lower interest rates.
Important price zone to consider :!!!
support zone : 109.200
resistance zone : 109.700
Sustainable trading to beat the market
Bitcoin Update – Bullish Falling Wedge in Play?BTC/USD is currently trading near $108.8K, compressing within a falling wedge formation — historically a bullish continuation pattern, especially after a strong uptrend.
Why the Bias Remains Bullish:
Bullish MA Cross: Short-term MAs (9/21) are aligned for upside momentum.
Falling Wedge: Price compressing with lower highs and lows, coiling for a breakout.
RSI Strength: RSI (purple) remains elevated, supporting continued upside pressure.
Fundamental Catalysts:
Trump delays trade war announcements, reducing global uncertainty.
FOMC meeting in late July: Trump pushes for rate cuts, potentially bullish for risk assets like BTC.
If BTC breaks out above the wedge resistance with convincing volume:
Retest likely at ~$110K
Targets : $115K → $120K+
BTC/USD H4 Downfall ⚠️ Disrupted Market Perspective
🟩 False Resistance Zone
The marked resistance area (~109,000) has been breached multiple times with high volatility, suggesting weak resistance strength. Instead of rejecting price, this zone acts more like a liquidity trap — luring in sellers before price spikes higher. Expect fake-outs or bullish traps near this area.
🟨 Questionable Bearish Pattern
The projected zig-zag drop is speculative. The current market structure shows higher lows forming, hinting at potential accumulation rather than breakdown. If price consolidates above 108,000, this setup might flip bullish instead of heading to the 106,000 target.
🟥 Support Area Disruption
The labeled support zone around 106,000 may not hold if broken, but it has been respected multiple times in the past. If bulls defend it again, we might see a sharp rebound rather than a continuation downward. Therefore, the “Target” area could instead become a springboard for upward reversal.
Bitcoin Ranging Below $110k – Poised for a Breakout📊 Market Overview:
Bitcoin is consolidating around $108–109k, reflecting indecision as investors await clearer signals. Institutional ETF inflows remain strong, and recent moves from 2011-era dormant wallets sparked concern but no major sell-off. Positive ETF news or supportive crypto policies could propel the next move upward.
📉 Technical Analysis:
• Major resistance: $109,500 – $110,500
• Nearest support: $108,000; secondary support at $102,000
• EMA09 (1 h): Price is above the 20 EMA and has reclaimed the 200 SMA on the 1 h chart, signaling a technical rebound
• Candlestick / Volume / Momentum: A mild bounce from $108k with low volume; Bollinger Bands show a mid-range price, hinting at sideways action .
📌 Outlook:
Bitcoin may remain range-bound between $108k and $110k. A breakout above $110.5k with strong volume could push toward $112k–115k. Conversely, a break below $108k might trigger a dip toward $102k.
Suggested Trading Strategy
SELL Bitcoin/USD at: 109,000 – 110,000
🎯 TP: 108,000 / 105,000
❌ SL: 110,800
BUY Bitcoin/USD at: 108,000 – 107,500
🎯 TP: 109,500 / 112,000
❌ SL: 107,000
BTC SCALP TRADE / Long Setupwait for the entry, must use SL. If final tp is achieved then trade is not valid, active till final tp. Must use proper risk management. Expecting upside move. If SL hit then take previous trade, It's still valid.

BTC up following H1 trend linePlan BTC today: 07 July 2025
Related Information:!!!
Bitcoin (BTC) trades slightly below $109,000 at the time of writing on Monday, following its highest weekly close on record. Institutional and corporate demand continues to serve as a key catalyst, with Metaplanet acquiring an additional 2,205 BTC on Monday, while US-listed spot Bitcoin Exchange Traded Funds (ETFs) saw over $769 million in net inflows last week.
As market participants assess the latest bullish indicators, focus now shifts to broader macroeconomic developments, including new trade-related headlines and reports suggesting that the administration of US President Donald Trump may extend the current tariff pause until August 1.
personal opinion:!!!
BTC moves sideways in the trend line, trend line support 108,300
Important price zone to consider :!!!
support zone : 108.300
Sustainable trading to beat the market
