Bitcoin / U.S. Dollar 4-Hour Chart - CRYPTO4-hour candlestick chart displays the Bitcoin (BTC) to U.S. Dollar (USD) price movement, currently at $108,252.17 with a 0.21% increase (+$230.82). The chart highlights a recent upward trend with key price levels marked, including a buy price of $108,252.17 and a sell price at the same level. Support and resistance zones are indicated with a pink shaded area around $106,840.43 to $108,252.17 and a green shaded area near $110,084.10. The chart spans from late June to July 7, 2025, with the latest data point at 06:27 PM PKT on July 5, 2025.
Btcusdbuy
$BTC/USDT daily chart $121K next.CRYPTOCAP:BTC just broke out of a descending wedge on the daily chart, a strong bullish signal.
It’s now holding well above key support and the 50-day moving average, showing buyers are in control.
If BTC stays above $106,400, we could see a move toward $121K next.
DYRO, NFA

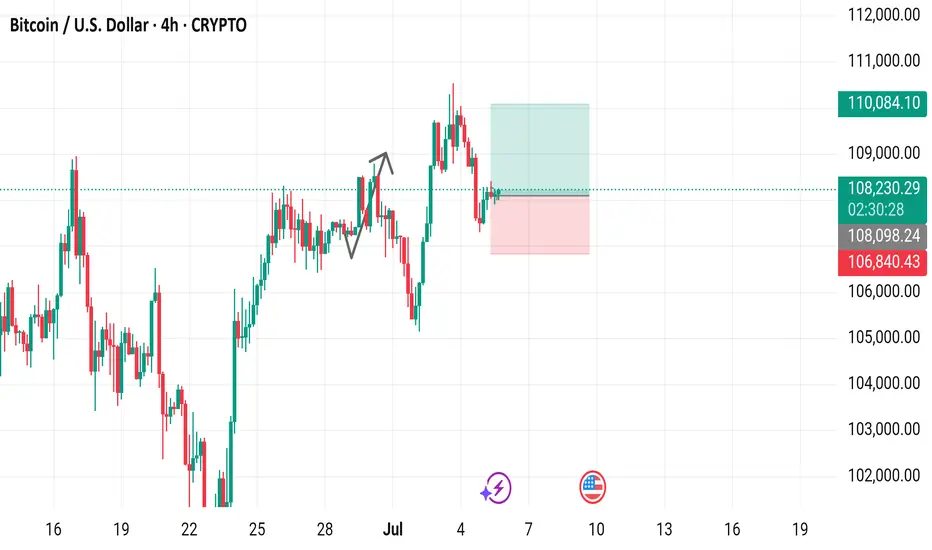
BTC: 650 Point Long Trade To 108,650$ (Date: Sat 05 Jul 25)High potential signal as my all signals. Don't miss this opportunity. At least open a trade in demo just to test.
Details:
Entry: Now - 108,100 $
Target Price: 108,650 $
Stop loss: 107,700 $
Trade Ideas:
There is a flag pattern here after a good down trend. So here is possibility for a small pull back till my target price.
Trade Signal:
I provide trade signals here so follow my account and you can check my previous analysis regarding BITCOIN. So don't miss trade opportunity so follow must.
BINANCE:BTCUSDT BINANCE:BTCUSDT.P BYBIT:BTCUSDT.P

BTC - Channel is Broken, Now What?
We are currently retesting the upper trend line of the channel I gave in this analysis, the most bullish scenario is that it breaks upwards and BTC stages a determined rally. If you cannot catch an entry during this rally, do not worry, we can retest the upper part of the trend again or go to manipulation areas such as green bubbles.

BTC/USD Bullish Reversal Breakout Pattern BTC/USD Bullish Reversal Breakout Pattern 🚀
Technical Analysis:
🔹 Trend Reversal: The chart shows a clear inverse head and shoulders pattern highlighted with orange circles — a strong bullish reversal signal after a downtrend.
🔹 Breakout Zone: The neckline resistance around 108,000 USD has turned into support (marked as “SU00QT” due to a typo, assumed to be “SUPPORT”). Price action is consolidating just above this zone.
🔹 Trendline Support: The upward blue trendline confirms bullish structure, with price forming higher lows. Recent price action is bouncing off this trendline, showing strength.
🔹 Bullish Confirmation: Green arrows indicate strong bullish rejections from key levels, aligning with breakout retests.
🔹 Target Projection: The measured move from the inverse head and shoulders pattern projects a target towards the 114,000 USD resistance zone 📦 highlighted above, suggesting a potential 5-6% upside move 📊.
Conclusion: As long as price holds above the 108,000 support zone and the ascending trendline, BTC/USD remains bullish with potential continuation towards 114,000 USD. A breakout above minor consolidation could trigger a strong bullish rally 💥.
🛑 Invalidation: A sustained break below 106,000 USD would invalidate the bullish structure and may lead to further downside.

BTCUSDT – Accumulation Confirmed? Wyckoff Blueprint Playing Out Bitcoin continues to compress inside a defined range, resting above both a rising trendline and a former resistance turned support zone. This structure fits cleanly within a Wyckoff-style Accumulation Phase (B-C).
We’re now at a critical moment where smart money may be absorbing supply, preparing for the next phase.
🔍 Key Observations:
Range-bound price action with higher lows and muted volume
Spring-like wick and recovery from the bottom of the range
Support holding at prior breakout zone and ascending trendline
Structure shows signs of stealth accumulation with a possible breakout ahead
Sideways movement with fading volatility
Gradual compression within the range
Strong support defended multiple times (might make the support weaker as well !)
A potential spring/retest event may already be in play
You’ll see fakeouts, wicks, and hesitation in this phase — designed to trap weak hands. But the underlying behavior points to preparation, not distribution.
The quiet before the markup. Let the market reveal its hand. 📈

Weekend BTC Trend Analysis and Trading SuggestionsLet's review this afternoon's market performance. The BTC price, as we anticipated, rebounded to around 109,000 in the afternoon before plummeting sharply. Living up to "Black Friday", this violent drop was well within our expectations. In the afternoon's live trading, we also reminded everyone that as long as there was a rebound to the upper zone, it was a good opportunity to go short. This drop has created a space of nearly 1,500 points. Currently, the BTC price has pulled back to around 107,800.
From the current 4-hour K-line chart, after a strong upward surge, the market encountered significant resistance near the upper track of the Bollinger Bands. As bullish momentum gradually faded, the price started to come under pressure and decline, suggesting that the short-term upward trend may come to a temporary halt. At present, the market has recorded multiple consecutive candlesticks with large bearish bodies. The price has not only effectively broken below the key support level of the Bollinger Bands' middle track but also caused the Bollinger Bands channel to switch from expanding to narrowing, indicating that market volatility is decreasing. In terms of trading volume, it showed a moderate increase during the price pullback, which further confirms the authenticity of the bearish selling pressure.
BTCUSD
sell@108000-1085000
tp:107000-106000
Investment itself is not the source of risk; it is only when investment behavior escapes rational control that risks lie in wait. In the trading process, always bear in mind that restraining impulsiveness is the primary criterion for success. I share trading signals daily, and all signals have been accurate without error for a full month. Regardless of your past profits or losses, with my assistance, you have the hope to achieve a breakthrough in your investment.
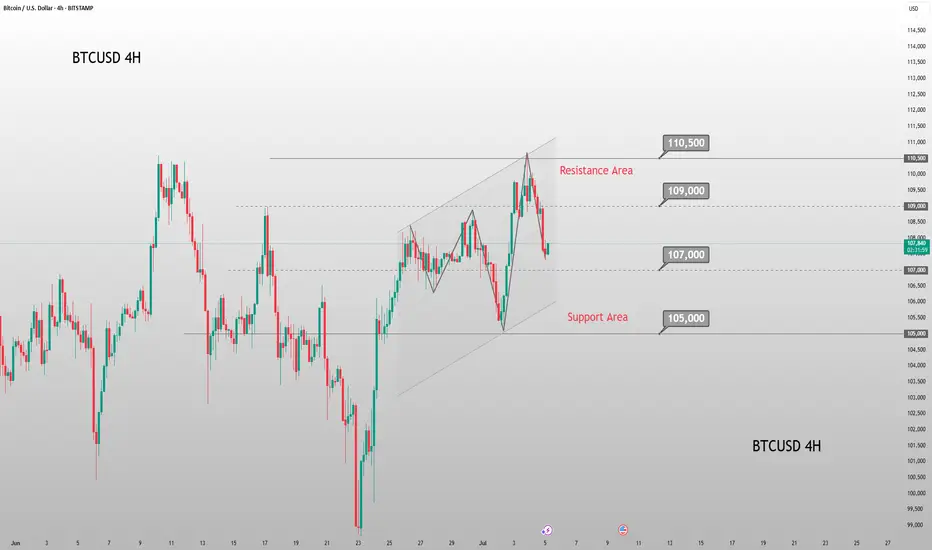
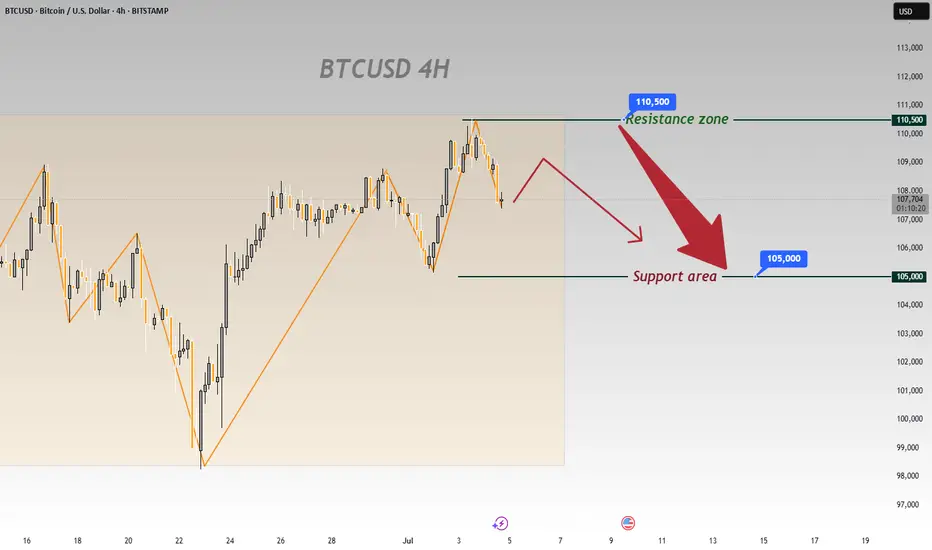
On BTCUSD’s 4 - hour chart, downside risks prevailOn BTCUSD’s 4 - hour chart, downside risks prevail:
Resistance Holds
Price failed to break 110,500, showing strong selling pressure that caps bulls 🚫. A pullback is likely.
Downtrend Signals
Post - resistance, price is retracing. Candlesticks and chart arrows point to a drop toward 105,000 support, fueled by building bearish momentum ⬇️.
Support Test Looms
105,000 is the next key level 🔑. Even if support slows the fall, the setup favors downside—bullish reversals seem unlikely after resistance failure.
Trend Weakness
Orange trendlines show the prior uptrend is fragile 🧊. Failing at 110,500 signals fading bullish force, setting up for a bearish correction.
In short, the 4 - hour chart is bearish. Watch for drops to 105,000; 110,500 will likely block bulls 🛑. Trade cautiously with this bias.
🚀 Sell@108500 - 107500
🚀 TP 106500 - 105500
Accurate signals are updated every day 📈 If you encounter any problems during trading, these signals can serve as your reliable guide 🧭 Feel free to refer to them! I sincerely hope they'll be of great help to you 🌟 👇

BTC SCALP Tradeas long as BTC doesn't closes below the mentioned area on 1hr tf, it will bounce and hit the fresh sellers SL. Once we have a closing below the area it can take correction upto 98-97K area.

$BTC Long Setup. CRYPTOCAP:BTC Long Setup
Price bounced from the key demand zone.
- Entry: CMP
- SL: $108,517
- TP: $110,030
DYOR, NFA

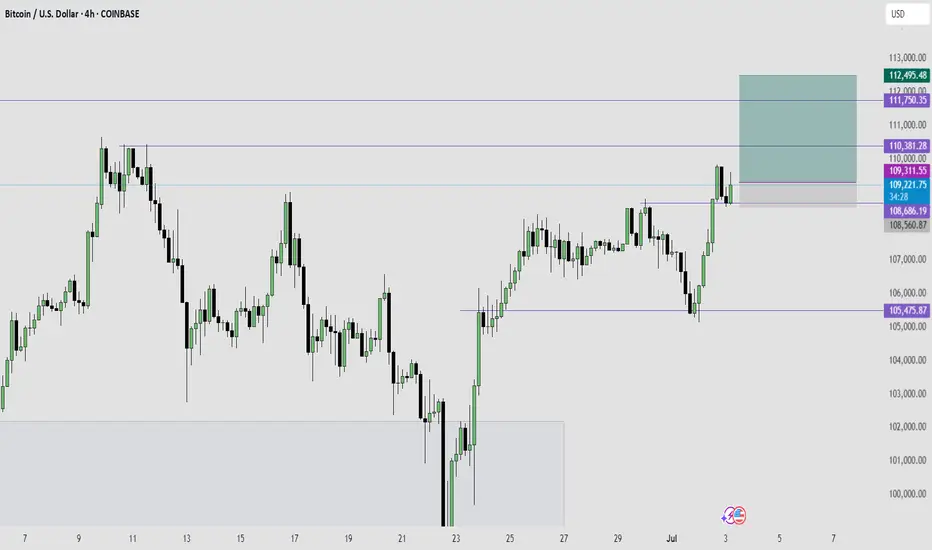
BTC Bulls Target $111,653, Is This the Next Explosive BreakoutThe BTCUSDT 4-hour chart is showing a clearly bullish structure. After consolidating below the $108,664–$107,800 resistance for several weeks, Bitcoin finally broke above this area with a strong impulsive move, confirming the zone as a new support. This breakout coincides with improving market sentiment, especially after Metaplanet’s $108 million purchase of BTC and a surge in ETF inflows, which have been helping Bitcoin reclaim levels above $109,000. The price is currently consolidating just above the breakout area, indicating that buyers are defending this zone aggressively.
Resistance Level 1, around $110,254, is the first significant barrier and aligns with the area that rejected price several times in late May. If this level is broken, the next target sits at Resistance Level 2 near $111,653, which was the major swing high established in early May. Holding above the current support is critical, as a decisive 4-hour close below $107,440 would invalidate this bullish scenario and likely trigger a deeper retracement.
The recent price behavior suggests a potential ascending triangle breakout retest, a classic continuation pattern where buyers step in on each dip. Momentum remains strong, and the risk/reward profile favors long setups as long as the higher-low structure is preserved.
Trade Setup (Bullish Idea)
Entry Zone: $108,700–$109,000 (on a confirmed retest of support)
Stop Loss: $107,440 (beneath the invalidation zone)
Take Profit Targets
o TP1: $110,254
o TP2: $111,653
The setup offers an estimated 2.4–2.7 risk/reward ratio, depending on precise entry and execution. As always, it’s recommended to wait for confirmation candles or wicks rejecting the support zone before entering.
If the breakout holds and volume expands on the push through TP1, Bitcoin could quickly revisit the $112,000 area in line with broader market optimism and institutional buying. Just be aware of the invalidation level, as any breakdown below $107,440 could trigger a fast move back to prior range lows.

Bitcoin Eyes Breakout if Clears $114,000📊 Market Overview:
• Bitcoin trades around $109,350, with an intraday high near $109,610
• Rosenberg Research notes BTC could rally ~6% to clear $114,000, potentially triggering a 25% rise to $143,000 on the back of ETF inflows, a weaker dollar, and Fed rate cut expectations
📉 Technical Analysis:
•Key Resistance: ~$114,000; followed by the psychological $112,000 zone .
•Nearest Support: $107,000 (prior highs/descending channel bottom) and key floor at $100,000
•EMA Levels:
o Price consolidates near 50-day EMA ($105,800), a crucial confluence zone
•Candlestick/Momentum:
o RSI near 50 (neutral),
o Flag pattern breakout suggests continuation potential
📌 Viewpoint:
Bitcoin may extend its rally if it breaks above $114,000, targeting $137,000–$143,000. If rejected, a pullback toward $107,000 is likely before bouncing.
💡 Suggested Trading Strategy
SELL BTC/USD at: $113,500–$114,000
🎯 TP: $110,000–$110,500
❌ SL: $114,500
BUY BTC/USD at: $107,000–$108,000
🎯 TP: $112,000–$113,000
❌ SL: $106,000

BTCUSDT: Positive CDV Divergence for Potential Long Setups• Market Overview: Bitcoin currently sits at a pivotal point. Although the price movement has been somewhat indecisive, we’re watching closely for signs of bullish momentum.
• CDV Divergence Focus: Our attention is on a potential positive Cumulative Volume Delta (CDV) divergence. This takes shape when the price makes a lower low but CDV registers a higher low (regular bullish divergence), or when the price posts a higher low and CDV shows a lower low (hidden bullish divergence). These patterns can hint at growing buying interest even if price action hasn’t caught up yet.
• Support Zones (Blue Boxes): The highlighted blue zones on the chart signal potential support levels where buyers may step in. These are mapped from prior demand areas or structural support points.
• Trade Setup: Should a confirmed positive CDV divergence appear near or inside one of these blue zones, it could offer a strong case for a long entry. This would suggest that while the price may look weak, buying strength is quietly building underneath.
• Managing Risk: Any long entry must be accompanied by a well-defined invalidation level—typically just below the blue box support or the lowest point of the divergence.
Disclaimer: This is a technical pattern-based analysis intended for informational purposes only. Trading involves risk. Always perform your own due diligence and assess your risk appetite before entering any trades.

Navigating BTC the Volatile Path to a Potential $117,000 PeakBitcoin at a Crossroads: Navigating the Volatile Path to a Potential $117,000 Peak
Introduction: A Tale of Two Forces
The world of Bitcoin is once again a theater of high drama. After a breathtaking surge that brought the digital asset tantalizingly close to its all-time high, the market now stands at a pivotal crossroads, caught in a tense tug-of-war between powerful bullish undercurrents and formidable macroeconomic headwinds. On one side, a confluence of unprecedented institutional adoption, potent on-chain signals, and a volatile derivatives market suggests an imminent price explosion. Analysts and investors whisper of a short-term upper bound of $117,000, with some seeing a potential tap of $116,000 as early as July amid a ‘perfect storm’ of macro catalysts. A move to this level would represent a significant 6.45% jump from Bitcoin’s recent price, a leap that seems entirely within reach when viewed through the lens of the asset's internal momentum.
Yet, on the other side stands the unyielding wall of global economic reality. Bitcoin’s recent attempt to decisively conquer the $110,000 level was swiftly reversed as strong U.S. jobs data and other factors tempered expectations of a near-term Federal Reserve rate cut. This macroeconomic reality has cast a long shadow over risk assets, including Bitcoin, creating significant resistance at the previous all-time high of around $112,000. Analysts point to an absence of new, retail-driven buyers and the kind of "FOMO-driven greed" that characterized previous bull runs as a key factor pinning the price down.
This creates a fascinating and high-stakes dichotomy. The very structure of the Bitcoin market has undergone a "paradigm shift," with institutional exchange-traded funds (ETFs) providing a steady, relentless stream of demand. At the same time, the asset remains tethered to the decisions of central bankers and the health of the global economy. This article will delve into the intricate layers of this conflict, exploring the powerful bull case built on on-chain data and market structure, the sobering macroeconomic headwinds, the psychological barrier of the all-time high, and the long-term predictions that see Bitcoin potentially reaching $200,000. As the market braces for pivotal events like the upcoming Jackson Hole Economic Symposium, the question on every investor's mind is which of these two powerful forces will ultimately dictate Bitcoin's next monumental move.
The Bull Case: A Cauldron of On-Chain and Derivatives Strength
Bitcoin’s impressive rally was not a random speculative whim; it was underpinned by a bedrock of strong on-chain and technical signals that paint a compelling picture of underlying market health and explosive potential. These indicators, which provide a transparent view into the blockchain’s activity, suggest that the current price action is just the beginning.
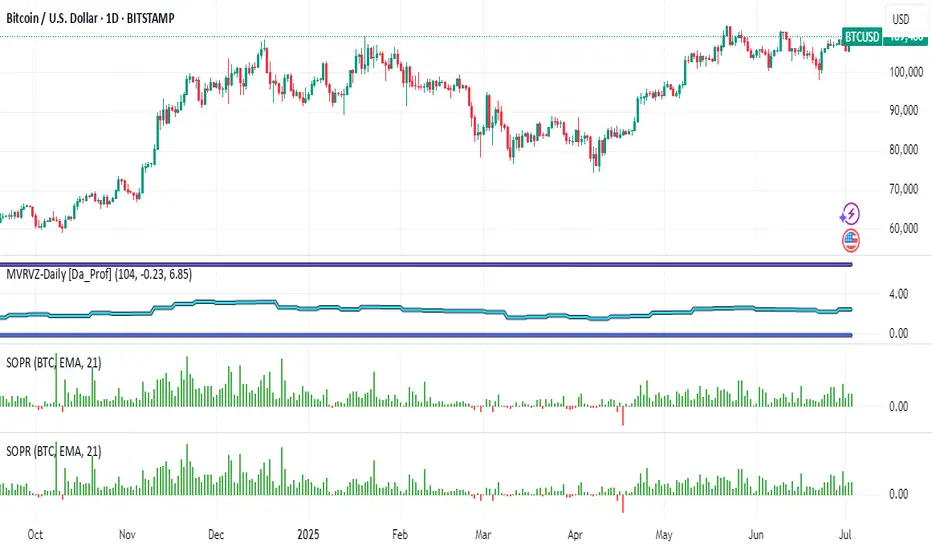
On-Chain Analysis: The Blockchain's Transparent Ledger
On-chain analysis is the practice of examining the public and immutable data on a blockchain to understand the behavior of network participants. Unlike traditional financial markets, where investor actions are opaque, Bitcoin’s ledger allows for a granular assessment of transaction volumes, wallet balances, and investor profitability, offering a data-driven glimpse into market sentiment.
Two of the most powerful on-chain metrics in this context are the Market Value to Realized Value (MVRV) ratio and the Spent Output Profit Ratio (SOPR).
The MVRV ratio is a fundamental valuation tool that compares Bitcoin's total market capitalization to its "realized capitalization." While market cap is the current price multiplied by all coins in circulation, realized cap values each coin at the price it was last moved on-chain. Essentially, MVRV compares the current market price to the average cost basis of all investors. A high MVRV ratio suggests the market is overheated, while a ratio below 1.0 signifies that the average investor is underwater, a condition often seen at market bottoms.
The Spent Output Profit Ratio (SOPR) offers a more immediate look at market behavior by analyzing the profitability of transactions occurring on the network. It is calculated by dividing the sale price of a Bitcoin by the price it was last acquired.
• When SOPR is greater than 1, it means that, on average, coins being sold are in profit.
• When SOPR is less than 1, it means coins are being sold at a loss.
• A SOPR value of 1 acts as a critical psychological level. In bull markets, the market often "bounces" off this line, as investors are reluctant to sell at a loss, creating strong support.
The Derivatives Market: Funding Rates and the Looming Short Squeeze
Beyond the blockchain itself, the cryptocurrency derivatives market provides another layer of bullish sentiment. This market is dominated by perpetual futures contracts, which use a funding rate mechanism to stay tethered to the spot price.
• Positive Funding Rate: When the futures price is higher than the spot price, longs pay shorts, indicating dominant bullish sentiment.
• Negative Funding Rate: When the spot price is higher than the futures price, shorts pay longs, indicating dominant bearish sentiment.
Paradoxically, a deeply negative funding rate can be an extremely bullish contrarian indicator. A crucial historical precedent exists: Bitcoin price rallied 80% the last time BTC funding rates flipped red. When funding rates are negative, it means a large number of traders are shorting the market. If the price begins to rise against them, these short sellers must buy back Bitcoin to close their positions and limit their losses.
This forced buying can trigger a "short squeeze." A large cluster of potential short liquidations has been identified near the $111,320 level, with an estimated $520.31 million in leveraged positions at risk. If the price can push through this zone, it could trigger a cascade of liquidations, providing the fuel to accelerate Bitcoin’s next leg higher into price discovery. This mechanism represents one of the most powerful potential catalysts for a rapid move toward the $116K-$117K target.
The Macroeconomic Maelstrom: A "Perfect Storm" of Headwinds
While Bitcoin’s internal metrics flash green, its path is being obstructed by a formidable storm of macroeconomic factors. In today's interconnected financial world, no asset is immune to the policies of central banks. The recent reversal from the push beyond $110,000 is a stark reminder of this reality, as markets began to discount the odds of the Federal Reserve lowering interest rates.
The Federal Reserve and Interest Rate Jitters
For the past several years, the price of Bitcoin has been highly correlated with monetary policy. A policy of low interest rates generally creates a favorable environment for assets like Bitcoin by lowering the opportunity cost of holding them compared to bonds or savings accounts. Conversely, a period of monetary tightening—characterized by higher interest rates—has a negative effect on Bitcoin's price.
The market's sensitivity to this was on full display when strong U.S. economic data reinforced the case for keeping rates "higher for longer" to contain inflation. This immediately took the wind out of Bitcoin’s sails and halted the rally. An unexpected rate cut, however, could send Bitcoin back toward its all-time high of $112,000.
All Eyes on Jackson Hole
This brings into focus the immense importance of the Jackson Hole Economic Symposium. This annual conference is a crucial event where central bankers from around the globe discuss pressing economic issues and signal future policy directions. Speeches from key figures, particularly the Federal Reserve Chair, are scrutinized by global markets for clues about the future of monetary policy.
The anticipation surrounding the event highlights its high stakes for risk assets. Market participants will be listening for any hint of a dovish pivot (a signal that rate cuts are back on the table) or a hawkish stance (a reinforcement of the "higher for longer" narrative).
• A dovish signal could be the catalyst that reignites Bitcoin's rally by weakening the dollar and sending risk assets soaring.
• A hawkish signal, on the other hand, could reinforce the current headwinds, potentially leading to a deeper correction for Bitcoin.
The Great Wall of $112K: Why All-Time Highs Are Hard to Break
Every seasoned market participant knows that previous all-time highs (ATHs) are not just numbers on a chart; they are formidable psychological barriers. For Bitcoin, the level around $112,000 represents this wall. Breaking through it requires immense momentum, and the current struggle to do so is explained by a critical missing ingredient: widespread, retail-driven Fear of Missing Out (FOMO).
The Psychology of an All-Time High
An ATH represents a point of maximum financial opportunity and maximum regret. This creates a powerful and complex dynamic:
1. Profit-Taking: Long-term holders and traders who bought at lower prices see the ATH as a prime opportunity to realize their gains.
2. Break-Even Selling: Investors who bought at or near the previous peak may be eager to sell as soon as their position returns to break-even.
3. Hesitation from New Buyers: For new investors, buying at an all-time high feels inherently risky, leading to hesitation.
Overcoming this selling pressure requires a massive wave of new demand, a force often fueled by pure, unadulterated FOMO.
The Absence of FOMO-Driven Greed
FOMO, or the "Fear of Missing Out," is the force that turns a rally into a parabolic ascent, characterized by a surge in retail interest and media saturation. Analysts suggest that a key reason Bitcoin can’t break the $112K all-time high is the absence of new buyers and FOMO-driven greed. While there have been spikes in retail enthusiasm, the kind of euphoric mania seen at the peak of previous cycles has yet to fully materialize in 2025. Without that surge of irrational exuberance, there may not be enough buying pressure to absorb the natural selling that occurs at an all-time high, creating a stalemate.
The Paradigm Shift: How Institutional ETFs Changed the Game
While the lack of retail FOMO explains the resistance at the all-time high, the very reason Bitcoin reached this level so quickly is due to a fundamental, game-changing development: the approval and launch of spot Bitcoin Exchange-Traded Funds (ETFs) in the United States. This event represents a true "paradigm shift" in market structure, providing a powerful counterbalance to the whims of retail sentiment.
A spot Bitcoin ETF directly holds Bitcoin and allows investors to gain exposure through traditional brokerage accounts, dramatically simplifying the investment process. This has had a revolutionary impact:
1. Accessibility and Legitimacy: ETFs have democratized access to Bitcoin for a massive new audience and conferred a new level of legitimacy on the asset class.
2. Unlocking Institutional Capital: Most importantly, ETFs created a regulated pathway for institutional investors to allocate capital to Bitcoin.
The impact has been staggering, with massive ETF inflows directly fueling Bitcoin's price appreciation. In a recent two-month period, for instance, U.S.-based spot Bitcoin ETFs recorded nearly $10 billion in inflows. This is not the fickle demand of a retail FOMO cycle; it is the steady, calculated allocation of capital from major financial players, providing a strong floor for the price.
Gazing into the Crystal Ball: Near and Long-Term Price Horizons
With these conflicting forces shaping the market, analysts are looking at both short-term technical targets and long-term fundamental models to chart a potential path forward.
Short-Term Targets: The Path to $117,000
The immediate upper bound for Bitcoin is pegged by many analysts at $117,000, with some suggesting a move to $116K in July is possible. This target is derived from a combination of technical analysis, historical seasonal trends, and the potential for a short squeeze. A decisive break above the $112,000 all-time high would clear the path for a rapid move toward this level.
The Long-Term Vision: A $200,000 Call
Looking further ahead, some of the most bullish predictions from institutional players call for Bitcoin to hit $200,000 by the end of 2025. This forecast is not based on short-term chart patterns but on a fundamental assessment of supply and demand in this new era. The reasoning is that there is simply too much institutional demand to keep prices flat for long, a trend driven by the continued success of spot Bitcoin ETFs and growing regulatory clarity.
Interestingly, this bullish institutional sentiment for Bitcoin is not always extended to other major cryptocurrencies. Some outlooks are less confident that assets like Ethereum (ETH) and Solana (SOL) will hit new all-time highs this year. Challenges such as network reliability issues and the lack of similar institutional products are cited as reasons for a more tempered outlook on these other assets. This suggests a potential future where Bitcoin's performance decouples from the broader altcoin market, driven primarily by its unique status as an institutional-grade digital asset.
Conclusion: The Great Tension and the Path Forward
Bitcoin's current market position is one of profound tension. In the world of its own blockchain and market structure, the signals are bullish. A new era of institutional demand, evidenced by billions flowing into spot ETFs, has created a paradigm shift. This is reinforced by a derivatives market primed for a potential short squeeze.
However, Bitcoin does not exist in a vacuum. It is also a participant in the broader financial ecosystem, where a hawkish Federal Reserve has put a damper on risk-on sentiment. This macroeconomic resistance is amplified by the psychological barrier of the all-time high, where natural profit-taking meets the absence of the retail-driven FOMO that defined past cycles.
The resolution of this conflict will define the next chapter for Bitcoin. A catalyst could come from the Jackson Hole Symposium, a sudden acceleration in ETF inflows, or a shift in the macroeconomic landscape. What is certain is that Bitcoin is no longer just a retail phenomenon; it is a maturing asset on the global stage, navigating a complex interplay of internal strength and external pressures. Whether it reaches $117,000 in the coming months or faces a setback, its journey will be a masterclass in the collision of technology, finance, and human psychology.
Bitcoin Awaits Breakout Above $114K🪙 Current Price: ~$109,500
📈 Trend: Bullish but facing strong resistance at $114,000
📉 Support: $106,000–$107,000
📌 Outlook: Breakout above $114K could lead to $130K+. Otherwise, possible pullback to $106K.
📊 Key Drivers: ETF inflows, Fed rate cut expectations, weak USD.
💡 Strategy:
🔺 Buy: $107,000 – $107,500 → TP $114,000 | SL $106,000
🔻 Sell (take profit): $114,000 – $115,000 → SL if closes below $112,000

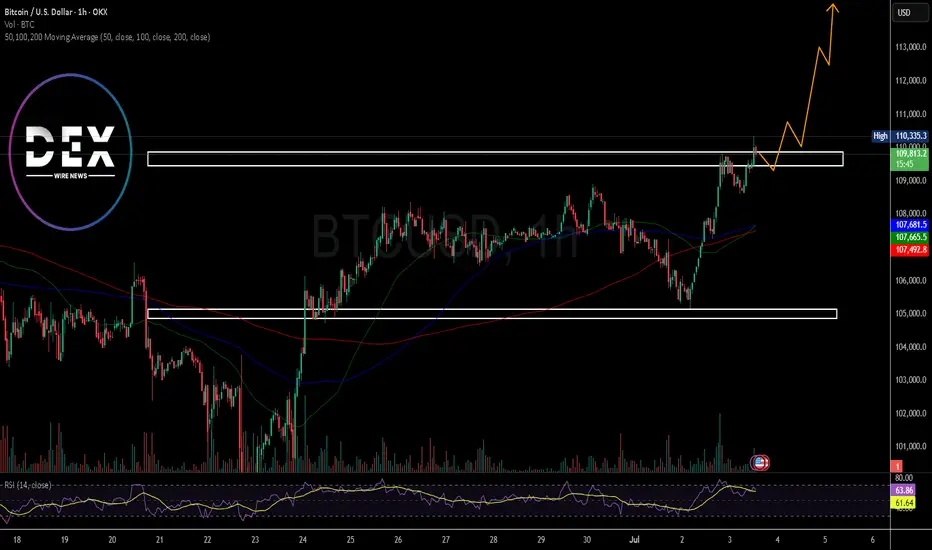
Breaking: Bitcoin Just Broke the $110k Resistant Next Top $115kThe price of the first crypto currency ever created saw a noteworthy uptick to reclaim the $110k price point however, the move was short-lived as the asset retraced to $109k mark but present price chart depicts a move to the $115k resistant point in the short term.
With the Relative strength index (RSI) at 63, Bitcoin might be inches away from claiming the $115k pivot amidst build up momentum and institutional adoption. further bullish metrics include the asset trading above the 50, 100 and 200-day Moving Averages (MA) respectfully.
BTC LONG TRADE IDEAThis is a bullish trend continuation trade idea on BTC.
Trend across all higher time frame is bullish.
$BTC Breakout $108k soonCRYPTOCAP:BTC is showing strength after bouncing from the $105K support zone.
It’s now trying to break above $108.5K.
If that happens, the next target could be around $111K–$112K.
The trend looks positive with growing momentum, but if BTC drops below $105K, this move could fail.
For now, bulls are in control.
Let’s see if they can keep it going.
DYRO, NFA

Bitcoin Supply Shock Is No Longer a Theory, But a Reality
In the intricate and often frenetic world of digital assets, the market is constantly sending signals. Some are loud, ephemeral flashes of volatility that capture headlines for a day. Others are quiet, seismic shifts that build slowly beneath the surface, unnoticed by the masses until they erupt with earth-shattering force. Today, the Bitcoin network is broadcasting one of these profound, underlying signals. It speaks of a disappearance, a vanishing act on a scale never before seen, pointing toward a supply shock so significant that it threatens to redefine the very concept of price discovery for the world’s premier cryptocurrency.
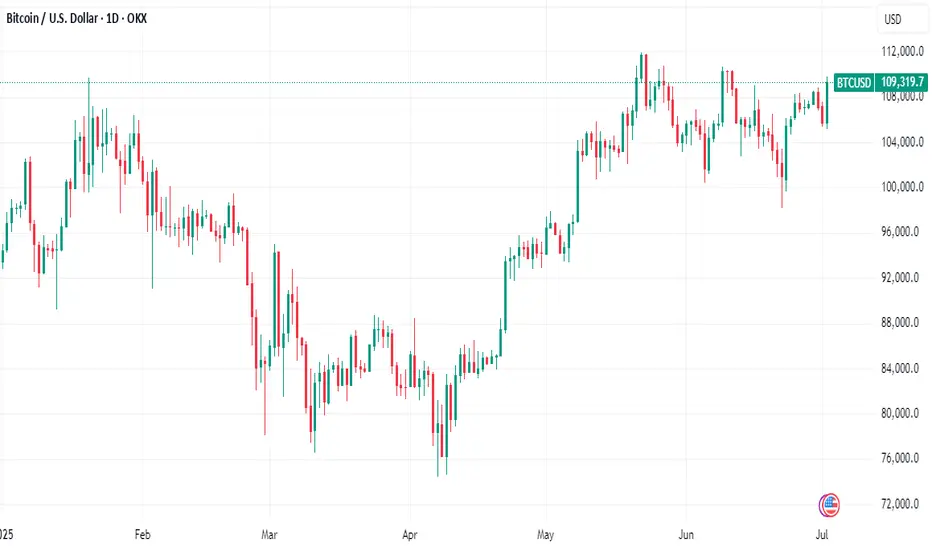
The paradox currently facing market observers is the disconnect between Bitcoin’s somewhat range-bound price, which has struggled to decisively conquer the territory above $120,000, and the tectonic movements occurring in its fundamental market structure. While the price action might suggest a market in equilibrium, a state of indecisive calm, the data tells a story of immense and growing tension. It is a story of a collision course between two unprecedented forces: a relentless, programmatic wave of institutional demand and a rapidly dwindling, fiercely guarded supply.
The central piece of evidence, the smoking gun for this impending crisis, is the state of Bitcoin reserves on cryptocurrency exchanges. These platforms, the bustling marketplaces where buyers and sellers meet, have seen their Bitcoin inventories plummet to a seven-year low. Less than 15% of the total circulating Bitcoin supply now resides on these exchanges, a figure that is as statistically stark as it is historically significant. This isn’t merely a data point; it is a profound statement of intent from the global cohort of Bitcoin holders. It signifies a monumental shift from short-term speculation to long-term conviction, a collective decision to withdraw assets from the realm of immediate liquidity and into the deep, fortified vaults of cold storage. This great disappearance is the quiet prelude to a very loud event, and to understand its implications, one must dissect the powerful forces of both supply and demand that are pulling the market to its breaking point.
The Vanishing Act: Where Has All the Bitcoin Gone?
To grasp the gravity of the dwindling exchange reserves, one must first understand the role of an exchange in the life cycle of a Bitcoin. An exchange is a trading floor. Assets held there are, by their very nature, liquid and available for sale. A holder who moves their Bitcoin onto an exchange is signaling an intent to trade or sell, either immediately or in the near future. Conversely, moving Bitcoin off an exchange and into a personal, self-custodied wallet—often called cold storage—is a deliberate act of preservation. It is a declaration that the owner has no immediate intention of selling. They are choosing to become a long-term holder, a saver, effectively removing their coins from the active, tradeable supply.
For years, the flow of Bitcoin onto and off of exchanges has served as a reliable barometer of market sentiment. During the euphoric peaks of past bull markets, a predictable pattern emerged: as prices soared, a flood of Bitcoin would move onto exchanges as long-term holders finally decided to take profits. This influx of supply would help to satisfy the frenzied buying demand, eventually capping the rally and leading to a market correction.
This cycle, however, is fundamentally different. The opposite is happening. Despite prices reaching new all-time highs, the flow has been overwhelmingly outward. Coins are leaving exchanges at a historic pace, creating a supply-side vacuum. This exodus is not a new phenomenon, but the acceleration over the past 18 months has been breathtaking. It reflects a maturing market and a hardened investor base that has learned the lessons of previous cycles. They have witnessed Bitcoin’s resilience, its ability to weather brutal bear markets and emerge stronger each time. They are no longer content with selling for a 5x or 10x profit, only to watch the asset climb another tenfold in the subsequent years. They have transitioned from treating Bitcoin as a speculative trade to embracing it as a long-term savings technology, a digital store of value in an increasingly uncertain macroeconomic world. The coins are not lost; they have simply gone home, locked away by owners who have no interest in selling at today’s prices.
The Wall Street Leviathan: A New and Insatiable Source of Demand
While the available supply of Bitcoin has been quietly disappearing into private wallets, a new and powerful predator has entered the ecosystem, armed with an insatiable appetite. The launch of spot Bitcoin Exchange-Traded Funds (ETFs) in the United States marked the single most significant structural change in the history of the Bitcoin market. These regulated financial products, offered by the largest asset managers in the world, have constructed a permanent, one-way bridge connecting the traditional financial system to the digital asset space.
This bridge is not for casual tourism; it is a superhighway for capital. The ETFs, led by BlackRock’s behemoth iShares Bitcoin Trust (IBIT), have unleashed a torrent of institutional and retail money that is systematically draining the remaining available supply. The mechanics of these ETFs are crucial to understand. Unlike futures-based products, a spot ETF must acquire and hold the underlying asset—in this case, real Bitcoin—to back the shares it issues to investors. This means that for every dollar that flows into an ETF like IBIT, its managers must go into the open market and buy a corresponding amount of Bitcoin.
The scale of this operation is staggering. In a stunning testament to the demand for this new product, BlackRock’s Bitcoin ETF has, in its short 18-month existence, begun to generate more revenue from annual fees than its long-established and immensely popular S&P 500 fund. This is not a niche product for crypto enthusiasts; it is a mainstream financial blockbuster, attracting billions from investors seeking a simple, regulated way to gain exposure to Bitcoin.
This creates a relentless, programmatic buying pressure that the market has never before had to absorb. Every single trading day, the ETFs collectively purchase a significant amount of Bitcoin. This demand is constant and largely price-agnostic. It is driven by asset allocation decisions, not short-term market timing. This programmatic buying acts like a giant hydraulic pump, sucking up any loose supply available on exchanges. The daily demand from these Wall Street giants often outstrips the new supply of Bitcoin created by miners, creating a structural deficit that can only be filled by one source: the existing coins held by others. And as we’ve seen, those holders are increasingly unwilling to part with their assets.
The Diamond-Handed Super-Majority: A Trillion-Dollar Standoff
The collision between the insatiable demand of the ETFs and the shrinking available supply raises a critical question: why aren't the existing holders selling? With so much new money flooding into the market, basic economics would suggest that the rising price should entice current owners to sell and realize their gains. Yet, the data reveals a fascinating psychological standoff.
According to research from the on-chain analytics firm Glassnode, a "super-majority" of Bitcoin holders are currently sitting on a colossal $1.2 trillion in unrealized profits. This means that a vast portion of the network acquired their coins at prices far below the current level and are deep in the green. In any other market, such a massive overhang of profit would be seen as a significant risk, a powder keg of potential sell pressure waiting to be ignited.
But in the world of Bitcoin, it has become a fortress of conviction. Glassnode’s analysis concludes that the current price, even in the six-figure range, "is not compelling enough for investors to continue selling." This is a revolutionary insight into the mindset of the modern Bitcoin investor. Their price targets have shifted dramatically. They are not looking to sell at $120,000 or even $140,000. For many, these levels are seen as mere stepping stones on the path to a much higher valuation, one that properly reflects Bitcoin’s role as a global, non-sovereign store of value.
Further research into profit-taking behavior confirms this trend. The amount of realized profit—that is, coins being sold at a gain—in the current cycle has yet to match the levels seen during the peak of the 2024 rally. This suggests that the holders who were willing to sell at those prices have already done so. The remaining cohort is composed of the most steadfast believers, the "diamond hands," who are holding out for a much more significant repricing. Some analyses suggest that the Bitcoin price would notionally need to rise another 30%, toward the $140,000 mark, just to reach a point where this cohort even begins to feel tempted to part with their holdings in a meaningful way. This creates a powerful reflexive loop: the less they sell, the less supply is available, and the more explosive the potential price move when demand continues to pour in.
The Macroeconomic Perfect Storm
The conviction of Bitcoin holders and the flood of institutional capital are not occurring in a vacuum. They are a direct response to a global macroeconomic environment that is creating a perfect storm for a hard, scarce asset. The primary driver of this is the unprecedented expansion of the global money supply. The M2 money supply—a broad measure of currency that includes cash, checking and savings deposits, and money market funds—has reached a record high.
Governments and central banks around the world have engaged in years of quantitative easing and fiscal stimulus, effectively printing trillions of dollars to prop up their economies. While often necessary in the short term, this relentless monetary expansion has a corrosive long-term effect: it debases the value of fiat currencies. As the supply of dollars, euros, and yen increases, the purchasing power of each individual unit decreases.
In this environment, rational economic actors begin to search for a safe harbor, a place to protect their wealth from the slow-motion erosion of inflation. Historically, this role was filled by assets like gold. Today, a growing number of individuals, corporations, and even nation-states are turning to Bitcoin. Its mathematically enforced scarcity—a hard cap of 21 million coins that can never be altered—stands in stark contrast to the infinite printability of government-issued money.
This narrative has been supercharged by the recent performance of the US dollar itself. The world’s reserve currency experienced a dramatic 10.8% drop in its worst first-half performance since 1973, signaling a potential shift in global currency dynamics. As the dollar weakens, assets priced in dollars become cheaper for foreign investors, and the appeal of a non-sovereign alternative like Bitcoin grows. This macroeconomic backdrop provides the fundamental "why" behind the Bitcoin trade. It is no longer just a technological curiosity or a speculative bet; it is increasingly viewed as an essential component of a diversified portfolio, a hedge against the very real risks of monetary debasement and geopolitical instability. It is this understanding that underpins bullish price targets that sit around $170,000 and beyond.
Navigating the Uncomfortable Calm
With such a powerfully bullish confluence of factors, the question remains: why has Bitcoin been seemingly stuck in a consolidation pattern, unable to break out and sustain a move into the higher price ranges? Why did the market see a wobble that brought the price down to $105,000, causing anxiety among newer entrants?
The answer lies in the nature of market equilibrium. Even in the most ferocious bull market, there are always sellers. Miners, who must sell some of their newly minted Bitcoin to cover their operational costs, represent a constant source of supply. Early investors may take some profits to diversify their wealth. Short-term traders will try to play the ranges, and even some of the capital in the ETFs will inevitably be redeemed, forcing the funds to sell a corresponding amount of Bitcoin.
The current price range below $120,000 represents the battleground where the relentless, programmatic buying from the ETF leviathan is meeting and absorbing this natural, daily sell pressure. The market is in a state of accumulation and consolidation, building a strong base of support before its next major move. The fact that crypto market sentiment has held steady, even during price dips and the start of the third quarter—a period historically known for its weak seasonality—is a testament to the market's newfound maturity. The "weak hands," or investors with low conviction, have likely been shaken out, leaving a stronger, more resilient base of holders.
This period of sideways price action is likely to be deceptive. The historical seasonality of Bitcoin suggests that summer can often be a period of lackluster performance, lulling market participants into a state of complacency. The idea that Summer 2025 will "catch everyone off guard" stems from this dynamic. While the price chart may look boring, the underlying supply and demand forces are becoming ever more tightly coiled. The pressure is building, and the longer the market consolidates, the more violent the eventual breakout is likely to be.
The Inevitable Collision
The story of Bitcoin in 2025 is the story of an inevitable collision. On one side, you have the most powerful force of demand the asset has ever known: a fleet of Wall Street ETFs, led by the world's largest asset manager, programmatically buying Bitcoin every single day. This demand is structural, relentless, and here to stay.
On the other side, you have the most convicted group of holders in Bitcoin’s history. They are a super-majority, sitting on over a trillion dollars in profit, who have explicitly signaled through their actions and on-chain data that they have no intention of selling at these prices. They are withdrawing their coins from the market at a historic rate, creating a supply desert.
The dwindling reserve of Bitcoin on exchanges is the ticking clock in this grand drama. It is the visible measure of the supply shock in progress. Each day, the ETFs arrive in the market to fill their orders, only to find the shelves are increasingly bare. The deficit they create must be filled by prying coins from the diamond hands of long-term holders. But those holders have made their price clear, and it is not $120,000.
Therefore, the current market is not in a state of calm, but in a state of profound tension. It is the quiet moment before the lightning strike. The forces of an institutional-grade demand shock and a historic holder-induced supply squeeze are on a direct and unavoidable collision course. The question is no longer if this tension will resolve, but when and with what magnitude. The great disappearance of Bitcoin from the open market is the final signal that the supply problem is no longer a distant forecast. It is here, and it is about to change everything.
ARPAUSDT Forming Falling WedgeARPAUSDT is drawing fresh attention from crypto traders as it forms a classic falling wedge pattern on the daily timeframe. This technical pattern is widely recognized as a strong bullish reversal signal when backed by healthy volume and growing investor interest. The falling wedge indicates that the downtrend is losing momentum, and a breakout to the upside could trigger a significant move. With current market dynamics, ARPAUSDT is showing promising signs that it could deliver an expected gain of 80% to 90% or more once this pattern resolves.
Good volume levels in recent sessions confirm that accumulation is happening quietly, which is often the case before a breakout from a wedge pattern. Traders looking for high-probability setups should keep an eye on the breakout zone around the wedge’s upper trendline. A confirmed close above this resistance with increased volume could be the catalyst for a strong rally. ARPA’s fundamentals, coupled with positive sentiment from investors taking interest in the project, add extra fuel to the potential upside.
As more altcoins regain momentum, ARPAUSDT stands out as one of the most interesting pairs to watch for short- to mid-term gains. Technical traders and pattern-based investors often target these setups to capture explosive price action. Staying patient for a clean breakout and using proper risk management will be crucial to maximize the reward potential in this setup.
✅ Show your support by hitting the like button and
✅ Leaving a comment below! (What is You opinion about this Coin)
Your feedback and engagement keep me inspired to share more insightful market analysis with you!

BTC: Price to 134,500$ , FVG, Fib 0.5 and 0.618 ratio ?Price to 134,500$:
Bitcoin is now moving in a triangle pattern, which is getting smaller. The price is around $107,758. Here is possible move is a breakout to the downside first, where the price may drop to fill the "Fair Value Gap" area, which is marked in purple. This area is between the Fibonacci levels of 0.5 and 0.618. After that, Bitcoin could go up again and reach the price of $134,000.
Trade Ideas:
I marked 2 areas with arrow let the price reach here and wait for confirmation in both areas. Specially in Fair Value Gap area.
Trade Signal:
I will provide both trade signal here so follow my account and you can check my previous analysis regarding BITCOIN. So don't miss trade opportunity so follow must.
BINANCE:BTCUSDT BITSTAMP:BTCUSD COINBASE:BTCUSD COINBASE:BTCUSD BINANCE:BTCUSDT.P CRYPTO:BTCUSD BYBIT:BTCUSDT.P BINANCE:BTCUSD

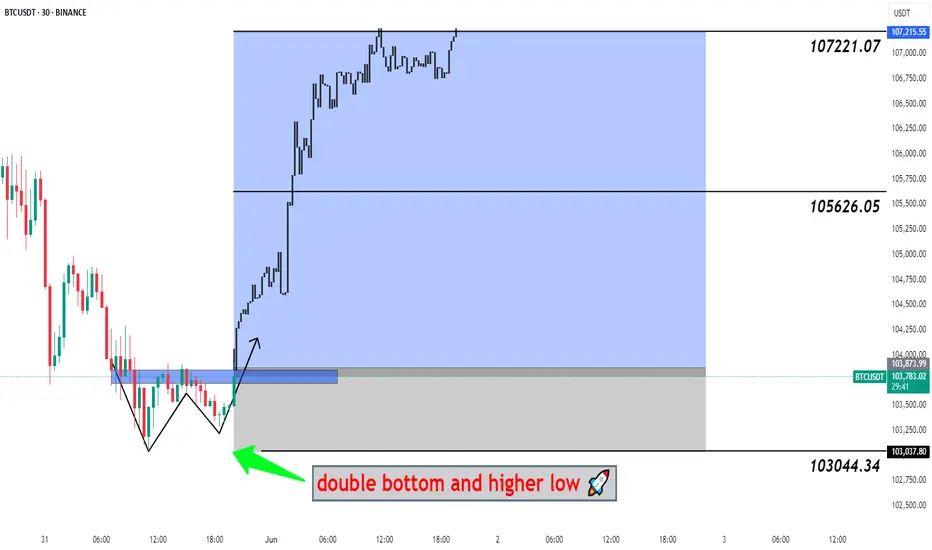
#BTCUSDT Big Pump Next Hour - Bitcoin, BTCUSD, BTCUSDT 📉 Double Bottom Pattern Forming – Potential Reversal Setup
The current price structure is showing signs of a Double Bottom – a classic bullish reversal pattern. After an extended downtrend, this pattern suggests that the market may be preparing for a trend reversal from this key demand zone.
🔹 Trade Setup
Entry, Targets, and Stop Loss (SL) are marked on the chart.
Entry: Upon breakout confirmation above the neckline.
Stop Loss: Just below the recent swing low to manage downside risk.
Targets: Calculated using the measured move method from the bottom to the neckline .
🔹 Risk & Money Management (Professional Approach)
To maintain consistent profitability and protect capital, strict risk management is essential. For this setup:
🔸 Position Sizing: Based on a fixed % of total capital (typically 1–2% of account equity per trade).
🔸 Risk-to-Reward Ratio: Minimum of 1:2, ideally higher.
🔸 Stop Loss Discipline: No arbitrary changes after entry. SL only adjusted for breakeven or trailing stops once price moves favorably.
🔸 Trade Management: Secure partial profits at key levels, trail stops as structure forms.
🔸 Capital Allocation: Avoid overexposure. Trade fits within overall portfolio strategy.
💬 Let the setup come to you. React, don’t predict.
🔁 Like, comment, or share your thoughts below!
BINANCE:BTCUSDT BITSTAMP:BTCUSD COINBASE:BTCUSD BINANCE:BTCUSDT.P INDEX:BTCUSD CRYPTOCAP:BTC.D CRYPTO:BTCUSD BYBIT:BTCUSDT.P BINANCE:BTCUSD