BTCUSDT LongAs stated earlier using the longer time frames (4H, 1D), I do anticipate that this crypto will continue with the bullish momentum.
If the price will not break the current support zone i.e at $57,200 then my entry point will be at
$58000. My SL will be at $54000 and my TP at $70,000
Btcusdbuy


Bitcoin Elliott Wave CountBitcoin Elliott Wave Count
CME:BTC1! BITSTAMP:BTCUSD COINBASE:BTCUSD CRYPTO:BTCUSD BINANCE:BTCUSD BITFINEX:BTCUSD
Elliott Wave Count
Target to 84k range from wave 2

BTCUSD Bitcoin 15Min-TIMEFRAME ANALYSIS💥BTCUSD 15Min-TIMEFRAME ANALYSIS
💗Hello ladies and gentlemen
This is my new idea for 💥BTC Bitcoin
I hope my idea is clear
Support me by like and share thank you
Stay Safe💯💲💲💲
Good luck💰😍

“Crypto summer” what can expect next ?BTC / USDT
The last 4 months in crypto was very boring and very tough for altcoins market “classic crypto summer”
What can expect next ?
1- Bounce from 61-63k areas to resistance zone of descending channel (already touched 63k)
2- Another massive sell off to early 50k
In the first scenario …BTC is still copying the gold pattern before major breakout …Check the comparison between BTC&GOLD charts here :
Best of wishes

BTCUSDT Pattern FormationThis crypto coin is forming a very interesting pattern, a falling flag. This pattern always has a very strong reversal, which means a bullish trend.
A follow up analysis with a shorter entry timeframe will be shown.

#BTC/USDT#BTC
Bitcoin price has been moving in an upward trend on the four-hour frame since the beginning of July
The price has now touched the rising trend and produced a reversal candle on a 4-hour frame
It is expected to retest the level that the price reached two days ago
Our target is at 68186
This is supported by the bearish saturation of the RSI aperture
The rise also supports stability above the Moving Average 100
And stability is above the current trend
The pattern is canceled
if it closes 4 hours below the upward trend in orange


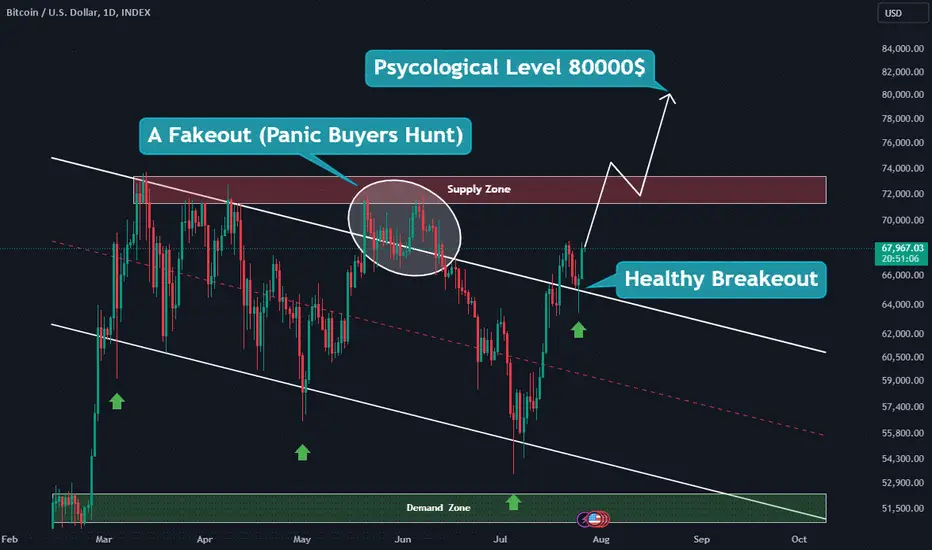
Will It Fly To 80000?This Is My Personal Idea Not A Financial Advise
In This Chart I Show You My Personal Idea About Bitcoin So I'm Expecting More Growth Over Bitcoin.

IS Bitcoin Going To ATH? Or Even More?As The Daily TF I Can See Potential Strong Upside Movement. There Is A Daily Parallel Channel Breakout. So I'm Suggesting To Go Long On Pullbacks. Don't Trust Technical indicators this Time. All The Indicators Will Show You To Short.
Just Be Updated With Daily TF Please Wait For 1H Update.
Bitcoin Nears Crucial Test as Hashrate StrengthensBitcoin (BTC) is on the cusp of a critical test as it approaches a trendline resistance that proved formidable in May. Concurrently, a surge in Bitcoin mining hashrate, a bullish indicator, is adding fuel to the rally.
The benchmark cryptocurrency has been on a consistent upward trajectory, fueled by a combination of factors including increased institutional interest, macroeconomic concerns, and the halving event. As BTC closes in on the May trendline, traders and analysts are closely watching for how the market will react. A decisive breakout could ignite a new leg up in the price, while a rejection could lead to a period of consolidation or even a temporary pullback.
The recent strengthening of the Bitcoin mining hashrate is a positive development that underpins the bullish outlook. The hashrate, which measures the computational power dedicated to mining new Bitcoin blocks, is often seen as a leading indicator of price trends. A higher hashrate implies increased miner confidence in the future price of Bitcoin, as miners are willing to invest more resources into the network. This surge in hashrate can also be attributed to the ongoing Bitcoin halving cycle, which reduces the block reward and incentivizes miners to optimize their operations.
While the technical and fundamental backdrop for Bitcoin appears constructive, it's essential to approach the market with caution. Cryptocurrencies remain highly volatile assets, and price movements can be influenced by a variety of factors, including regulatory developments, macroeconomic conditions, and investor sentiment.
Moreover, the Bitcoin market has a history of false breakouts, where prices briefly pierce resistance levels before retracing. Therefore, traders must employ risk management strategies and avoid overexposure.
The potential breakout from the May trendline will be a key event to watch. If Bitcoin successfully overcomes this hurdle, it could open the door for a more substantial rally towards higher price targets. However, a rejection at this level could lead to a period of consolidation or even a temporary pullback.
Ultimately, the cryptocurrency market remains highly dynamic, and investors should conduct their own research and due diligence before making investment decisions.
Disclaimer: This article is for informational purposes only and does not constitute financial advice. Cryptocurrency investments involve significant risks, and investors should be prepared for the possibility of losses.

BTC Bitcoin Technical Analysis and Trade Idea👉🔍We can observe that Bitcoin (BTC) has been in a bullish trend recently and has retraced to a key support level. In the video, we discuss market structure, price action, and the trend. I'm expecting to see a potential reaction and an opportunity to go long if the price action unfolds as described in the video. As always, this is for educational purposes only and should not be considered financial advice. 📊✅

Bitcoin rangingThe final sell-off of the German government's BTC reserves has calmed down to the point of the big bad olf being gone. Mt Gox is still in the back of everyone's mind which is why the fear greed index still sits below 45 but I truly belive that we have bottomed already and BTC is preparing for a massive explosion in Q4 of this year.

Hash Ribbons Signal Potential Bitcoin Bull RunMiner Capitulation Ends, Igniting Bullish Outlook
The cryptocurrency market is abuzz with excitement as a key indicator signals a potential turning point for Bitcoin. The Hash Ribbons indicator, a tool used to measure miner capitulation, has recently shifted into a bullish "buy" signal. This development, coupled with other positive market trends, is fueling speculation of an imminent Bitcoin rally.
The Hash Ribbons indicator tracks Bitcoin's hashrate using two moving averages: a 30-day and a 60-day. When the shorter moving average dips below the longer one, it typically signals miner distress and potential market downturn. Conversely, when the 30-day average surpasses the 60-day, it historically marks a "buy" signal, often preceding significant price increases. The recent shift to a bullish signal indicates that miners may have weathered the storm, and Bitcoin could be poised for an upward trajectory.
This positive development is further reinforced by evidence suggesting the end of miner capitulation. Miners often sell their Bitcoin holdings during periods of low profitability to cover operational costs. When this selling pressure subsides, it can lead to a price increase as the supply of Bitcoin available for sale decreases.
Market Enthusiasm Amidst Uncertainties
While the Hash Ribbons signal and the apparent end of miner capitulation are undoubtedly bullish indicators, it's essential to consider the broader market context. Several factors could potentially dampen Bitcoin's momentum.
One significant concern is the impending payout of claims from the collapsed Mt. Gox exchange. A substantial amount of Bitcoin is expected to be released into the market, which could exert downward pressure on prices. Additionally, the potential approval of Ether ETFs in the United States has introduced a new element of uncertainty. While this development could benefit the broader cryptocurrency market, it may also lead to increased volatility in Bitcoin's price.
Despite these potential headwinds, the overall sentiment among market participants appears to be optimistic. The Hash Ribbons signal has generated significant buzz, and many analysts believe that Bitcoin is primed for a substantial rally. However, as with any investment, it's crucial to approach the market with caution and conduct thorough research before making any decisions.
The cryptocurrency market is highly volatile, and prices can fluctuate rapidly. Investors should carefully consider their risk tolerance and investment goals before allocating funds to Bitcoin or any other digital asset. While the Hash Ribbons indicator and other positive factors suggest a potential bullish trend, it's essential to remain vigilant and monitor market developments closely.
Ultimately, the future of Bitcoin's price is difficult to predict with certainty. However, the recent bullish signals provide a glimmer of hope for investors who have weathered the cryptocurrency market's ups and downs. As the market continues to evolve, it will be fascinating to see how Bitcoin responds to the challenges and opportunities ahead.

BTC will go next to...Bitcoin CRYPTOCAP:BTC in the upcoming days... This is how I see it playing out.

#BTC/USDT#BTC
The price is moving within a bullish channel pattern on a 30-minute frame, and the price is now at the lower border of the channel
Which supports the bullish assumption because the price is based on an upward trend and is moving within it
We have a higher stability moving average of 100
We have an upward trend on the RSI indicator that supports the rise and gives greater momentum, and the price is based on it to rise after it was broken upward.
Entry price is 67,000 $
With a target at the upper border of the ascending channel 68600 $

Btc 100k Target Expecting a Flag pattern , Confirmation will be made when BTC will breakout this flag and retest it successfully. Then the target is 100K. You should enter in this trade after successful retest.

BTCUSDT ⚡ Channel Pattern SpottedHey guys!
At this very moment, we are in the middle of almost everything so you don't want to get caught on the wrong side of the trade. Better be safe than sorry. Having said that, here's my idea about what we are looking at right now.
1) There's a channel marked by green lines as shown in the chart. If you can see this, you'll notice whenever price touches the upper line it gets rejected and whenever it touches the lower band it bounces back inside the range. We can buy when price hits there and sell whenever it touches the upper resistance channel range. A deal breaker would be either a breakdown of the channel or breakout of the channel.
2) TARGETS if price keeps respecting the channel pattern, would be at the top resistance line to take profits as a buyer and viceversa as a buyer taking entry trigger a candlestick pattern on the lower band of the channel.
This idea is to spot for the long term. This asset is still in balanced mode, there hasn't been a breakout of the range yet. However, it's worth to note that there's a channel pattern playing out, right now.
Hope you find it useful and be able to take advantage of this idea.
Kina Tip of the Day: Take profits partially even when they don't seem much because in the long run they will grow in a balanced way with the rest of the portfolio.
Keep it shiny ⭐
Kina, The Girly Trader

3 Reasons, WHY BTC DUMPED TODAY !!!In this Video i have mentioned top 3 reasons why btc dumped today.
this week is very important for btc, closely watch ur live trading positions.
Thank You

#BTC/USDT Road to $150k!#BTC : Block out the noise.
We're far from finished! Each dip presents a new opportunity.
You FOMO when the market's green, but turn sceptical when it's red. That strategy won't cut it.
Bitcoin Monthly Analysis Update
Chart Overview:
- Channel Analysis: Bitcoin is in a long-term ascending channel, showing a bullish trend with strong support and resistance.
- Historical Patterns:
- 2016-2018: 60 bars (420 days),
- 2020-2021: 34 bars (238 days),
- Current Position: Trading at $66,993.6 nearing upper channel resistance with a target of $115k to $150k.
Key Levels:
- Support:
- $51,682.
- $43,285. (High Liquidity Untested Territory)
- Resistance:
- $66,993.6
- $73,000
Future Projections:
- High Liquidity Untested Territory: Retest around $43,210.7 could be a strong buy.
- Bullish Scenario: Breaking current resistance targets $115,000 - $150,000.
- Bearish Scenario: Failure to break $70k resistance may lead to correction towards support levels in the high liquidity zone, GETTEX:48K to $60k. (Will update as the time goes and more candles are printed), less likely scenario but possible. Am I scared or selling? NO! I am holding BTC and Alts.
Market Sentiment: Volume increase during last bull run suggests bullish sentiment, but traders should be ready for volatility.
Conclusion: Bitcoin remains bullish within the ascending channel. Monitor key levels to capitalize on market movements.
DYOR, NFA 🚀
#Crypto
What do you think?


WEEKLY FOREX FORECAST JULY 15-19th: BITCOIN BUY SETUPAnalyzing BTCUSD for the upcoming week.
It looks like there is evidence that price turning bullish in this market.
Enjoy!
May profits be upon you.
Leave any questions or comments in the comment section.
I appreciate any feedback from my viewers!
Like and/or subscribe if you want more accurate analysis.
Thank you so much!
Disclaimer:
I do not provide personal investment advice and I am not a qualified licensed investment advisor.
All information found here, including any ideas, opinions, views, predictions, forecasts, commentaries, suggestions, expressed or implied herein, are for informational, entertainment or educational purposes only and should not be construed as personal investment advice. While the information provided is believed to be accurate, it may include errors or inaccuracies.
I will not and cannot be held liable for any actions you take as a result of anything you read here.
Conduct your own due diligence, or consult a licensed financial advisor or broker before making any and all investment decisions. Any investments, trades, speculations, or decisions made on the basis of any information found on this channel, expressed or implied herein, are committed at your own risk, financial or otherwise.

BTC correction is finished!CRYPTOCAP:BTC
Correction is complete!
Now, forget the illiterate bears who were calling this one-day sideways price action a "bearish market."
