Whales Dump on Wall Street, Fueling Bitcoin's 'Inevitable' SurgeIn the high-stakes world of cryptocurrency, where fortunes are made and lost in the blink of an eye, a new narrative is taking shape. With Bitcoin's price hypothetically hovering around a robust $107,000, a significant portion of market analysis now suggests that a new all-time high is not just a possibility, but an inevitability. This confidence stems from a complex interplay of technical strength, unprecedented institutional demand, and a massive, yet healthy, transfer of wealth from early adopters to the new titans of finance.
The market is currently witnessing a fascinating dynamic: while the price consolidates above the monumental $100,000 psychological barrier, long-term holders, often referred to as "OG whales," are systematically selling their holdings. This activity, which could be misconstrued as bearish, is being interpreted by many as a necessary and constructive phase. Instead of suppressing the price, this distribution is meeting a voracious appetite from Wall Street, primarily through the mechanism of spot Bitcoin Exchange-Traded Funds (ETFs). This creates a state of equilibrium, a period of sideways consolidation where the market digests enormous gains and builds a foundation for its next explosive move. The target on the horizon is a liquidity cluster around $109,000, a key level that, if decisively flipped to support, could unlock a path to uncharted territory.
This article will delve into the multifaceted dynamics of this hypothetical market scenario. It will explore the significance of consolidating above $100,000, dissect the "great transfer" of Bitcoin from early believers to institutional giants, and analyze the technical and on-chain metrics pointing toward an imminent breakout. Finally, it will consider the potential risks and counterarguments that could challenge the prevailing bullish thesis, providing a comprehensive overview of a market at a pivotal crossroads.
Part 1: The New Paradigm - Consolidating Above $100,000
The act of breaking and holding a price level as significant as $100,000 represents more than just a numerical achievement; it is a profound psychological and structural shift for Bitcoin. In this hypothetical scenario, the market is not just visiting this level but is actively building a base above it, a process known as consolidation. This phase is crucial, characterized by sideways price movement within a defined range, often accompanied by decreasing trading volume, as the market takes a collective breath and establishes a new sense of fair value.
The Psychology of a Six-Figure Asset
For years, $100,000 was a distant, almost mythical target for Bitcoin. Surpassing and, more importantly, sustaining this level transforms market perception. It solidifies Bitcoin's status as a mature, global macro asset, moving it further away from its speculative past. This psychological victory attracts a new wave of capital from more conservative investors, wealth funds, and corporations who may have been hesitant to enter before such a milestone was reached. The consolidation phase above this level acts as a proof of stability, demonstrating that the asset can absorb significant profit-taking without collapsing, thereby building trust and confidence for the next wave of adoption.
Market Structure and Institutional Support
This period of stability is not happening in a vacuum. It is underpinned by a fundamental change in market structure, primarily the advent and overwhelming success of spot Bitcoin ETFs. These regulated financial products have provided a seamless bridge for Wall Street to pour billions of dollars into Bitcoin, creating a formidable wall of buy-side demand. In this scenario, where Bitcoin oscillates between $102,000 and $110,000, spot ETFs would be consistently recording massive net inflows, absorbing the supply being offered by sellers.
This dynamic is a textbook example of healthy consolidation. It is a tug-of-war where the immense selling pressure from profit-takers is effectively matched by the persistent buying pressure from new institutional entrants. This prevents a sharp price decline and allows the market to methodically transfer coins from one cohort to another without inducing panic. Technically, this phase often forms recognizable patterns like sideways ranges, bullish flags, or ascending triangles, all of which suggest that pressure is building for an eventual breakout to the upside. The decreasing volume during this time indicates that the market is reaching an equilibrium before the next major directional move.
Historical Precedent in a New Era
Bitcoin has experienced consolidation phases after breaking previous major milestones, such as $1,000 and $20,000. However, the current hypothetical consolidation above $100,000 is fundamentally different in both scale and participants. Previous cycles were largely driven by retail investors and a smaller group of early adopters. The current cycle is defined by the heavyweight presence of institutional players who bring not only massive capital but also a long-term strategic investment horizon.
The amount of capital required to absorb selling pressure at a six-figure price point is orders of magnitude greater than in any previous cycle. The fact that the market can achieve this stability highlights the depth and maturity it has developed. While past consolidations were precursors to further retail-driven mania, the current phase is about the systematic absorption of early investor supply by the largest financial institutions in the world, setting the stage for a rally built on a much stronger and more diverse foundation. This isn't just a pause; it's the construction of a launchpad for the next chapter in Bitcoin's story.
Part 2: The "Great Transfer" - Long-Term Holders vs. Wall Street
At the heart of the market's current dynamic is a historic transfer of wealth. This is the moment where the earliest and most steadfast believers in Bitcoin, the "OG Whales" or Long-Term Holders (LTHs), are realizing their life-changing gains by selling to the new behemoths of the financial world: Wall Street institutions. This process is not the bearish signal it might imply, but rather a critical market function that fuels the bull run's continuation.
Defining the Players: "OG Whales" and Long-Term Holders
Long-Term Holders (LTHs) are typically defined in on-chain analysis as addresses that have held their Bitcoin for more than 155 days (approximately five months). These are investors who have weathered significant volatility and have a deep conviction in the asset. "OG Whales" are a subset of this group, representing individuals or entities who accumulated vast amounts of Bitcoin in its nascent stages, often at prices of three figures or less. For them, selling at over $100,000 represents astronomical returns on their initial investment.
Their motivation to sell is rational and expected. It is a common market pattern for patient bottom buyers to take profits as the market approaches and surpasses new all-time highs. They understand that the euphoria surrounding these record prices is what attracts the necessary buy-side demand to absorb their large sell orders. This selling, or "distribution," is a hallmark of every Bitcoin bull market peak. The key question is whether the demand is strong enough to absorb this supply without crashing the price.
Deconstructing the "Dumping on Wall Street" Narrative
The essence of this transfer is that since the launch of spot Bitcoin ETFs, LTHs have been the primary source of selling pressure. They are, in effect, providing the liquidity that the newly launched ETFs require to meet the relentless demand from their clients.
This dynamic is precisely why the price has been able to stabilize at such high levels. The institutional buying frenzy is absorbing the supply unloaded by LTHs. This is not a malicious act of suppression but a symbiotic relationship: LTHs need massive buyers to sell to, and Wall Street needs massive sellers to source coins from. This is simply the natural ebb and flow of a market cycle where supply and demand are meeting at a new, higher equilibrium.
On-Chain Evidence of a Healthy Distribution
Several on-chain metrics provide a clear window into this phenomenon, confirming that the current selling is a sign of a healthy bull market, not an impending top.
• Spent Output Profit Ratio (SOPR): This metric shows the degree of realized profit for all coins moved on-chain. In this scenario, the LTH-SOPR would be extremely high, indicating that the coins being sold were acquired at a much lower cost basis and are now being sold for massive profits. While this signals profit-taking, it is typical of a bull market and, on its own, does not signal a top.
• Realized Profit: On-chain data would show a massive spike in realized profits, confirming that sellers are locking in gains. The market's ability to absorb these profits and continue consolidating is a sign of immense strength.
• Coin Days Destroyed (CDD) / Value Days Destroyed (VDD): These metrics measure the activity of older coins. A spike in VDD is synonymous with the LTH cohort spending their coins. This typically peaks shortly after breaking all-time highs because sellers need the liquidity that new buyers bring. The fact that this selling is being met with such strong institutional demand prevents it from turning into a bear market trigger.
• Long-Term Holder Supply: While some LTHs are selling, the overall supply held by this cohort may still be growing or stabilizing. This is because investors who bought six months prior are continuously "aging" into LTH status. This indicates that while the oldest hands are selling, a new generation of convicted holders is forming, providing a solid foundation for the market.
In essence, the "great transfer" is a feature, not a bug, of the current bull market. It is a sign of Bitcoin's maturation, where the asset is moving from the strong hands of early pioneers to the deep pockets of the global financial system. This process allows the market to de-risk, shed its over-leveraged players, and build a stronger base for what many believe is the inevitable next leg up.
Part 3: The Path to $109K and Beyond - Technical and Liquidity Analysis
With the market having established a strong foundation above $100,000, all eyes turn to the next key resistance levels. Technical and on-chain analysis points to a significant cluster of liquidity around the $109,000 mark, which is viewed as the final hurdle before Bitcoin can enter a new phase of price discovery. The argument for the "inevitability" of a new all-time high rests on a confluence of bullish technical patterns, resetting momentum indicators, and the overwhelming force of market liquidity.
Understanding Liquidity at $109,000
In financial markets, liquidity refers to the ease with which an asset can be bought or sold without causing a significant price change. On a price chart, liquidity is concentrated at levels with a high density of buy and sell orders. The area around $109,000 to $111,000 represents a major liquidity cluster. This is composed of:
• Sell Orders (Asks): A large number of investors who bought at lower prices have placed take-profit orders at this psychological and technical level.
• Short Position Liquidations: Traders who are betting against Bitcoin have placed their stop-losses above this resistance. If the price breaks through, these short positions are automatically closed with a buy order, creating a "short squeeze" that adds explosive fuel to the rally.
Analysis of order book data shows significant liquidation levels stacked just above this zone. Successfully breaking through and absorbing this sell-side liquidity would remove a significant barrier, clearing the path for a rapid move higher. A decisive flip of the $109,000 level from resistance to support is what bulls are watching for as the ultimate confirmation of upward momentum.
Bullish Technical Indicators
The consolidation phase has allowed Bitcoin's technical indicators to cool off and prepare for the next advance.
• Chart Patterns: On higher timeframes, the price action is forming classic bullish continuation patterns. There is potential for formations like an inverted head-and-shoulders pattern or a bullish engulfing candlestick, both of which have historically high success rates in predicting upward moves. A bullish engulfing pattern on the daily chart, for instance, has shown a high probability of leading to new local highs when appearing in a broader uptrend.
• Momentum Oscillators: Indicators like the Relative Strength Index (RSI) and the MACD (Moving Average Convergence Divergence) have likely reset from "overbought" conditions during the consolidation. This reset is healthy and necessary, allowing momentum to build again from a neutral base rather than an overheated one. It signals that the market has shed its speculative froth and is ready for a more sustainable trend.
• Moving Averages: Throughout the consolidation period, the price would find strong support at key moving averages, such as the 21-week exponential moving average (EMA) or the 50-day simple moving average (SMA). These levels act as dynamic support, with dip buyers consistently stepping in, reinforcing the strength of the underlying trend.
•
The "Inevitability" Thesis Synthesized
The argument that a new all-time high is "inevitable" is built on the convergence of these powerful forces:
1. Unprecedented Demand: The constant, price-agnostic inflows from spot Bitcoin ETFs provide a demand floor that the market has never experienced before.
2. Supply Absorption: The selling pressure from long-term holders, which would have crushed the market in previous cycles, is being successfully absorbed by this new institutional demand.
3. Healthy Reset: The market has undergone a healthy consolidation, allowing technicals to cool off, leverage to be flushed out, and a strong support base to be built.
4. Psychological Breakthrough: The conquest of the $100,000 level has fundamentally altered market perception and opened the door to price discovery, with the next logical target being the liquidity pool at $109,000.
While no outcome in financial markets is ever truly guaranteed, the confluence of persistent institutional buying, constructive on-chain dynamics, and bullish technical setups creates a powerful case that Bitcoin is coiling for a significant breakout. The move through $109,000 is seen not as a question of "if," but "when."
Part 4: Risks and Counterarguments
Despite the overwhelmingly bullish sentiment in this hypothetical scenario, a prudent analysis requires examining the potential risks and counterarguments that could challenge or delay the ascent to new all-time highs. The cryptocurrency market remains susceptible to a variety of internal and external shocks, and overconfidence can be a precursor to sharp corrections.
Macroeconomic Headwinds
Bitcoin's increasing integration into the global financial system means it is more sensitive to macroeconomic conditions than ever before. A sudden and severe global recession, an unexpected spike in inflation leading to aggressive monetary tightening by central banks, or major geopolitical conflicts could trigger a "risk-off" event across all asset classes, including Bitcoin. Investors might flee to the perceived safety of cash or government bonds, causing even the strong institutional demand for Bitcoin to waver. It is often noted that traders wait for clarity on key macroeconomic data and policy updates before committing to a trend, and any negative surprises could trigger a sell-off.
Overwhelming Profit-Taking
The thesis of a new all-time high hinges on the ability of institutional demand to absorb the selling from long-term holders. However, there is a risk that this supply could become too overwhelming. The profits held by early investors are immense, and there may be a price point—perhaps on the approach to $110,000 or just beyond—where profit-taking accelerates to a pace that even the ETFs cannot sustain. If a large cohort of whales decides to sell in unison, it could create a supply shock that temporarily breaks the market structure and forces a deeper correction.
Market Exhaustion and Valuation Metrics
While consolidation is healthy, a prolonged sideways period can sometimes signal exhaustion rather than accumulation. On-chain metrics that compare Bitcoin's market value to its realized value are crucial for gauging how overheated the market is. These tools help identify periods of extreme overvaluation. If such metrics were to enter their highest zones, it would suggest that the market is reaching peak froth, making it vulnerable to a sharp reversal, regardless of the positive narrative. It is understood that while Bitcoin's price has a strong correlation to global liquidity, internal market dynamics can cause it to decouple, especially during periods of extreme valuation.
Regulatory and Black Swan Risks
The risk of unforeseen "black swan" events always looms over the market. This could include a sudden and harsh regulatory crackdown in a major jurisdiction, the collapse of a major crypto exchange or institution, or the discovery of a critical flaw in the Bitcoin protocol itself. Furthermore, the concentration of Bitcoin within a few large ETF products, while providing demand, also introduces a new vector of risk. If these institutions were to face regulatory pressure or decide to offload their holdings for strategic reasons, the resulting sell pressure could be catastrophic.
In conclusion, while the path to a new all-time high appears clear and well-supported by current dynamics, it is by no means guaranteed. A combination of adverse macroeconomic shifts, overwhelming selling pressure, extreme valuations, or an unexpected black swan event could easily derail the bullish momentum. Investors and analysts must remain vigilant, balancing the optimistic on-chain and technical data with a realistic appreciation of the inherent risks in this volatile asset class.
Conclusion
The hypothetical scenario of Bitcoin consolidating above $100,000 while eyeing a breakout to $109,000 and beyond represents a pivotal moment in the asset's history. It paints a picture of a market that has achieved a new level of maturity, driven by a paradigm shift in its investor base. The central thesis—that a new all-time high is now "inevitable"—is not born from baseless hype, but from a powerful confluence of observable market forces.
The successful establishment of the six-figure price level as a support floor, rather than a speculative peak, is the first pillar of this argument. This consolidation is made possible by the voracious and sustained demand from Wall Street institutions, which are using spot Bitcoin ETFs to absorb the immense selling pressure from early adopters. This dynamic, the "great transfer" of Bitcoin from OG whales to institutional treasuries, is not a sign of a market top but a healthy and necessary distribution that de-risks the market and fuels the next leg of the bull run.
The on-chain analysis provides a framework for understanding this phase not as stagnation, but as a constructive consolidation where the market builds energy for a parabolic advance. This narrative is supported by bullish technical patterns, resetting momentum indicators, and a clear liquidity target at $109,000, which, once breached, could trigger a powerful short squeeze and propel Bitcoin into a new phase of price discovery.
However, this bullish outlook must be tempered with an awareness of the significant risks that remain. Macroeconomic instability, the sheer scale of potential profit-taking, and the ever-present threat of regulatory or black swan events could challenge the prevailing trend.
Ultimately, this analysis reveals a Bitcoin that is at a crossroads, but one where the path forward appears more clearly defined and well-supported than ever before. The interplay between the old guard of crypto and the new titans of finance is forging a stronger, more resilient market. While no outcome is certain, the evidence strongly suggests that Bitcoin is not at the end of its run, but is merely pausing to build a higher launchpad for its journey into the financial mainstream.
Btcusdbuy

Analysis and layout of BTC trend in the third quarter📰 News information:
1. Pay attention to the movement of the cryptocurrency market
2. The impact of DAA, etc.
📈 Technical Analysis:
As demand weakens and supply pressure rises, BTC's network valuation exceeds the speed of activity. Exchange inflows and negative DAA divergences indicate that despite price stability, the risk of selling remains. Currently, BTC is experiencing a retracement after a rebound. In the short term, it is still possible to retrace to 106,500 and then rise after stabilizing.
🎯 Trading Points:
SELL 108000-107500
TP 107000-106500
BUY 106500-106000
TP 107500-108000
In addition to investment, life also includes poetry, distant places, and Allen. Facing the market is actually facing yourself, correcting your shortcomings, confronting your mistakes, and strictly disciplining yourself. I hope my analysis can help you🌐.

BTC Efforts to break the trend to create a new ATHPlan BTC today: 30 June 2025
Related Information:!!!
As of Monday, Bitcoin (BTC) is trading around $108,500, approximately 3% below its all-time high. Ethereum (ETH) has closed above a key resistance level, indicating the potential for a sustained upward movement. Meanwhile, Ripple (XRP) is approaching a critical threshold; a confirmed breakout could strengthen bullish momentum in the near term.
Bitcoin approaches record highs
The price of Bitcoin surged by 7.32% last week, closing above the $108,000 mark. As of the latest update on Monday, it remains near $108,500.
Should the current upward trend persist, BTC may extend its rally toward the all-time high of $111,980 recorded on May 22. A decisive close above this level could pave the way for further gains, potentially establishing a new all-time high at $120,000."
personal opinion:!!!
BTC buying pressure is prevented by selling pressure according to H4 trendline, accumulating and soon surpassing ATH
Important price zone to consider :!!!
support zone : 107.000 ; 104.600
Sustainable trading to beat the market

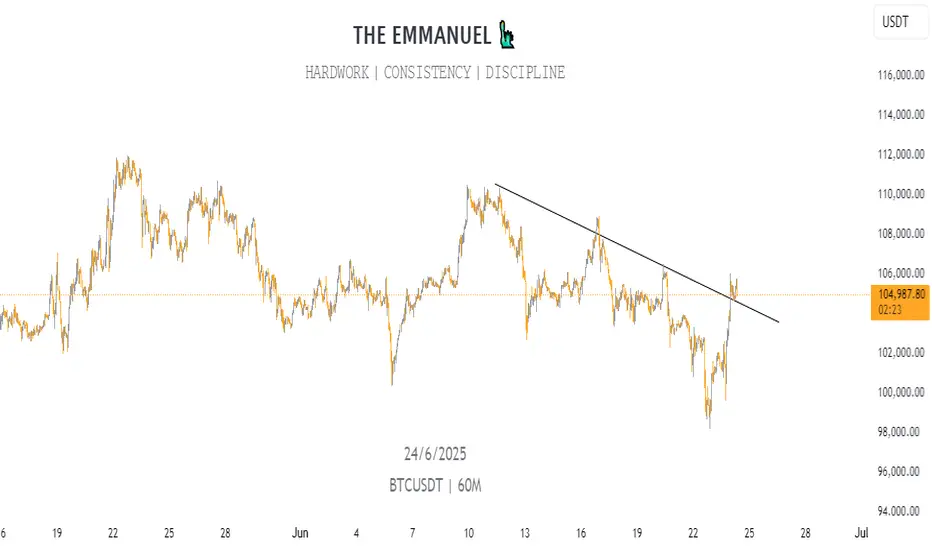
BITCOIN - Price can continue grow inside flat to $107933 level#BTC
The price is moving within a descending channel on the 1-hour frame and is expected to break and continue upward.
We have a trend to stabilize above the 100 moving average once again.
We have a downtrend on the RSI indicator that supports the upward move with a breakout.
We have a support area at the lower boundary of the channel at 106500, acting as strong support from which the price can rebound.
We have a major support area in green that pushed the price upward at 106000.
Entry price: 106736
First target: 106996
Second target: 107434
Third target: 107933
To manage risk, don't forget stop loss and capital management.
When you reach the first target, save some profits and then change your stop order to an entry order.
For inquiries, please comment.
Thank you.

BTC Slumps Below 100000, Rebounds to Test 109500 Short Zone💎 BTC Rebounds After 100000 Drop, Eyes Short at 109500 Resistance 📊
BTC dipped below the 100000 threshold 🔻 before rebounding near 98000 🔺—a move tied to DXY weakness and easing geopolitical tensions. Now challenging the 110000 mark 🔼, it faces stiff resistance at 109500. First-time 110000 tests often spark pullbacks, making shorts the favored play here 📉.
🚀 Sell@108500 - 107500
🚀 TP 106500 - 105500
Accurate signals are updated every day 📈 If you encounter any problems during trading, these signals can serve as your reliable guide 🧭 Feel free to refer to them! I sincerely hope they'll be of great help to you 🌟 👇

BTC Is Replaying a Bullish Fractal >>> Are You Watching?Hello guys!
I see a deja vu here! Let’s look at the historical daily chart (Jan–May 2025):
What happened?
Initial Drop (Yellow Oval): Bitcoin approached a key S&D zone but didn't touch it, triggering a short-lived bounce before dropping again.
Second Drop (Red Ovals): This time, price precisely touched the demand zone, triggering a clean bullish reversal.
What followed was a strong trend breakout, sustained higher lows, and an eventual surge past prior resistance levels.
Current 4H Chart Setup: A Mirror Image?
Yellow Highlight: Once again, we saw a bounce that didn't quite touch the key demand zone ($98K–$100K).
Red Zone Prediction: If this mirrors the historical move, the price is likely to return and touch this S&D area before launching a bullish leg.
Blue Path Projection: A sharp reversal is expected post-touch, aiming toward $111K–$113K as the next key resistance zone.
The descending trendline adds confluence
___________________
History Doesn’t Repeat, But It Often Rhymes
Based on this fractal analysis, Bitcoin is likely forming the same bullish base seen earlier in 2025. The setup hinges on one key event: a return to the $99K–$100K zone, where demand is likely to step in aggressively.
If the pattern repeats, the current market may offer one last high-reward long opportunity before a parabolic rally.

BTCUSD TRADE SETUP 📈 **Bitcoin (BTC/USD) 1H Chart Analysis — June 28, 2025**
🔍 **Pattern Identified: Bullish Flag Breakout**
🧠 **1. Market Context**
* This is the **1-hour chart** of **BTC/USD** on Binance.
* Price recently formed a **bullish flag pattern**, which is a **continuation pattern** signaling a potential breakout in the **direction of the previous trend (upward)**.
🔧 **2. Technical Breakdown**
🔹 **Trend Before the Flag**
* Price had a strong **impulsive move up** from \~105,000 to \~107,800.
* That was followed by a **consolidation phase** forming a downward sloping **channel** (blue parallel lines), creating the **flag**.
🔹 **Flag Channel**
* Price oscillated inside this flag for nearly 2 days (June 26–28).
* The **channel** is clearly defined, and price **respected both upper and lower bounds** during the consolidation.
🚀 **3. Breakout Confirmation**
* Price has now **broken out of the upper boundary** of the flag.
* A clean **break and candle close** above the trendline suggests **bullish momentum** is returning.
* This breakout is occurring around the **107,400–107,800** zone, which is also a **key structure level** acting as local resistance.
---
🎯 **4. Trade Setup**
✅ **Entry:**
* Around **107,400–107,800**, post-confirmation of the breakout.
❌ **Stop-Loss (SL):**
* Placed just below the **flag support / demand zone**, around **106,800**.
* This protects against a fake breakout or pullback into the flag.
🎯 **Target (TP):**
* Projected at **110,000**, which is aligned with the height of the initial flagpole projected from the breakout point.
* This also represents a psychological round number and a previous resistance level.
---
📊 **Risk-Reward Ratio (RRR)**
* **RRR = \~3:1**
* For every \$1 risked, the potential reward is \$3 — **excellent reward structure**.
---
📌 **Key Insights for the Traders**
* This is a **classic bullish flag breakout** play—very reliable in trending markets.
* **Volume confirmation** (not shown in chart but should be checked live) is important — higher volume during breakout gives stronger conviction.
* Watch for a possible **retest of the breakout level** (around 107,800) before the next move up.

BTC/USD Consolidation Breakout Setup Chart Overview:
The BTC/USD chart shows a strong bullish impulse followed by a consolidation phase just below a key resistance level, suggesting a potential bullish continuation.
🔹 Key Technical Zones:
📍 Support Zone:
105,368 – 106,481 USD
This area acted as a strong demand zone where price reversed aggressively.
📍 Resistance Level:
107,439 – 107,840 USD
Price is currently consolidating just below this resistance, indicating a buildup for a breakout.
🎯 Target Zone:
110,683 – 111,394 USD
A clean breakout above resistance could push price into this target area.
🔹 Technical Signals:
✅ Bullish Flag Formation:
After a strong impulse move, BTC is forming a sideways range, indicating bullish accumulation.
⬆️ Breakout Potential:
A confirmed breakout and retest above 107,840 could validate a move toward the 111K region.
⚠️ Invalidation Point:
A drop below 106,481 would invalidate the bullish bias and may trigger a deeper pullback.
📌 Conclusion:
As long as BTC holds above the 106,481 support and breaks above the 107,840 resistance, bullish momentum is expected to continue toward the 111K zone. Traders should watch for a breakout confirmation and manage risk accordingly. 💹

#BTC/UST#BTC
The price is moving within a descending channel on the 1-hour frame, adhering well to it, and is on its way to breaking it strongly upwards and retesting it.
We are seeing a rebound from the lower boundary of the descending channel, which is support at 106,000.
We have a downtrend on the RSI indicator that is about to break and retest, supporting the upward trend.
We are looking for stability above the 100 moving average.
Entry price: 106,600
First target: 106,750
Second target: 107,000
Third target: 107,291

BTC Rebounds After 100000 Drop, Eyeing Short at 109500 Resistanc📈 BTC Rebounds After 100000 Drop, Eyeing Short at 109500 Resistance
BTC dropped below the 100000 threshold 🔻 and then rebounded near 98000 🔺. This movement is related to the decline of DXY and the reduction of geopolitical risks. Now, BTC is challenging the 110000 level 🔼. The overhead resistance is around 109500. First - time tests of the 110000 level typically trigger pullbacks, so we favor short positions here 📉
🚀 Sell@109500 - 108500
🚀 TP 107500 - 106500 - 105500
Accurate signals are updated every day 📈 If you encounter any problems during trading, these signals can serve as your reliable guide 🧭 Feel free to refer to them! I sincerely hope they'll be of great help to you 🌟 👇

Bitcoin Drive up to 115k So currently BTC on the weekly and monthly is showing us a drive up to 115,700 then possibly seeing a correction major or minor then a drive up to 122k is what I am currently seeing at the moment
Kris Mindbloome Exchange
Trade Smarter Live Better

Bitcoin's Podium-Ready 'Bull Flag' Hints at Price Boom to $120KBitcoin's Podium-Ready 'Bull Flag' Hints at Price Boom to $120K
Bitcoin, the pioneering cryptocurrency that has redefined the financial landscape, continues to spark intense debate and fervent speculation about its future price trajectory. Amidst the sea of technical analyses and market predictions, a compelling pattern has emerged on Bitcoin's price chart: the 'bull flag.' This bullish continuation pattern, often seen as a precursor to significant upward price movements, has ignited excitement among Bitcoin proponents, fueling predictions of a potential surge to $120,000.
This article delves into the intricacies of the bull flag pattern, exploring its formation, characteristics, and implications for Bitcoin's price. We will analyze the current market conditions, considering the recent retreat from $108,000 and the overall sentiment of Bitcoin bulls. Furthermore, we will examine the factors that could either validate or invalidate the bull flag pattern, providing a nuanced perspective on the potential for Bitcoin to reach $120,000. By synthesizing these insights, we aim to offer a comprehensive overview of the technical and fundamental factors that could shape Bitcoin's price trajectory in the coming months.
Understanding the Bull Flag Pattern
The bull flag is a technical analysis pattern that signals a continuation of an existing uptrend. It is characterized by two distinct phases:
1. The Flagpole: This represents the initial strong upward movement in price. It is a sharp, almost vertical rally that establishes the overall bullish trend.
2. The Flag: This is a period of consolidation that follows the flagpole. The price moves sideways or slightly downwards, forming a rectangular or parallelogram-shaped pattern that resembles a flag. This consolidation phase allows the market to digest the initial rally and prepare for the next leg up.
The bull flag pattern is considered a bullish signal because it suggests that the initial uptrend is likely to resume after the consolidation phase. Traders often look for a breakout above the upper trendline of the flag as a confirmation signal to enter a long position.
Bitcoin's Bull Flag Formation
Bitcoin's price chart has exhibited a pattern that closely resembles a bull flag. The flagpole can be identified by the significant upward movement that occurred in the months leading up to June 2025. This rally propelled Bitcoin to a high of $108,000, establishing a strong bullish trend.
Following this rally, Bitcoin entered a period of consolidation, with the price moving sideways and slightly downwards. This consolidation phase has formed a flag-like pattern on the chart, characterized by two parallel trendlines that slope gently downwards.
The formation of this bull flag pattern has led many analysts to believe that Bitcoin is poised for another significant upward movement. The target price for this potential breakout is often calculated by measuring the length of the flagpole and adding it to the breakout point on the upper trendline of the flag. In Bitcoin's case, this calculation suggests a potential target price of around $120,000.
Factors Supporting the Bull Flag Pattern
Several factors support the validity of the bull flag pattern and the potential for Bitcoin to reach $120,000:
• Strong Underlying Bullish Trend: The bull flag is a continuation pattern, meaning that it relies on an existing uptrend to be valid. Bitcoin's price has been in a strong uptrend for several years, driven by increasing institutional adoption, growing mainstream adoption, and limited supply.
• Positive Market Sentiment: The overall sentiment among Bitcoin investors remains positive, despite the recent retreat from $108,000. Many analysts believe that Bitcoin is still in the early stages of its adoption curve and that its long-term potential remains significant.
• Increasing Institutional Adoption: Institutional investors, such as hedge funds, pension funds, and corporations, are increasingly allocating capital to Bitcoin. This increased institutional adoption can drive up the price of Bitcoin and provide a more stable foundation for its long-term growth.
• Growing Mainstream Adoption: Bitcoin is becoming increasingly accepted as a form of payment and a store of value by mainstream consumers and businesses. This growing mainstream adoption can increase demand for Bitcoin and drive up its price.
• Limited Supply: Bitcoin has a fixed supply of 21 million coins. This limited supply makes Bitcoin a scarce asset, which can increase its value over time as demand grows.
• Halving Events: Bitcoin's halving events, which occur approximately every four years, reduce the rate at which new Bitcoins are created. These halving events can reduce the supply of Bitcoin and drive up its price. The next halving event is expected to occur in 2028.
• Macroeconomic Factors: Macroeconomic factors, such as inflation, currency devaluation, and geopolitical instability, can increase demand for Bitcoin as a safe haven asset.
Factors Invalidating the Bull Flag Pattern
While the bull flag pattern is a bullish signal, it is not foolproof. Several factors could invalidate the pattern and prevent Bitcoin from reaching $120,000:
• Breakdown Below the Flag: If the price breaks down below the lower trendline of the flag, the bull flag pattern is invalidated. This would suggest that the consolidation phase is not a temporary pause before another rally, but rather a sign of weakening momentum.
• Negative News and Events: Negative news and events, such as regulatory crackdowns, security breaches, or macroeconomic shocks, could dampen investor sentiment and trigger a sell-off in Bitcoin.
• Weakening Market Fundamentals: If Bitcoin's adoption rate slows down, network activity declines, or transaction volume decreases, it could indicate that the underlying fundamentals are weakening, which could invalidate the bull flag pattern.
• Profit-Taking: After a significant rally, some investors may choose to take profits, which could put downward pressure on the price of Bitcoin and prevent it from breaking out of the flag.
• Alternative Investments: The emergence of compelling alternative investments could divert capital away from Bitcoin, reducing demand and potentially invalidating the bull flag.
Bitcoin Retreats From $108K: A Temporary Setback?
As of June 26, 2025, Bitcoin has retreated from its recent high of $108,000. This pullback has sparked concerns among some investors, but Bitcoin bulls remain optimistic about the long-term prospects of the cryptocurrency.
The recent retreat could be attributed to a number of factors, including profit-taking after a significant rally, regulatory concerns, or macroeconomic headwinds. However, it is important to note that Bitcoin has experienced numerous pullbacks throughout its history, and these pullbacks have often been followed by even stronger rallies.
The key question is whether this pullback is a temporary setback within the bull flag pattern or a sign that the pattern is about to be invalidated. If the price can hold above the lower trendline of the flag and eventually break out above the upper trendline, it would confirm the validity of the pattern and increase the likelihood of Bitcoin reaching $120,000.
Trading the Bull Flag Pattern
Traders who are looking to capitalize on the bull flag pattern can consider the following strategies:
• Entry Point: Wait for a confirmed breakout above the upper trendline of the flag before entering a long position. This helps to avoid false breakouts and increases the probability of a successful trade.
• Stop-Loss Order: Place a stop-loss order below the lower trendline of the flag to limit potential losses if the pattern is invalidated.
• Target Price: Calculate the target price by measuring the length of the flagpole and adding it to the breakout point on the upper trendline of the flag.
• Risk Management: Always use proper risk management techniques, such as limiting the amount of capital you risk on any single trade.
Conclusion
Bitcoin's price chart is currently exhibiting a bull flag pattern, which suggests that the cryptocurrency could be poised for another significant upward movement. The potential target price for this breakout is around $120,000.
However, it is important to note that the bull flag pattern is not foolproof, and several factors could invalidate it. Investors should carefully monitor the price action, market sentiment, and underlying fundamentals to assess the likelihood of Bitcoin reaching $120,000.
The recent retreat from $108,000 is a reminder that Bitcoin is a volatile asset and that pullbacks are a normal part of the market cycle. Whether this pullback is a temporary setback within the bull flag pattern or a sign that the pattern is about to be invalidated remains to be seen.
Ultimately, the future of Bitcoin's price will depend on a complex interplay of technical factors, market sentiment, and fundamental developments. By staying informed and using proper risk management techniques, investors can position themselves to potentially profit from Bitcoin's continued growth and success. As always, remember to consult with a qualified financial advisor before making any investment decisions. The bull flag offers a tantalizing glimpse of potential gains, but prudent analysis and risk mitigation are essential for navigating the volatile world of cryptocurrency.
Setup: Entry at $108,658 with Target at $98,815 and Stop Loss at1. Entry Point: 108,658
This is where the trader expects to enter a short position.
Price is projected to reverse near this level.
2. Stop Loss: 110,341
Located above the entry point.
If price hits this level, the short trade is invalidated, limiting losses.
3. Target (Take Profit): 98,815
This is the EA Target Point, about 9,714 points (~8.94%) below the entry.
Represents a favorable risk-reward ratio.
---
🔄 Trade Idea Summary
Trade Type: Short (Sell)
Risk: ~1,683 points (110,341 - 108,658)
Reward: ~9,843 points (108,658 - 98,815)
Risk-Reward Ratio: ~1:5.85 (which is strong)
---
📊 Technical Indicators in Use
Moving Averages:
Likely 50-period (red) and 200-period (blue) MAs.
The 50 MA is below the price, indicating short-term bullishness.
However, the trade idea goes against this short-term trend, suggesting a reversal strategy.
---
🔍 Interpretation & Strategy
This chart implies the trader expects resistance near 108,658, possibly due to historical highs or supply zones.
The bearish outlook expects a significant drop to 98,815, possibly supported by macro patterns (like head & shoulders, or bearish divergence—not shown here but could be inferred).
The purple zones highlight high-probability reversal or reaction areas (support/resistance zones).
---
⚠️ Things to Watch
Invalidation: If price closes above 110,341 on a 4H/1D chart, the trade setup fails.
Confirmation: A strong bearish candlestick at or near the entry zone would strengthen the case.
Market Context: News, economic data, or BTC ETF inflows/outflows can quickly invalidate technical setups.

BTCUSDT: Bounce Incoming?BTCUSDT Technical analysis update
-March 2024 resistance is now expected to act as a strong support level.
-The price has touched the 0.618 Fibonacci retracement level, suggesting a potential reversal from this zone.
-The 200 EMA on the 2-day chart is positioned as a strong dynamic support, reinforcing the bullish case.
We can expect a bounce from the $72-75k level.

New buying opportunity may emerge for BTCBTC tends to fluctuate in the short term, but as BTC builds a double bottom structure to support the rebound pattern, it is currently inclined to fluctuate upward. Although the upward momentum has weakened after reaching around 106,000, as long as it stays above the 105,300-104,800 area, BTC is still expected to continue to rise and may challenge the 108,000-109,000 area again.
And with the collapse of the gold and oil markets, funds in the two markets may flow into BTC, which is more attractive and the mainstream market of cryptocurrencies. So as BTC retreats in the short term, BTC may have new short-term buying opportunities. Then if BTC retreats to the 105,500-104,500 area and does not fall below this area, we can consider going long on BTC at the right time.

MSTR Bulls Reload on BTC ConvictionMSTR – Institutional Flow + BTC Correlation + Bull Vertical Spread Setup
MicroStrategy (MSTR), operating as “Strategy,” just went full throttle—adding 10,100 BTC between June 9–15 at an average of $104,080 per coin, totaling over $1.05B. With this, they now hold 592,100 BTC (>$63B), solidifying their status as the largest Bitcoin-holding public company. That’s a bold move amid the ongoing Israel-Iran macro uncertainty, signaling confidence, not caution.
This latest BTC buy was funded via STRK and STRF ATM offerings and the $979.7M STRD preferred IPO. Since initiating their Bitcoin treasury strategy in 2020, MSTR has soared over 3,000%, and they’re projecting a 25% BTC yield for 2025 after already clocking in at 13.7% YTD.
🔎 Flow Watch
Institutional activity around current price levels has been sharp—confirming conviction behind the recent momentum. With BTC hovering at critical support, I’m eyeing a potential short-term bullish reversal. Given the tight correlation between BTC and MSTR, the setup looks primed.
🎯 My Strategy
I’m targeting a bull vertical spread—buying the 382.5 call and selling the 385 call. This defined-risk, limited-reward setup positions me to capture near-term upside if BTC begins a rebound and MSTR follows suit. The tight strike range and elevated IV make it ideal for a premium-efficient directional bet.

BTC is expected to retreat in the short term, focus on 104500📰 Impact of news:
1. The ceasefire agreement reached earlier did not take effect, and Trump believed that both sides violated the agreement
2. Federal Reserve Chairman Powell delivered a speech 3 hours later
📈 Market analysis:
I haven't updated BTC for a while. Today I want to share my views on BTC with you. BTC is currently encountering resistance and pressure at the 106,000 level and is beginning to retreat. From the technical indicators, MACD is in a dead cross, and RSI is retreating after reaching the overbought area. There is no problem with the short-term bearish trend, and it is expected that it will be able to retreat to the 104,500 level without much problem. However, the recent decline in the gold market, DXY market, and crude oil market may cause funds to flow into the BTC market.
🏅 Trading strategies:
SELL 106000-105500
TP 105000-104500
BUY 140500-103500
TP 105000-106000
If you agree with this view, or have a better idea, please leave a message in the comment area. I look forward to hearing different voices.

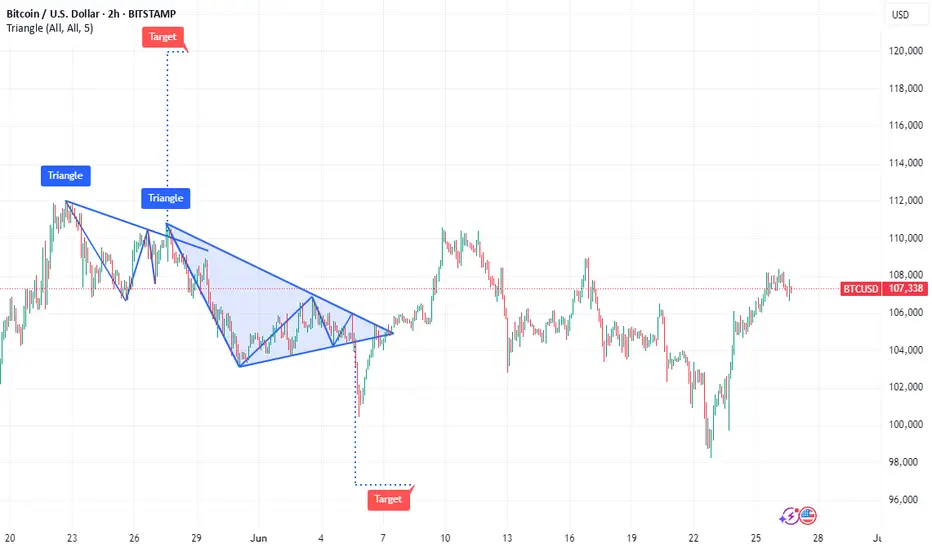
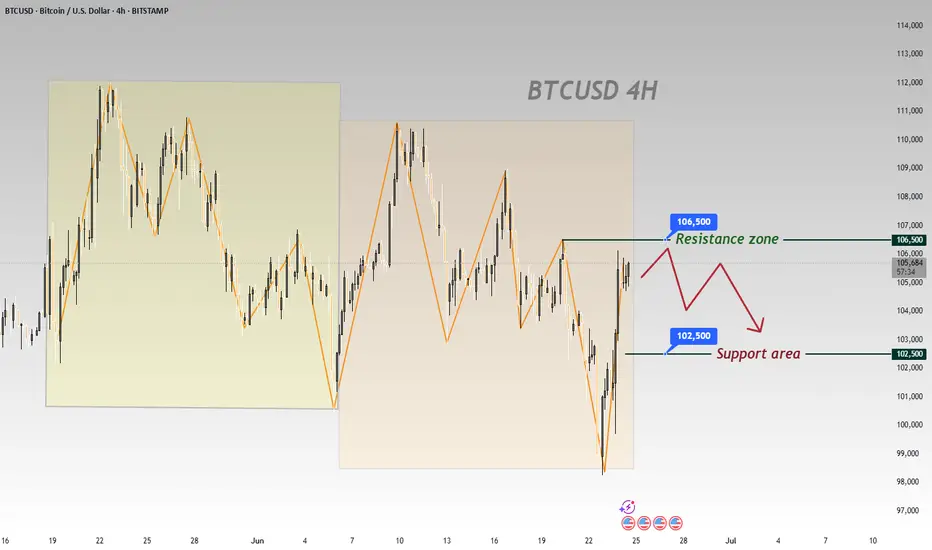
BTCUSD 4-Hour Chart Analysis: Range Bound with Bearish BiasFrom the 4 - hour chart of BTCUSD, the price movement shows obvious range - bound fluctuation characteristics 📊.
Currently, it is necessary to focus on the key resistance and support zones 🎯:
From a technical perspective, BTC is likely to oscillate repeatedly within the range in the near term 🔄, yet the overall trend leans bearish 🐻.
In the short term, opportunities for buying low and selling high within the range can be monitored 📈📉
⚡️⚡️⚡️ BTCUSD ⚡️⚡️⚡️
🚀 Sell@106500 - 105500
🚀 TP 104500 - 103500
🚀 Buy@102500 - 103500
🚀 TP 104500 - 105500
Accurate signals are updated every day 📈 If you encounter any problems during trading, these signals can serve as your reliable guide 🧭 Feel free to refer to them! I sincerely hope they'll be of great help to you 🌟 👇
Bitcoin BTC Pullback Strategy: How I’m Planning My Next EntryI’m currently watching BTCUSDT 👀. Yesterday, we saw a bullish break of structure 🔼, and my bias is to follow that momentum moving forward 📈. Right now, price is overextended 📊, so I’m looking for a retracement into equilibrium, ideally around the 50–61.8% Fibonacci zone 📏.
If price pulls back into that range and holds above the bullish imbalance (discussed in the video) 🧱, I’ll be watching for a long opportunity 🎯. My targets are set at the previous highs and the Fibonacci extension levels 🔝.
⚠️ Disclaimer
This is not financial advice. Trading involves risk, and you should only trade with capital you can afford to lose. Always do your own analysis or consult a qualified financial advisor.

Bitcoin / U.S. Dollar 4-Hour Chart - June 24, 20254-hour chart displays the Bitcoin (BTC) to U.S. Dollar (USD) price movement, currently at $105,121.98, reflecting a decrease of $258.74 (-0.25%) as of 03:15:58. The chart highlights a recent downward trend with a potential support level around $103,509.67 and a resistance zone between $104,651.27 and $107,154.41, indicated by shaded areas. The time frame spans from June 6 to June 25, 2025.

NEW BTC HIGHS?BTC just broke a previous resistance zone. Previous data indicates a more upward push.
This may even lead to new highs.
USD Index (DXY) Bullish Reversal & Breakout PotentialThe DXY chart displays a strong bullish reversal structure from the support zone near the 99,800–100,200 area. Here’s a professional breakdown of the technical setup:
🔍 Key Observations:
🟢 Bullish Reversal Formation
The price rebounded aggressively from a strong demand zone (support), marked by a green arrow and orange highlight.
Multiple historical reaction zones confirm this level's validity as a reliable support.
📉 Previous Decline & Correction
After reaching the resistance area near 110.400, the price corrected with a bearish channel.
This pullback formed a classic bull flag, a bullish continuation pattern, eventually leading to the current breakout.
🟦 Current Price Action
The market has broken out of the recent downtrend and is forming higher highs and higher lows.
A strong bullish impulse candle confirms renewed buying interest.
🧱 Support & Resistance Levels:
🔵 Resistance Zone (Target): 110.409 — a historically respected area and target for the bullish move.
🟣 Current Support Zone: 105.061 — previously resistance, now likely to act as support after the breakout.
🎯 Bullish Target Projection
If price retests and holds the support at 105.061, the next potential leg can extend towards 110.409, offering a strong risk-to-reward setup.
⚠️ Caution
Watch for a pullback and retest near the support level.
A failure to hold above 105.061 could invalidate the bullish structure.
🧠 Conclusion
The DXY is showing a bullish trend continuation after a breakout from a corrective structure. A successful retest of support could propel price towards the 110.400 target zone 📊.
Bias: ✅ Bullish above 105.061
Invalidation: ❌ Below 105.000

Bitcoin / U.S. Dollar 4-Hour Chart (BTCUSD)4-hour candlestick chart displays the price movement of Bitcoin (BTC) against the U.S. Dollar (USD) as of June 23, 2025, 03:45 PM CEST. The chart shows a recent sharp decline from a peak of approximately 104,443.81 USD to around 100,479.47 USD, with a current price of 102,035.20 USD, reflecting a 1.037.09% increase. Key levels include resistance around 104,000 USD and support near 100,000 USD, with notable volatility indicated by the candlestick patterns and a marked low point adorned with U.S. flags and a lightning bolt symbol.
