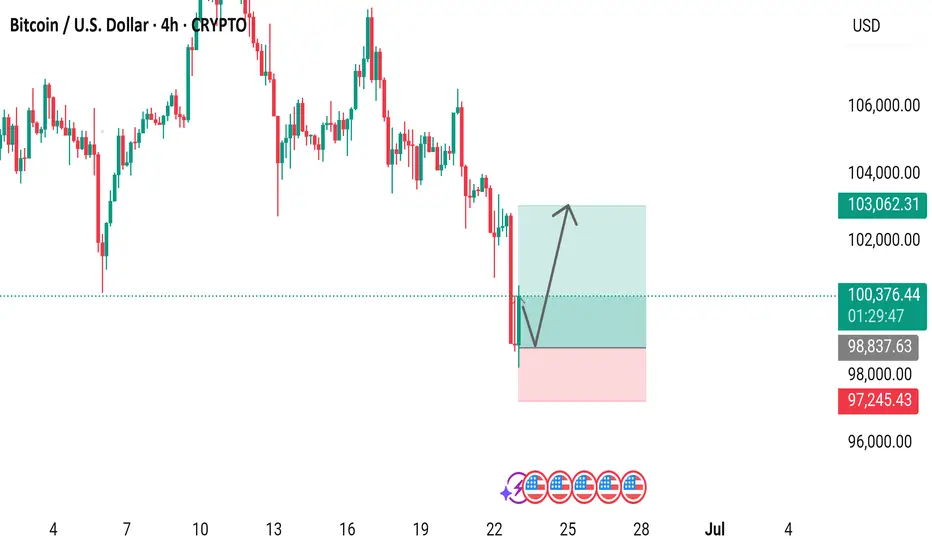
Bitcoin Price Analysis: Potential Rebound Ahead?4-hour Bitcoin price chart reveals a potential rebound opportunity. After a sharp decline, the price has stabilized around $97,245.43, forming a support level. The green and red box annotations suggest a possible price range breakout, with an upward arrow indicating a potential price increase. The current price stands at $100,461.58, down 1.63% from its recent peak. Will Bitcoin bounce back or continue its downward trend?
Btcusdbuy
BTC pressure, price under a lot of selling pressure💎 Update Plan BTC weekend (June 22)
Notable news about BTC:
Market overview: Bitcoin's consolidation lasts in the context of increasing macro instability
US President Donald Trump expressed his caution on Thursday when he delayed the decision involving a potential direct attack on Iran for a maximum of two weeks. The global market, including cryptocurrencies, has reacted, slightly increased in Asian and European sessions when investors absorb the impact of crude oil prices in the context of interrupted transport routes.
However, traders are very cautious, reflecting the tough stance of Fed President Jerome Powell on the economy, with the reason for the expectation of inflation in the short term due to tariffs.
Bitcoin -large holders continue to accumulate despite the cautious attitudes of traders on the spot and derivative markets.
Technical analysis angle
Bitcoin price fluctuates around $ 104.057 after cutting up the day from the peak of $ 106,457 of Friday. Main technical indicators, such as relative power index (RSI), strengthen the trend of discounts when the price slip down the average line 50.
Money Flow Index (MFI) indicator, monitoring the amount of money poured into BTC, shortening the trend of increasing, stable around the middle line. This reflects the limited interest in Bitcoin on both spot markets and derivative markets.
If the weakness of the Organizing Committee overshadows the demand on the chain and network activity, supporting the exponent dynamic line (EMA) 50 days at $ 103,169 can be helpful, temporarily absorbing the pressure of selling. Overcoming this level, high fluctuations can accelerate the decline, bringing the main levels, such as EMA 100 days at $ 99,085 and EMA 200 days at $ 93,404, in.
==> Comments for trend reference. Wishing investors successfully trading

Bitcoin / U.S. Dollar 2-Hour Chart (BTCUSD)2-hour chart displays the recent price movement of Bitcoin (BTC) against the U.S. Dollar (USD), showing a current price of $102,459.21 with a decline of $853.19 (-0.83%) over the period. The chart highlights a significant drop from a peak near $105,898.45, with a shaded area indicating a potential support zone between $101,682.19 and $99,732.49, and a resistance level around $103,000. The timeframe spans from 9:00 to 29:00, with technical indicators and price levels marked for analysis.

Bitcoin (BTC/USD) 2-Hour Candlestick Chart2-hour candlestick chart displays the recent price movement of Bitcoin (BTC) against the U.S. Dollar (USD), showing a current price of $103,904.89 with a gain of $595.12 (+0.58%) as of 01:22:41. The chart highlights a volatile period with significant price fluctuations, including a sharp drop followed by a recovery, and includes key price levels such as $106,099.25 and $102,803.95. The chart also features a highlighted support zone in pink and a resistance zone in light blue

BTC Consolidates 104000-105000: Bearish Breakdown Looming?BTC Technical Update: Bitcoin has been consolidating within the 104000-105000 range for an extended period, with the overall trend showing a downward bias. With the overall trend tilting bearish, traders should watch for a break below 103500 to confirm the next leg down. 📉
⚡️⚡️⚡️ BTCUSD ⚡️⚡️⚡️
🚀 Sell@ 105000 - 104500
🚀 TP 102500 - 101500
Accurate signals are updated every day 📈 If you encounter any problems during trading, these signals can serve as your reliable guide 🧭 Feel free to refer to them! I sincerely hope they'll be of great help to you 🌟 👇

Btc seizes the opportunity to trade with the trendTechnical analysis of BTC contract on June 20:
Today, the large-cycle daily level closed with a small negative line yesterday, and the K-line pattern was a single positive line with a continuous negative line. The price was below the moving average, and the attached indicator was dead cross and running downward, but we should note that the overall volatility this week was not large, and the fluctuation was in a small range. So we should pay attention to keeping short-term trading and closing profits in time. Don't hesitate, drag, and don't think about a big rise or fall. After a large drop on Tuesday this week, the short-term hourly chart has entered a small range of fluctuations. There is no continuation or breakout, so we should just follow the trend. We have sold at the high point of 105,500 as a defense, and bought at 103,000 as a defense, for short-term trading.

Current BTC Trend Analysis and Trading RecommendationsToday, U.S. markets are closed, leading to light trading activity and relatively limited overall market volatility. From a technical analysis perspective, the 4-hour K-line chart currently shows prices trading below the middle band of the Bollinger Bands, exhibiting a classic range-bound consolidation pattern. Bulls and bears are locked in a tug-of-war between key support and resistance levels, with K-line formations alternating between bullish and bearish patterns.
In terms of chart structure, the lower support zone has demonstrated strong buying conviction, while the upper resistance level has exerted clear restrictive force. Multiple failed upward breakouts have formed a short-term top. This box consolidation—characterized by resistance above and support below—is expected to sustain sideways trading through Friday.
Against the backdrop of no major positive catalysts, bearish momentum may gradually dominate if no substantial bullish triggers emerge. Maintain a trading strategy of selling into strength.
BTCUSD
105000-105500
tp:104000-103000
Investment itself is not the source of risk; it is only when investment behavior escapes rational control that risks lie in wait. In the trading process, always bear in mind that restraining impulsiveness is the primary criterion for success. I share trading signals daily, and all signals have been accurate without error for a full month. Regardless of your past profits or losses, with my assistance, you have the hope to achieve a breakthrough in your investment.

Evening BTC Market Analysis and Trading RecommendationsToday, U.S. markets are closed, leading to light trading activity and relatively limited overall market volatility. From a technical analysis perspective, the 4-hour K-line chart currently shows prices trading below the middle band of the Bollinger Bands, exhibiting a classic range-bound consolidation pattern. Bulls and bears are locked in a tug-of-war between key support and resistance levels, with K-line formations alternating between bullish and bearish patterns.
In terms of chart structure, the lower support zone has demonstrated strong buying conviction, while the upper resistance level has exerted clear restrictive force. Multiple failed upward breakouts have formed a short-term top. This box consolidation—characterized by resistance above and support below—is expected to sustain sideways trading through Friday.
Against the backdrop of no major positive catalysts, bearish momentum may gradually dominate if no substantial bullish triggers emerge. Maintain a trading strategy of selling into strength.
BTCUSDT
105000-105500
tp:104000-103000
Investment itself is not the source of risk; it is only when investment behavior escapes rational control that risks lie in wait. In the trading process, always bear in mind that restraining impulsiveness is the primary criterion for success. I share trading signals daily, and all signals have been accurate without error for a full month. Regardless of your past profits or losses, with my assistance, you have the hope to achieve a breakthrough in your investment.

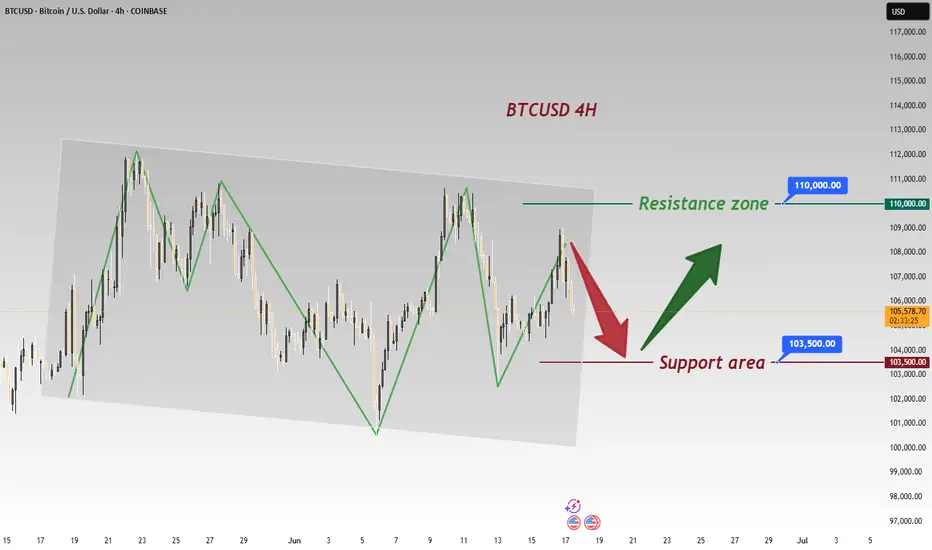
$BTCUSDT Eyes $120K After Key Support BounceBTCUSDT is holding strong above the ascending trendline and key support near $104K.
A fresh bounce suggests bullish momentum, with potential to break the $110K resistance.
If that happens, the next target could be around $120K. Trend remains bullish above support.
DYRO, NFA

continue to move accumulation: below 109,000💎 Update Plan BTC (June 20)
Notable news about BTC:
Semler Scientific (SMLR) unveiled an ambitious three-year strategy on Thursday aimed at significantly expanding its Bitcoin holdings to 105,000 BTC by the end of 2027. The announcement coincided with the appointment of a new executive to lead the firm’s digital asset initiative.
The Nasdaq-listed healthcare firm has named Joe Burnett as its Director of Bitcoin Strategy, a move it believes will strengthen its long-term treasury vision and enhance shareholder value. As part of this strategic shift, Semler Scientific plans to accumulate Bitcoin through a mix of equity and debt financing, alongside reinvested cash flows from its core business operations.
Technical analysis angle
BTC as well as XauUSD are trapped in the channel price 104k to 110k these are also two important milestones of BTC. Also congratulations to investors when detecting the bottom of 104k. The next expectation within the price channel is still maintained at 110k landmark
But with the recent moves of investors, the community is afraid that BTC will continue to adjust in the future.
==> Comments for trend reference. Wishing investors successfully trading

Bitcoin (BTC/USD) 2-Hour Candlestick Chart2-hour candlestick price movement of Bitcoin (BTC) against the U.S. Dollar (USD) as of June 20, 2025. The current price is $106,004.49, reflecting a 2-hour increase of $1,317.33 (+1.26%). The chart highlights a recent upward trend with a support level around $105,082.06 and resistance near $108,009.17. A shaded area indicates a potential price range, with a bullish projection suggested by the overlaid trendline.

BTC-----Buy around 104900, target 106000 areaTechnical analysis of BTC contract on June 19:
Today, the large-cycle daily level closed with a small positive line yesterday, the K-line pattern was a single positive line with continuous negative lines, the price was below the moving average, and the attached indicator was dead cross. The general trend of the decline was still relatively obvious, but in trading, we should pay more attention to the rhythm of the price range in the shock, so the operation should be decisive, not greedy, and do a good job of risk control; the short-cycle hourly chart yesterday's intraday support was corrected upward, the European session fell but did not continue to break down, the price support rebounded in the early morning, the current K-line pattern was a single positive line with continuous positive lines, and the attached indicator was golden cross, so it is highly likely to break through yesterday's high of 105500 area within the day.
Today's BTC short-term contract trading strategy:
Buy at the current price of 104900 area, stop loss at 104000 area, and target 106000 area;

BTCUSD Analysis UpdateBTC/USD Analysis Update 📈
Bitcoin has rebounded successfully after touching the 103500 support level and is currently trading around 105500. However, the ongoing correction may continue to test the psychological support at the 100000 round number in the short term ⚠️.
Key Points:
Support Bounce 🎯: BTC found buying interest at 103500, in line with our previous strategic analysis.
Immediate Resistance 📉: The current rebound faces direct resistance near 106000 (200-hour moving average).
Downside Risk 📉: Failure to hold above 105000 could trigger another decline toward 100000.
Risk Management:
Long positions should set stop-loss below 103000 ⛔️.
Short entries may consider the 106000–107000 range, targeting 102500 and 100000
⚡️⚡️⚡️ BTCUSD ⚡️⚡️⚡️
🚀 Buy@ 102500 - 103500
🚀 TP 106000 - 106500
🚀 Sell@ 106000 - 106500
🚀 TP 103500 - 101500
Accurate signals are updated every day 📈 If you encounter any problems during trading, these signals can serve as your reliable guide 🧭 Feel free to refer to them! I sincerely hope they'll be of great help to you 🌟 👇

Current BTC Trend Analysis and Trading RecommendationsThe daily candlestick chart of BTC shows a three - day consecutive bearish retracement, having fallen back to the vicinity of the starting point of the previous pinbar rebound and currently remaining in a recent low - level sideways consolidation zone. However, the 4 - hour trend is pressured by the middle band of the Bollinger Bands, staying within a downward channel and forming a rebound - retracement wave pattern.
For short - term strategies, anticipate a further retracement first. Long positions should be initiated only after the support level is confirmed valid. This retracement represents a necessary consolidation phase before the bullish trend continues, and the current adjustment range does not pose a substantial threat of trend reversal to the overall uptrend. With the core upward trend intact and the direction remaining clear, BTC is expected to resume its upward momentum after a brief consolidation. The operational approach remains to go long on retracements.
BTCUSD
buy@103500-104000
tp:105500-106500
Investment itself is not the source of risk; it is only when investment behavior escapes rational control that risks lie in wait. In the trading process, always bear in mind that restraining impulsiveness is the primary criterion for success. I share trading signals daily, and all signals have been accurate without error for a full month. Regardless of your past profits or losses, with my assistance, you have the hope to achieve a breakthrough in your investment.

BTC/USD Potential Bullish ReversalBTC/USD Potential Bullish Reversal 🟢📈
🔍 Technical Overview:
The chart shows a potential bullish reversal pattern forming near a key support zone. Price action has consistently bounced from the support range between $100,000 – $103,700, marked by multiple higher lows (🟠 orange circles), suggesting strong buyer interest.
📌 Key Levels:
Support Zone: $100,000 – $103,700 🛡️
Immediate Resistance: $110,384 🔼
Current Price: $105,202 💰
📊 Pattern Observed:
The price structure shows a possible inverted head and shoulders pattern forming, with the right shoulder currently developing. If this structure completes and breaks the $106,000–$107,000 neckline region, we can expect a bullish breakout toward the resistance target of $110,384 or higher.
📈 Bullish Confirmation:
Bullish rejection from support area ✅
Clean structure with repeated higher lows 📈
Potential breakout arrow suggests move toward the top resistance zone
⚠️ Watch For:
Price must hold above $103,700 to maintain bullish bias
Break below this level may invalidate bullish setup and retest the broader support zone near $100,000
📌 Conclusion:
BTC/USD is setting up for a potential upside breakout if the neckline is broken. Traders should monitor for bullish confirmation before entering long positions.
🔔 Strategy Suggestion:
Buy Zone: $103,700 – $104,500 (on bullish confirmation) 🛒
Target Zone: $110,000 – $111,000 🎯
Stop-Loss: Below $103,000 🛑

BTCUSD Tests Support—Buy for ReboundBTCUSD opened high and trended lower today 📉, now approaching the support zone—time to buy directly and ride the rebound! 🚀
⚡️⚡️⚡️ BTCUSD ⚡️⚡️⚡️
🚀 Buy@ 105000 - 105500
🚀 TP 106000 - 107500
Accurate signals are updated every day 📈 If you encounter any problems during trading, these signals can serve as your reliable guide 🧭 Feel free to refer to them! I sincerely hope they'll be of great help to you 🌟 👇
BTC/USDT Long Trade Setup – 1H Chart AnalysisBTC/USDT Long Trade Setup – 1H Chart Analysis
BINANCE:BTCUSDT
Hello traders! Sharing a recent long entry I took on Bitcoin (BTC/USDT) based on price action and liquidity concepts. This trade is taken on the 1-hour timeframe and aligns with my strategy of combining liquidity sweeps, support zones, and market structure shifts.
---
🔍 Trade Overview:
Entry Price: 104,704 USDT
Stop Loss: 103,660 USDT
Take Profit (Target): 108,349 USDT
Risk-to-Reward Ratio (RRR): Approximately 1:3
---
🧠 Trade Idea Behind the Entry:
As you can see on the chart, BTC had been in a downtrend and recently made a strong move into a key liquidity zone. This zone had previously seen multiple touches and rejections, making it an area of interest for both buyers and sellers.
The price swept liquidity below the previous low (labelled as “Liquidity Sweep $$$”), grabbing stop losses of early buyers and triggering limit orders of smart money. This move into the liquidity zone was followed by a strong bullish reaction – a signal that buyers may be stepping in.
Additionally, the "Break of Structure" (BOS) confirms a potential shift in market direction. The reaction from the liquidity zone indicates that this level is holding as new support.
---
🛠️ Why I Took the Trade:
1. Liquidity Sweep: The wick that pierced the liquidity zone signals stop-hunting and accumulation. These moves often precede a strong reversal.
2. Demand Zone Reaction: After the sweep, the candle closed bullish inside the demand box. This shows buyer strength.
3. Risk Management: The stop loss is set just below the liquidity zone to protect from deeper sweeps while keeping the RR healthy.
4. High Probability Target: The target is placed near the next resistance level around 108,349, which also aligns with a clean imbalance that price may want to fill.
---
📊 Technical Confidence:
Confluence Factors:
✅ Liquidity sweep
✅ Demand zone reaction
✅ Market structure shift
✅ High RR
✅ No immediate resistance till target
This type of setup reflects smart money behavior – first pushing price below structure to grab liquidity and then reversing sharply. The bullish momentum after the sweep gave extra confirmation.
---
🧭 What I’m Watching Now:
I will continue monitoring how price reacts around the 105,500–106,000 range. If momentum continues with higher highs and higher lows, I may trail my stop loss to lock in profits.
---
Let me know what you think of this setup! Have you taken a similar trade or are you waiting for confirmation? Drop your thoughts or charts below 👇
Stay disciplined, manage your risk, and trust the process. 🚀
#Bitcoin #BTCUSD #PriceAction #LiquiditySweep #SmartMoney #CryptoTrading #TradingSetup #TechnicalAnalysis #TradeJournal

BTC Trend Analysis and Trading Recommendations for TodayThe BTC market continues its sideways-down trend, with notably insufficient rebound momentum during the session. Although there were brief signs of stabilization in the early trading, bearish forces continued to exert pressure during the European session, and the index showed a staircase decline.
From the 4-hour chart analysis, the price once fell to touch the middle Bollinger Band support during the Asian session, followed by a technical rebound. However, the rebound strength was obviously weak, encountering strong resistance near the middle band. The current candlestick pattern presents a typical Dark Cloud Cover, the MACD indicator continues to release volume below the zero axis, with fast and slow lines in bearish alignment.
Technically, the price remains significantly pressured near the middle band, and the US session is likely to extend the existing downtrend. Investors are advised to maintain a bearish stance. If the price effectively breaks below the middle band support, the next target is targeted at the lower Bollinger Band. Strategically, fading rallies remains the preferred approach.
BTCUSD
sell@106500-106000
tp:105000-104000

BTC-----Buy around 107500, target 108000-109000 areaTechnical analysis of BTC on June 16:
Today, the general trend is still relatively obvious, so the trading strategy is to buy at a low price.
Today's BTC short-term contract trading strategy:
Buy in the 107500 area, stop loss in the 106500 area, and target the 108000-109000 area;

PNUTUSDT Forming Falling WedgePNUTUSDT is presenting a compelling falling wedge pattern, signaling a high-probability bullish reversal. This technical formation typically occurs after a sustained downtrend and is characterized by converging trendlines sloping downward. In the case of PNUTUSDT, the wedge is nearing its apex, indicating that a breakout is likely imminent. The setup is further supported by healthy volume levels, adding credibility to the expected move. Historically, falling wedges often lead to explosive upside moves, and this pair is currently projecting a potential gain of 90% to 100%+ if the breakout confirms.
Market interest in PNUTUSDT is steadily growing, as indicated by rising trading activity and increased visibility across community forums and social platforms. This surge in attention aligns with the volume spike seen during recent trading sessions — a classic precursor to bullish breakouts. As more investors start to take positions in anticipation of a breakout, price momentum can accelerate rapidly, creating ideal conditions for short- to mid-term gains.
From a technical standpoint, a confirmed breakout above the wedge’s upper resistance line could open the door to rapid price expansion, especially with limited overhead resistance. Traders should watch for confirmation signals such as strong bullish candlesticks, increasing volume, or a retest of the breakout level. PNUTUSDT is shaping up as an exciting opportunity for swing traders looking to capitalize on pattern-based moves in the altcoin space.
With bullish sentiment, clear technical structure, and improving market participation, PNUTUSDT could be on the verge of a significant breakout. It’s a setup that combines strong technicals with growing investor interest — a powerful combination in crypto trading.
✅ Show your support by hitting the like button and
✅ Leaving a comment below! (What is You opinion about this Coin)
Your feedback and engagement keep me inspired to share more insightful market analysis with you!

Accumulate, BTC back above 110K💎 BTC PLAN UPDATE (June 16)
NOTABLE BITCOIN (BTC) NEWS:
Bitcoin (BTC), Ethereum (ETH), and Ripple (XRP) are showing signs of stabilization around key support levels following last week’s correction. BTC is attempting to regain momentum after closing below a critical support zone, while ETH and XRP are hovering near technical thresholds that could determine their next directional move.
TECHNICAL ANALYSIS OUTLOOK:
Bitcoin could decline further if it closes below the 50-day EMA
Bitcoin closed below its daily support at $106,406 on Thursday, then bounced back after retesting the 50-day Exponential Moving Average (EMA) at $102,893 on Friday. BTC has since stabilized around the $105,000 level over the weekend. As of Monday, it continues to consolidate, trading near $105,788.
If BTC fails to close above the $106,406 resistance level and heads lower, it may extend its decline toward the psychologically significant $100,000 level.
The Relative Strength Index (RSI) on the daily chart is hovering around the neutral 50 mark, signaling indecision among traders. Meanwhile, the Moving Average Convergence Divergence (MACD) indicator shows a bearish crossover on the daily chart, indicating selling pressure and a possible downtrend continuation.
At this stage, whether you're new or experienced, it's wise to spend more time practicing, deepening your technical analysis knowledge, and exploring educational content shared on the channel. Strengthening your foundation will help you protect your capital in this volatile environment.
==> This analysis is for trend reference only. Wishing all investors successful trades!

BTC/USD Potential Reversal & Bullish Breakout SetupBTC/USD Potential Reversal & Bullish Breakout Setup 🔄🚀
Technical Analysis Overview:
🔹 Pattern Formation:
The chart displays a potential Triple Bottom pattern (🟠), a classic reversal signal forming at the $104,870–$100,000 support zone 🛡️. This structure suggests a strong base is being established for a potential upside move.
🔹 Support Zone:
📉 The price has consistently bounced off the major support area around $100,000–$104,870, indicating strong buying interest.
🔹 Resistance Zone:
📊 The key resistance level lies around the $114,000–$115,000 range 🔵, which has been tested multiple times in the past (🔴 arrows) and could act as a future profit target.
🔹 Price Action & Projection:
Currently, price is trading near $107,025 and is showing signs of bullish continuation after forming a higher low. If the price consolidates above the $104,870 zone and holds support, we could see a potential breakout targeting the $114,000 resistance 📈.
📌 Key Takeaways:
✅ Triple Bottom formation signals trend reversal.
🔄 Bullish structure confirmed above $104,870.
🎯 Next target: $114,000 if breakout holds.
⚠️ Watch for potential consolidation before continuation.
