BTC “Golden Cross” Looms, but Geopolitics Could Delay ItBitcoin’s “Golden Cross” Looms, but Geopolitical Shocks Could Delay the Breakout
Deep dive into price action, derivatives, on-chain data, and the tug-of-war between Middle-East risk and crypto bull-run momentum
________________________________________
Table of Contents
1. Executive Summary
2. Scene-Setter: BTC at $105 K in a World on Edge
3. Technical Spark: What a Golden Cross Really Means
4. Price Action: From $103 K Dip to $106.8 K Hurdle
5. Options Market: A Sudden Lurch Toward Puts
6. Macro Overhang: Why Israel–Iran Turmoil Matters to Bitcoin
7. On-Chain Pulse: 656 % Cycle Gain, Yet Supply Is Tighter Than 2021
8. Mining Fundamentals: Difficulty Eases, Margins Improve
9. Corporate Treasuries: The Quiet, Sticky Bid
10. Targets & Scenarios: $97 K Downside vs. $229 K Upside
11. Strategy Playbook for Traders & Investors
12. Conclusion: Delayed, Not Derailed
13. Disclaimers
________________________________________
1. Executive Summary
• Bitcoin (BTC) is trading in a tight $103 K–$108 K band, unable to confirm a breakout as Middle-East tensions push investors into hedging mode.
• A Golden Cross—the 50-day SMA crossing above the 200-day—could flash within 10 trading sessions, historically adding +37 % median upside over the subsequent 90 days.
• Options flow has flipped decisively toward puts, with the 25-delta skew hitting –10 %, its most bearish since the FTX collapse, signaling short-term anxiety even as long-term bets remain bullish.
• On-chain metrics (exchange balances at six-year lows, HODLer supply at all-time highs) reveal structural demand; Glassnode notes a 656 % cycle advance despite a trillion-dollar market cap.
• Analysts’ upside targets range from $140 K (Q3) to $270 K (October) and even $229 K based on the Golden Cross fractal. Yet a clean break of $104 K support opens room to $97 K first.
________________________________________
2. Scene-Setter: BTC at $105 K in a World on Edge
Bitcoin entered 2025 with a blistering rally—spot ETFs hoovered nearly 200 K coins in four months, miners sold aggressively into strength, and macro tailwinds (Fed easing, USD weakness) fueled risk appetite. Then two macro curveballs hit:
1. Sticky U.S. core inflation revived “higher-for-longer” rate fears.
2. Israel–Iran hostilities spooked global markets, sending Brent crude to $76 and sparking a dash for USD liquidity.
BTC, once heralded as “digital gold,” behaved like a high-beta tech stock: it slipped 7 % in 48 hours, tagging $103,200 before bargain hunters stepped in. As of this writing, price sits near $105,800—right on the 100-hour SMA. Whether we escape the range depends on which force proves stronger: geopolitical dread or the long-term structural bid.
________________________________________
3. Technical Spark: What a Golden Cross Really Means
A Golden Cross occurs when the 50-day simple moving average (SMA-50) crosses above the 200-day (SMA-200). In Bitcoin’s 14-year history, we have logged nine such events:
Year Days to Cross 90-Day Return 180-Day Return
2013 51 +88 % +202 %
2015 73 +34 % +67 %
2019 46 +193 % +262 %
2020 38 +77 % +112 %
2023 59 +29 % +48 %
Median 90-day gain: +37 %
Median drawdown post-cross: –12 %
We are ~$700 shy of triggering the cross (SMA-50 at $97.9 K, SMA-200 at $98.1 K and rising). Assuming volatility stays muted, the lines converge within two weeks, potentially firing a widely watched buy signal. But remember: the cross is lagging; smart traders anticipate, not react.
________________________________________
4. Price Action: From $103 K Dip to $106.8 K Hurdle
Key intraday levels (Kraken feed):
• Support 1: $104,000 – prior weekly low + bullish order-block
• Support 2: $101,200 – 0.786 Fib retrace of the Feb–Mar impulse
• Bear Pivot: $97,000 – 200-day EMA + high-confluence volume node
• Resistance 1: $106,800 – last week’s swing high; three failed probes
• Resistance 2: $108,500 – May monthly open
• Bull Pivot: $113,000 – neckline of the March distribution range
Monday’s bounce broke a declining trend-line from $110 K, printing a higher low—constructive, yet bulls require a daily close >$106.8 K to invalidate the short-term bearish structure.
________________________________________
5. Options Market: A Sudden Lurch Toward Puts
Deribit data (largest BTC options venue):
• Put/Call Ratio: 0.62 last Friday → 0.91 today
• 25-Delta Skew (1-month): –10 %, lowest since Nov-2022
• Max-Pain for April 26 expiry: $104 K (huge open interest)
Translation: traders rushed to buy protective puts as Iran war headlines crossed. Market-makers, short those puts, delta-hedged by shorting spot or perpetual futures, adding downward pressure—classic gamma feedback loop.
Yet term structure remains contango; June and September IVs price higher topside. Institutions appear to sell near-dated panic, accumulate long-dated calls—a bullish medium-term stance.
________________________________________
6. Macro Overhang: Why Israel–Iran Turmoil Matters to Bitcoin
1. Risk-Off Correlation: Despite “digital gold” narratives, BTC’s 30-day correlation with the Nasdaq-100 sits at 0.64; equities slide → crypto follows.
2. USD Liquidity Drain: War premium lifts oil, stoking inflation and forcing the Fed to delay cuts; higher real yields pressure non-yielding assets.
3. Regulatory Optics: Heightened national-security chatter emboldens lawmakers keen to scrutinize crypto, a perceived sanctions-evasion channel.
4. Regional Flows: The Middle-East hosts some of the largest sovereign-wealth pools; risk aversion could pause their crypto allocations.
5.
Hence, every missile headline becomes a volatility catalyst. Still, flash-risk events fade quickly if energy supply stays intact, offering windows for BTC to re-assert its secular trend.
________________________________________
7. On-Chain Pulse: 656 % Cycle Gain, Yet Supply Is Tighter Than 2021
Glassnode frames Bitcoin’s ongoing bull as “one of the most explosive relative to market cap gravity.” Highlights:
• Cycle Return: 656 % from the $14 K November-2022 bottom—impressive given the asset is now >$2 T in free-float value, dwarfing 2017’s sub-$100 B base.
• Exchange Balances: Just 2.02 M BTC on centralized venues—13-year low.
• Realized Price (short-term holders): $92,500—suggests marginal buyers remain well in profit.
• Entity-Adjusted Dormancy Flow: At 275 K BTC/day vs. 2021’s 550 K—implying HODLers are less willing to spend.
Put simply: even after a seven-fold rally, supply scarcity persists.
________________________________________
8. Mining Fundamentals: Difficulty Eases, Margins Improve
The April 20 adjustment saw difficulty dip 1.2 %, the first contraction since January. Why it matters:
• Post-Halving Breathing Room: Block subsidy fell to 1.5625 BTC; a difficulty rollback cushions miner profit margins, lowering forced selling risk.
• Hashrate Plateau: Network hashrate hovers at 640 EH/s, only 3 % off the ATH—miners remain confident.
• Transaction Fees: Average fee per block = 0.37 BTC, still elevated by historical standards thanks to BRC-20 activity.
Miners thus appear cash-flow stable, reducing downside pressure on spot markets compared to previous post-halving eras.
________________________________________
9. Corporate Treasuries: The Quiet, Sticky Bid
Since MicroStrategy cracked the dam, 68 public companies now hold BTC on balance sheets, totaling 412,000 coins (~$43 B). Recent newcomers:
Company Purchase Date BTC Added Avg Cost
SemiconX Feb-2025 2,500 $94,800
Nordic Logistics Mar-2025 800 $98,200
Atlantech Energy Apr-2025 1,200 $101,500
Traits of corporate treasuries:
• Long-Dated Liabilities: Align with Bitcoin’s four-year halving cadence.
• Low Turnover: None of the 68 have sold core holdings despite 80 % drawdowns in 2022.
• Regulatory Transparency: SEC filings broadcast purchases, inviting copycat demand.
This sticky bid stabilizes spot markets during macro squalls.
________________________________________
10. Targets & Scenarios: $97 K Downside vs. $229 K Upside
Bearish Path (30 % probability)
• Trigger: Israel–Iran broadens, Fed signals no cuts in 2025.
• Price Action: Break $104 K, bulls capitulate at $97 K (200-day).
• Depth: Could wick to $88–90 K (0.618 retrace) if macro gloom persists.
Base Case (50 % probability)
• Trigger: Skirmishes contained; oil cools, Fed cuts twice by December.
• Price Action: Golden Cross confirms, BTC grinds to $128 K by September.
• Highs: $140 K tap as ETF inflows resume.
Bullish Path (20 % probability)
• Trigger: Middle-East cease-fire + ETF FOMO round two + dovish Fed pivot.
• Fractals: Prior Golden-Cross extensions averaged +120 % at extreme.
• Price Action: $150 K by summer, $229 K (Fib 2.618 from 2022 low) by year-end.
• Blow-Off: $270 K October spike before the next cyclical bear begins.
________________________________________
11. Strategy Playbook for Traders & Investors
Horizon Bias Instruments Risk Management
Intraday (0–48 h) Range scalp $104–$107 K Perp futures (5× max), options gamma scalping Hard stop $103 K; position <1 % equity
Swing (2–8 wks) Buy pullbacks ahead of Golden Cross Spot, dated futures roll, 1-month $110 K calls Stop $97 K daily close; size 5–10 %
Position (3–6 mo) Accumulate for $140–150 K target Spot, June/Sept call spreads ($120/150) Hedge via 25 % put collar
Long-Term (1–4 yr) Maintain core stash; ignore noise Cold storage, DCA Re-balance only when price doubles
Optional hedge: Long Gold / Short BTC ratio spread as a geopolitical shock absorber; ratio 1.3 currently, mean-reverts to 1.1 post-crises.
________________________________________
12. Conclusion: Delayed, Not Derailed
Bitcoin stands at a crossroads: a textbook Golden Cross beckons, ETF inflows smolder, miners relax, and corporate treasuries drip-feed demand. Yet war headlines and a cautious options market act as sandbags on the balloon. History says macro shocks slow, not stop secular bull cycles. Unless Middle-East conflict strangles global liquidity or the Fed slams the brakes far harder than priced, BTC’s higher-time-frame structure remains bullish. Expect turbulence, embrace risk controls—but don’t mistake a weather delay for a busted engine.
________________________________________
13. Disclaimers
This article is for educational purposes only and does not constitute financial advice. Cryptocurrency investing involves substantial risk; never invest more than you can afford to lose.
Btcusdbuy

THEUSDT Forming Falling Wedge BullishTHEUSDT is showcasing a strong technical breakout from a falling wedge pattern, a formation widely regarded as bullish in the world of crypto trading. This structure typically signals the end of a downtrend and the potential start of a strong upward movement. With price action now breaching the wedge’s upper resistance line and confirming bullish momentum, this breakout opens up the possibility for an explosive rally. Current projections point to a potential gain of 90% to 100%+, making it one of the more attractive setups among altcoins.
The volume is also confirming the breakout, suggesting that traders and investors are actively entering positions. This increase in participation often fuels further upward movement, especially when combined with a technically significant chart pattern like this. THEUSDT is not only displaying strength on the technical side, but also showing promising signals from investor sentiment, with more eyes turning toward this project across social platforms.
Price targets for this setup are derived from the height of the wedge and historical resistance zones. As seen in the chart, the upside potential could push THEUSDT toward the $0.50–$0.65 range, where previous liquidity zones may come into play. With altcoins heating up and capital rotating into high-upside plays, THEUSDT’s setup offers an excellent risk-to-reward profile at this stage.
Traders should monitor volume continuation and possible retests of the breakout zone as confirmation. With the broader market recovering and interest returning to promising altcoins, THEUSDT stands out as a potential leader in the next bullish wave.
✅ Show your support by hitting the like button and
✅ Leaving a comment below! (What is You opinion about this Coin)
Your feedback and engagement keep me inspired to share more insightful market analysis with you!

Middle East Tensions Drive Capital Shift: BTC May Test 100K SupCurrently, we can clearly see that BTC is in a downward trend 🔻. Due to the tense situation in the Middle East 😰, a large amount of capital has flowed into gold and crude oil markets. BTCUSD is likely to continue its downward movement on Monday ⬇️. Let's focus on the support level at 100,000. If it breaks below 100,000, it may continue to decline ⚠️.
⚡️⚡️⚡️ BTCUSD ⚡️⚡️⚡️
🚀 Sell@ 106500 - 105500
🚀 TP 102000 - 101000
Accurate signals are updated every day 📈 If you encounter any problems during trading, these signals can serve as your reliable guide 🧭 Feel free to refer to them! I sincerely hope they'll be of great help to you 🌟 👇

BTC/USDTWhenever Bitcoin goes above 106k, we can enter a long position at the target I specified on the chart. What do you think? Tell me.

BTCUSDT Trend Analysis and Trading RecommendationsToday's overall BTC market rebounded after hitting a low of 102,614 in the early trading session, with Bitcoin's price maintaining a slow upward trend throughout the day. The intraday high reached 105,912 but encountered resistance. As the weekend approaches, historical market data shows limited volatility during weekends, so range-bound fluctuations are expected for the weekend.
From the current overall market rhythm, the price has rebounded slightly today after the previous decline. The hourly chart shows consecutive upward candles, though the price movement remains relatively slow. As time progresses, the price is expected to sustain an upward trend after pullbacks, and breaking through the short-term resistance level is only a matter of time. In terms of short-term structure and pattern, despite slight resistance and minor pullbacks, the downward momentum has weakened. We can still focus on long positions at lower levels, paying attention to the 106,000 resistance level.
BTCUSD
buy@104000-104500
tp:106000-107000
Investment itself is not the source of risk; it is only when investment behavior escapes rational control that risks lie in wait. In the trading process, always bear in mind that restraining impulsiveness is the primary criterion for success. I share trading signals daily, and all signals have been accurate without error for a full month. Regardless of your past profits or losses, with my assistance, you have the hope to achieve a breakthrough in your investment.

Current BTC Trend Analysis and Trading RecommendationsToday's overall BTC market rebounded after hitting a low of 102,614 in the early trading session, with Bitcoin's price maintaining a slow upward trend throughout the day. The intraday high reached 105,912 but encountered resistance. As the weekend approaches, historical market data shows limited volatility during weekends, so range-bound fluctuations are expected for the weekend.
From the current overall market rhythm, the price has rebounded slightly today after the previous decline. The hourly chart shows consecutive upward candles, though the price movement remains relatively slow. As time progresses, the price is expected to sustain an upward trend after pullbacks, and breaking through the short-term resistance level is only a matter of time. In terms of short-term structure and pattern, despite slight resistance and minor pullbacks, the downward momentum has weakened. We can still focus on long positions at lower levels, paying attention to the 106,000 resistance level.
BTCUSD
buy@104000-104500
tp:106000-107000
Investment itself is not the source of risk; it is only when investment behavior escapes rational control that risks lie in wait. In the trading process, always bear in mind that restraining impulsiveness is the primary criterion for success. I share trading signals daily, and all signals have been accurate without error for a full month. Regardless of your past profits or losses, with my assistance, you have the hope to achieve a breakthrough in your investment.

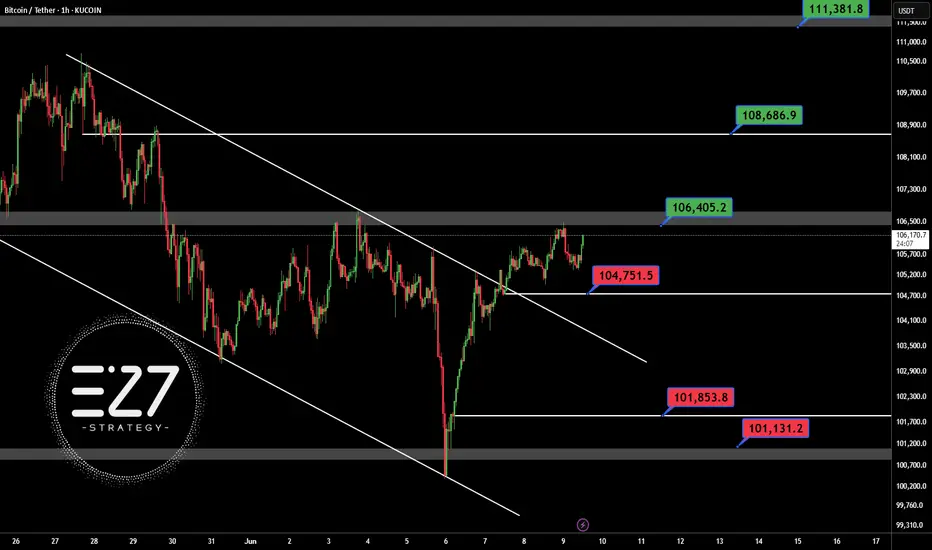
BTCUSDTSafe for open long position in BINANCE:BTCUSDT abow 106.400$ in H1 time frame.
First support: 104.750$
Best support: 101.850 - 101.131 $
First resistance: 106.400$
Best target this chart: 108.700 - 111.381$
Contol money management
BTCUSD Hey everyone,
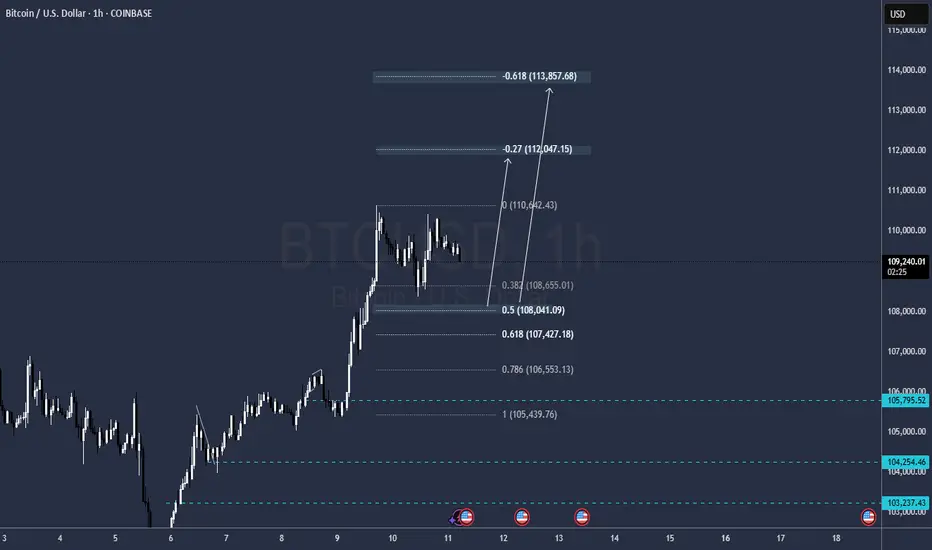
Taking a closer look at the BTCUSD chart, I've plotted some interesting price levels that could act as significant support and resistance in the coming weeks. This analysis aligns with what appears to be a trend-based Fibonacci time analysis, and I've also marked some crucial dates where we might see major market changes.
Based on our observations, we're seeing a range of important price action. For instance, notice the cluster of highs around the 112,048 to 113,343 area. These levels, particularly those marked with an asterisk such as 112,167, 112,503, and 113,006, have previously shown strong upward movements, suggesting they could serve as notable resistance if price attempts to push higher.
Conversely, on the downside, the levels from 111,952 down to 110,665, with points like 111,833, 111,499, and 110,832 highlighted, have historically seen bounces or significant slowing of downward momentum. These could very well act as crucial support areas, preventing further declines.
As we move forward, it will be crucial to observe how price interacts with these levels, especially around the following dates where we might see major market shifts:
July 4th, 2025
July 11th, 2025
July 26th, 2025
August 9th, 2025
August 16th, 2025
September 9th, 2025
The higher resistance points reaching up to 118,793 and lower support extending to 105,407 define a broader range we'll be watching closely.
Keep an eye on these zones for potential reversals or breakthroughs, particularly around the dates mentioned, which could signal the next significant move for Bitcoin. As always, manage your risk accordingly.
What are your thoughts on these levels and potential turning points? Share in the comments below!
Want to Level Up?
Join Shunya Trade’s Mentoring Program to master these strategies and sharpen your technical analysis skills.
Your Feedback Matters!
Let me know how this analysis works for you—your insights will shape future reports!
Let’s navigate the markets together—wisely and proactively.
Trade safely!
⚠️ Disclaimer: This post is educational content and does not constitute investment advice, financial advice, or trading recommendations. The views expressed here are based on technical analysis and are shared solely for informational purposes. The stock market is subject to risks, including capital loss, and readers should exercise due diligence before investing. We do not take responsibility for decisions made based on this content. Consult a certified financial advisor for personalized guidance.
Price High Price Low
112048 111952
112084 111916
*112167 *111833
*112335 *111666
*112503 *111499
*112670 *111332
*112838 *111165
*113006 *110998
*113174 *110832
*113343 *110665
114017 110001
*114693 *109339
115372 108678
116052 108020
116734 107364
*117419 *106709
118105 106057
118793 105407

Evening BTC Trend Analysis and Trading RecommendationsDuring the morning session, the Bitcoin price continued its upward momentum from the previous night, surging to an intraday high of 110,653. Subsequently, as bullish momentum gradually waned, the price entered a volatile downward channel. Consecutive bearish candles triggered a significant retracement of earlier gains. In the afternoon, supported by the hourly moving average, Bitcoin saw a brief rebound, climbing to 109,852 as U.S. stocks opened. However, bears quickly regained control, pushing the price down to 108,282 before stabilizing, after which it entered horizontal consolidation. The current price remains around 109,000. Notably, our previous short strategy at 109,800 precisely aligned with the trend, successfully realizing the expected profit.
Current trading advice: Consider light short positions within 109,400–109,700, targeting around 108,500. If the price effectively holds support and stabilizes at 108,500, you may attempt light long positions to speculate on a rebound.
BTCUSD
sell@109400-109700
tp:108500-107500

Last week Bitcoin created massive liquidity at a key resistance!🚨 Bitcoin Update – A Bullish Storm Is Brewing? 💥
Last week, Bitcoin created massive liquidity at a key resistance zone, and guess what? That liquidity is still untouched. The market hasn’t fully tapped into it yet — and that’s a big deal.
Recently, BTC smashed through resistance and even left behind a Bullish Fair Value Gap (FVG), signaling strength. But hold on—after this breakout, the market is showing signs of a minor pullback, likely to retest its marked IRL (Important Reaction Level).
📉 It’s cooling off temporarily... but don’t blink. This zone could act as a springboard for the next big leg up.
💡 Here’s the kicker: there’s still a ton of liquidity waiting above. If the market wants it—and it usually does—there’s a high probability (80%+) of another bullish push.
👀 Watch this area closely. It’s a make-or-break zone.
📊 Do Your Own Research (DYOR) – this is not financial advice, just a friendly nudge from the charts.

BTC/USD 4H Trade Setup – Demand Zone Reversal Play🔵 1. Demand Zone 🧲💎
📍 Range: 100,418.83 – 102,253.51
🟦 Strong support zone
💡 This is where buyers are expected to step in
📉 Price is currently testing this zone — potential reversal area
🚀 2. Entry Point 🎯
📍 Zone: 102,232.52 – 102,264.33
✅ Just above demand zone for safe entry
🧘♂️ Wait for bullish confirmation (wick rejections, engulfing candles)
🛑 3. Stop Loss 🔻
📍 Zone: 100,498.77 – 100,538.74
🔒 Below demand zone — protects you from false breakouts
⛔ Invalidates setup if price breaks below this level
🎯 4. Target Point 💰
📍 Target: 108,800.00
🧱 Major resistance zone
📈 Offers a solid Risk/Reward setup (approx. 1:4)
🪜 Possible take-profit scaling around 108,656.78 – 109,256.50
🔁 5. CHoCH – Change of Character 🔄
📍 Confirmed structural break above a lower high
🕵️♂️ Indicates shift from bearish to bullish
🔁 Needs confirmation with higher low near demand zone
📏 6. EMA 70 (Exponential Moving Average) 📉
📍 Level: 106,849.30
🔴 Price is currently below EMA = short-term bearish
🧗♂️ Reclaiming the EMA will strengthen the bullish bias
✅ Quick Summary with Emojis
📌 Plan:
🔵 Buy near: 102,250
🛑 Stop Loss: 100,500
🎯 Take Profit: 108,800
📊 Trend:
🔻 Bearish short-term (below EMA)
🔁 Potential reversal from demand zone
⚠️ Watch For:
🔍 Bullish confirmation at demand zone
🔄 Reclaim of EMA (106.8k)
🧱 Resistance near 108.8k

BTC-----Sell around 109500, target 108500 areaTechnical analysis of BTC contract on June 11:
Today, the large-cycle daily level closed with a small positive line yesterday, and the K-line pattern continued to rise. The price was above the moving average. The attached indicator was golden cross. The general trend of the rise was relatively obvious, but it should be noted that the large upward trend last week caused the current daily price to deviate from the moving average. Then the return to the moving average is a correction and retracement trend. The support position is near the 107000 area, so pay attention to avoid the risk of retracement; the short-cycle hourly chart yesterday's intraday retracement correction European session continued the US session support rebound, but did not break the previous high position. Today, the current pressure retracement, the K-line pattern continued to be negative, so the intraday still has to go through the retracement trend, the low point support position is 108300 area;
BTC short-term contract trading strategy:
sell at the current price of 109500, stop loss in the 110000 area, and the target is near the 108500 area;

BTC alternative scenarioThis Scenario is Possible,not a big fan of it but if I get a reaction on the level will go for a buy with small risk
levels highlighted
BITCOIN chart updated Bitcoin Buy Signal Triggered ₿🚀
BTC showing strong bullish momentum after holding key support.
Entered long position on breakout above short-term resistance with volume confirmation.
Higher lows forming a solid base — structure favors continued upside.
Targeting the next resistance zone around , with stop loss below recent swing low.
Watching closely for follow-through and potential scaling opportunities.
Market sentiment improving — let's see if the bulls can take control.
#Bitcoin #BTCUSD #CryptoTrading #BuyTheDip #BreakoutTrade #CryptoSetup #BullishBias #PriceAction #TechnicalAnalysis"**

#BTC/USDT#BTC
The price is moving within a descending channel on the 1-hour frame, adhering well to it, and is heading for a strong breakout and retest.
We are experiencing a rebound from the lower boundary of the descending channel. This support is at 108883.
We have a downtrend on the RSI indicator that is about to be broken and retested, supporting the upward trend.
We are looking for stability above the 100 Moving Average.
Entry price: 109380
First target: 109948
Second target: 110800
Third target: 111670

Today's Bitcoin Signal: Time to be braveHello friends🙌
Given the good price movement from support and buyers entering, now we can enter the position with capital and risk management and move with it to the specified targets.
🔥Join us for more signals🔥
*Trade safely with us*

Analysis of the Current BTCUSD Trend and Trading RecommendationsFrom a technical perspective, the bearish trend in BTC is temporarily dominant. On the four-hour chart, the price has trended downward with consecutive negative candles after being pressured, clearly indicating a bearish trend. Although small lower shadows suggest that bulls and bears are still locked in a tug-of-war, the RSI indicator is near the overbought zone at 70, and while the MACD remains positive, its momentum continues to weaken—both signals imply insufficient upward momentum and lingering adjustment pressure.
On the hourly chart, BTC has entered a consolidation phase with alternating positive and negative candles after a unilateral downward move. Currently, the Bollinger Bands are narrowing and moving sideways, indicating that future volatility may be limited. The price is now hovering near the upper band of the range, facing technical resistance.
In terms of the afternoon trading strategy, given the bearish dominance and fading upward momentum, the focus should remain on shorting at highs. Aggressive traders can lightly position for short-term rebounds but must use small positions and set strict stop-losses; prudent traders should wait patiently for higher levels to initiate short positions.
BTCUSD
sell@109800-110300
tp:108500-107500
Investment itself is not the source of risk; it is only when investment behavior escapes rational control that risks lie in wait. In the trading process, always bear in mind that restraining impulsiveness is the primary criterion for success. I share trading signals daily, and all signals have been accurate without error for a full month. Regardless of your past profits or losses, with my assistance, you have the hope to achieve a breakthrough in your investment.

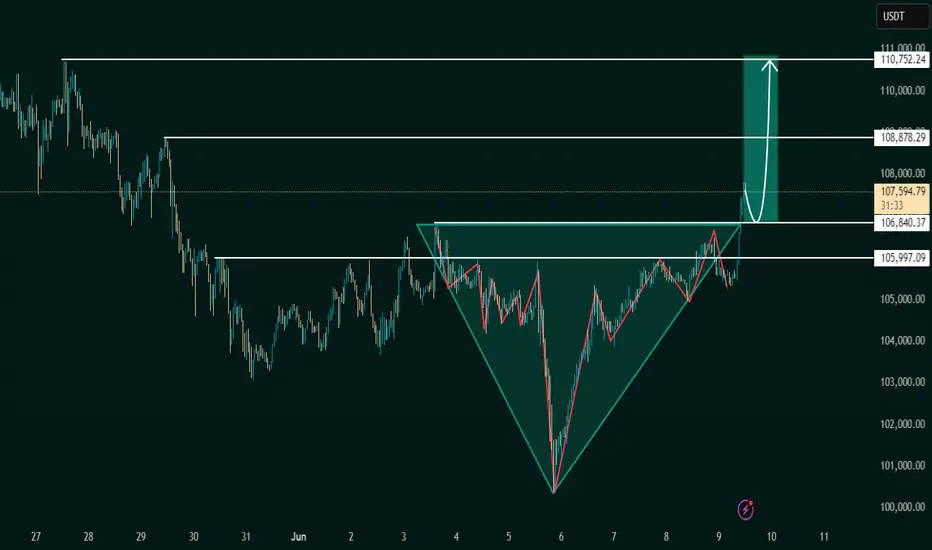
Inverse Head and Shoulders Breakout Signals BullishThe chart under review presents a classic Inverse Head and Shoulders pattern, a reliable and widely recognized bullish reversal formation in technical analysis. This structure typically forms after a downtrend, indicating a potential shift in market sentiment from bearish to bullish.
The pattern is composed of:
Left Shoulder: A modest price decline followed by a temporary upward correction.
Head: A deeper price decline forming the lowest point in the pattern.
Right Shoulder: A higher low that mirrors the left shoulder, followed by another upward movement.
The neckline, which acts as a critical resistance level, is clearly illustrated at approximately 106,840.37 USDT. A confirmed breakout above this neckline suggests the completion of the reversal pattern and validates the potential for a sustained bullish movement.
2. Breakout Confirmation
The current price action confirms a successful breakout above the neckline, with the market currently trading around 107,586.58 USDT. This breakout is a key signal for bullish continuation, provided it is supported by increased volume and follow-through price action.
From a technical standpoint, the breakout is reinforced by:
A clean violation of neckline resistance
Price consolidation near breakout zone before a strong upward thrust
Higher lows preceding the breakout, indicative of growing buying pressure
This confluence of technical signals strengthens the case for an upward price trajectory in the near term.
3. Projected Price Targets
Upon confirmation of the Inverse Head and Shoulders breakout, target levels can be derived using the measured move technique. This involves projecting the vertical distance from the head to the neckline upward from the breakout point.
Target 1 (Initial Resistance):
108,878.29 USDT – This level represents a potential short-term resistance where price may consolidate or retrace slightly before continuing.
Target 2 (Measured Move Completion):
110,752.24 USDT – This is the ultimate price target derived from the height of the head-to-neckline structure. Reaching this level would represent the full realization of the reversal pattern.
4. Key Support and Risk Levels
Risk management is a critical component of any trading strategy. The following support levels should be closely monitored:
106,840.37 USDT (Neckline Support):
Former resistance turned support. Holding above this level post-breakout is essential for sustaining bullish momentum.
105,997.09 USDT:
Acts as a secondary support level and potential stop-loss region for conservative traders.
If price fails to hold above the neckline and falls back below these levels, the breakout could be classified as a false breakout, warranting caution.
5. Strategic Implications for Traders
This setup provides a favorable risk-to-reward ratio for long entries, particularly for traders seeking to capitalize on momentum-based patterns. An optimal trading approach could involve:
Entry: Near the neckline breakout or on a minor retest of 106,840.37 USDT
Stop-Loss: Below 105,997.09 USDT or under the right shoulder to account for volatility
Take-Profit Zones: Partial profits near 108,878.29 USDT, with final target at 110,752.24 USDT
6. Final Remarks
This chart illustrates a textbook example of a bullish reversal pattern in play. While the technical outlook is favorable, traders should remain cautious of potential invalidation scenarios, especially in highly volatile or news-driven markets. Confirmation through volume analysis and supportive macro/fundamental conditions can further enhance confidence in the bullish thesis.
Overall, the current setup indicates a well-structured opportunity for upward price movement, with a clearly defined entry, risk, and reward framework.
Let me know if you'd like this tailored for a trading journal, client report, or automated strategy setup
BTC 4H – Critical Support Zones Being TestedCRYPTOCAP:BTC is currently retesting its $107.2k support, which has now turned into resistance after a decisive breakdown.
Support Levels to Watch:
- Upper Support Zone: $105k – $104.4k
- Lower Support Zone: $101.4k – $100.7k
Bounce from $104.4k–$105k will be a temporary relief, but it needs strength to reclaim $107.2k.
If the upper zone is not held, the next leg will be towards the lower zone, near $101.4k—$100.7k.
Breakout confirmation only above $110k (previous rejection zone).
The market is showing signs of weakness, especially with increased selling around resistance. Avoid rushing into trades—better setups may come if key zones hold or break.
Tip: Watch for bullish divergences or strong volume at the lower support for potential reversal setups.

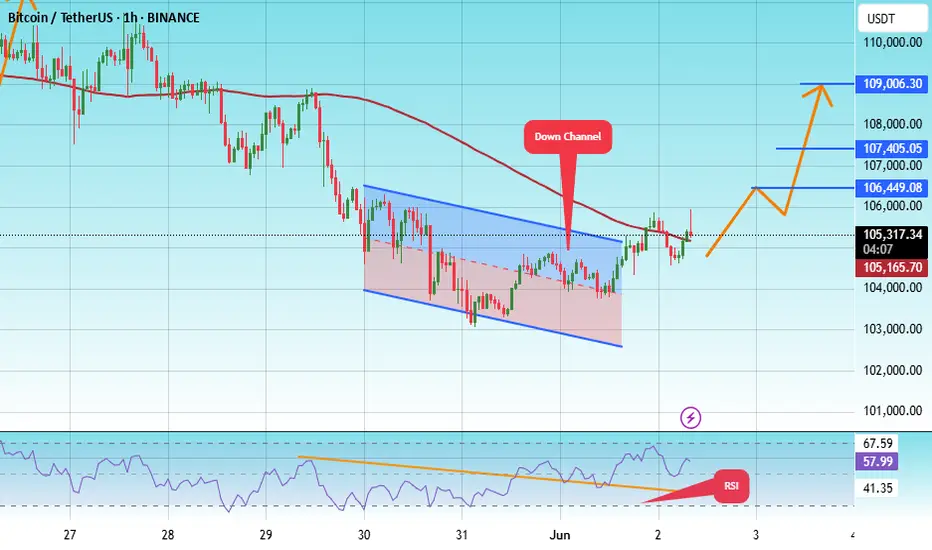
#BTC/USDT#BTC
The price is moving within a descending channel on the 1-hour frame, adhering well to it, and is heading for a strong breakout and retest.
We are experiencing a rebound from the lower boundary of the descending channel, which is support at 103141.
We are experiencing a downtrend on the RSI indicator, which is about to break and retest, supporting the upward trend.
We are looking for stability above the 100 moving average.
Entry price: 105268
First target: 106500
Second target: 107405
Third target: 109006
Bitcoin Breaks Out: Bullish Momentum Builds Above Key LevelsHello guys!
The chart of Bitcoin reveals a significant bullish breakout, characterized by two key technical developments:
Broken Ascending Channel:
Bitcoin was trading within an ascending parallel channel, gradually making higher highs and higher lows. This channel was recently breached to the downside, suggesting a temporary weakening in momentum.
False Breakdown and Strong Reversal:
Despite the initial breakdown from the channel, Bitcoin swiftly reversed and surged upwards, reclaiming previous support levels with strong bullish candles. This “fake-out” move often traps bears and reinforces bullish sentiment.
Trendline Breakout:
More notably, BTC has broken above a descending trendline, which had acted as a resistance zone. This breakout, backed by strong volume and momentum, indicates a shift in market structure from consolidation to potential expansion.
Projected Upside Target:
Based on the breakout projection drawn on the chart, the next major resistance appears near the $109,600 level. This aligns with the upper purple dashed line, which may represent a historical resistance zone or a Fibonacci extension.

Bitcoin Price: HODL Mode Fuels $140K ATH PushBitcoin, the pioneering cryptocurrency, is once again at the forefront of financial discussions, exhibiting a remarkable display of resilience and strength that points towards an imminent surge to uncharted price territories. The current market narrative is dominated by several compelling indicators: a significant increase in long-term holders, a climbing realized capitalization, the inherent stability provided by its difficulty adjustment mechanism, and a pervasive return to "HODL mode" among investors. These factors, combined with recent price action and expert analyses, suggest that Bitcoin is not just preparing for new all-time highs but is solidifying its position as a mature and indispensable asset in the global financial landscape.
Long-Term Holders Strengthen Their Grip: A Foundation for Future Growth
One of the most telling indicators of Bitcoin's underlying strength and investor conviction is the behavior of its long-term holders (LTHs). These are addresses that have held their Bitcoin for an extended period, typically over 155 days, signaling a strong belief in its future value rather than short-term speculation. Recent data reveals a significant uptick in the number of these steadfast investors, indicating a profound shift in market sentiment. This trend is critical because it removes a substantial portion of the circulating supply from immediate selling pressure, creating a scarcity that naturally supports price appreciation.
The "HODL mode" phenomenon, a term coined from a misspelling of "hold" in a 2013 forum post, perfectly encapsulates this behavior. It describes the strategy of buying and holding cryptocurrencies regardless of price fluctuations, driven by a long-term bullish outlook. The return of this "HODL mode" is not merely anecdotal; it is quantifiable through on-chain metrics. When long-term holders accumulate and resist selling, it signifies a collective conviction that current prices do not reflect Bitcoin's true intrinsic value or future potential. This behavior creates a strong psychological floor for the price, as fewer coins are available for sale on exchanges, making it harder for large sell-offs to occur.
Complementing this, Bitcoin's Realized Cap has been climbing to uncharted territory. The Realized Cap is a variation of market capitalization that values each Bitcoin at the price it was last moved on-chain, rather than its current market price. It essentially represents the aggregate cost basis of all coins in circulation. When the Realized Cap climbs, especially to new all-time highs, it indicates that a significant amount of Bitcoin has been acquired at higher prices and is being held, suggesting that the overall market is holding onto its coins with stronger conviction. This metric serves as a robust measure of the network's fundamental value and the collective cost basis of its investors. Its ascent to new peaks underscores the increasing capital flowing into Bitcoin and the growing confidence among those holding it. This phenomenon is often observed during bull markets, as new capital enters the ecosystem and existing holders refuse to sell, signaling a healthy and maturing market.
The strengthening grip of long-term holders and the rising Realized Cap collectively paint a picture of a market that is fundamentally sound and poised for sustained growth. It suggests that Bitcoin is moving from a speculative asset to a more mature store of value, attracting investors who are less concerned with short-term volatility and more focused on its long-term potential as a digital asset.
Bitcoin's Difficulty Adjustment: The Engine of Predictable Monetary Policy
One of Bitcoin's most ingenious and often underestimated features is its difficulty adjustment mechanism. This self-regulating system ensures that new blocks are found, and thus new Bitcoin are mined, at a remarkably consistent rate of approximately every 10 minutes, regardless of the total computational power (hash rate) dedicated to the network. Every 2,016 blocks, or roughly every two weeks, the network automatically adjusts the difficulty of the mining puzzle. If more miners join the network, increasing the hash rate, the difficulty increases, making it harder to find the next block. Conversely, if miners leave, the difficulty decreases.
This mechanism is the bedrock of Bitcoin's predictable monetary policy. Unlike traditional fiat currencies, whose supply can be arbitrarily increased by central banks, Bitcoin's supply schedule is immutable and transparent. The difficulty adjustment ensures that the issuance of new Bitcoin remains consistent until the total supply of 21 million coins is reached. This predictability is a cornerstone of Bitcoin's value proposition as a sound money alternative. It eliminates the uncertainty and potential for inflation that plagues fiat currencies, making Bitcoin a reliable store of value over the long term.
The consistent block time and predictable supply schedule, enforced by the difficulty adjustment, contribute significantly to Bitcoin's appeal as a deflationary asset. Investors are drawn to assets with a finite and transparent supply, especially in an era of unprecedented global monetary expansion. This mechanism not only secures the network from external attacks by making it prohibitively expensive to manipulate but also instills confidence in its long-term scarcity and value. It is this algorithmic certainty that underpins Bitcoin's potential to become a global reserve asset, providing a stark contrast to the discretionary policies of central banks.
Why are Bitcoin and Crypto Prices Going Up Today?
The recent surge in Bitcoin and broader cryptocurrency prices can be attributed to a confluence of factors, many of which are interconnected with the underlying strength discussed above. Bitcoin's impressive climb past $107,000 and its break above $108,000 at the start of the week are not isolated events but rather manifestations of building bullish sentiment.
One primary driver is the return of institutional interest and capital inflows. As Bitcoin matures and gains regulatory clarity in various jurisdictions, traditional financial institutions are increasingly comfortable allocating capital to the asset class. This institutional adoption provides significant buying pressure and lends legitimacy to the market. The establishment of Bitcoin ETFs in various regions, for instance, has opened new avenues for institutional investors to gain exposure without directly holding the underlying asset.
Secondly, the macroeconomic environment continues to play a pivotal role. Persistent inflation concerns, coupled with the potential for further quantitative easing by central banks, drive investors towards scarce assets like Bitcoin as a hedge against currency debasement. The narrative of Bitcoin as "digital gold" gains traction during periods of economic uncertainty, attracting both retail and institutional capital seeking to preserve purchasing power.
Thirdly, technical indicators are flashing strong buy signals. Bitcoin's weekly chart, for instance, is flexing significant strength. A sustained break above key resistance levels, such as the $108,000 mark, often triggers further buying as traders and algorithms recognize the bullish momentum. The return of "HODL mode," as evidenced by the behavior of long-term holders, further reduces selling pressure, allowing prices to climb with less resistance. This combination of fundamental strength and technical breakouts creates a powerful upward spiral.
Finally, anticipation of future events also fuels price rallies. The upcoming June 11 CPI report, for example, is being closely watched by analysts. Inflation data can significantly impact market sentiment, and a favorable report (e.g., lower-than-expected inflation) could signal a more dovish stance from central banks, potentially leading to increased liquidity and risk-on appetite, which benefits Bitcoin. An analyst has even suggested that the Bitcoin price could "explode" after the CPI report, indicating the market's sensitivity to such macroeconomic releases.
Bitcoin Chart Pattern, Return of ‘HODL Mode’ Point to Imminent All-Time BTC Price High
The technical analysis of Bitcoin's price charts, combined with on-chain data indicating a return to "HODL mode," strongly suggests that an imminent all-time high (ATH) is on the horizon. Chart patterns are crucial tools for traders and investors to identify potential future price movements based on historical data. When Bitcoin breaks above significant resistance levels, especially after a period of consolidation, it often signals the start of a new upward trend. The recent break above $108,000 is a prime example of such a breakout, indicating that the market has absorbed previous selling pressure and is now ready for higher valuations.
The "HODL mode" phenomenon, as discussed earlier, is a powerful fundamental indicator that reinforces technical signals. When a large proportion of the circulating supply is being held by long-term investors who are unwilling to sell, it creates a supply shock. This reduced selling pressure means that even moderate buying interest can lead to significant price increases. This is particularly true when new capital enters the market, as it encounters a much thinner order book on the sell side. The confluence of a bullish chart pattern and the return of "HODL mode" creates a self-reinforcing cycle: technical breakouts encourage more HODLing, which in turn reduces supply and facilitates further breakouts.
Analysts are increasingly confident that these combined factors point to an imminent all-time high for BTC. The previous all-time high serves as a psychological and technical barrier, but once breached, it often transforms into a new support level, paving the way for further price discovery. The current market structure, characterized by strong accumulation by long-term holders and a clear upward trajectory on the charts, suggests that the path of least resistance for Bitcoin is upwards.
Bitcoin Weekly Chart Flexes Strength—Is The Moonshot Just Getting Started?
Looking at Bitcoin's weekly chart provides a broader perspective on its long-term trend and current momentum. The weekly chart smooths out daily volatility, revealing more significant patterns and trends. Currently, Bitcoin's weekly chart is indeed flexing considerable strength, characterized by consistent higher lows and higher highs, strong closing prices, and increasing trading volume during upward movements. This sustained bullish momentum on a longer timeframe suggests that the current rally is not a fleeting pump but potentially the beginning of a more substantial "moonshot."
The term "moonshot" in crypto parlance refers to a rapid and significant price increase, often to unprecedented levels. While such parabolic moves can be speculative, the current strength on Bitcoin's weekly chart appears to be fundamentally driven. The accumulation by long-term holders, the predictable supply schedule enforced by the difficulty adjustment, and the increasing institutional adoption all contribute to a more sustainable upward trajectory. This is not just about short-term trading gains; it's about a fundamental revaluation of Bitcoin's role in the global financial system.
The question of whether the "moonshot" is just getting started implies that the current price levels are merely a stepping stone to much higher valuations. This perspective is supported by the fact that Bitcoin is still in its relatively early stages of global adoption compared to traditional asset classes. As more individuals, corporations, and even nation-states begin to integrate Bitcoin into their financial strategies, the demand will continue to outstrip the limited supply, fueling further price appreciation. The weekly chart's strength provides a visual confirmation of this underlying bullish narrative, suggesting that the journey to new price frontiers is indeed well underway.
Bitcoin Price Could Explode After June 11 CPI Report, Says Analyst
The highly anticipated June 11 CPI (Consumer Price Index) report is poised to be a significant catalyst for Bitcoin's price action. The CPI is a key economic indicator that measures the average change over time in the prices paid by urban consumers for a market basket of consumer goods and services. It is a primary gauge of inflation, and its release often triggers significant market reactions across all asset classes, including cryptocurrencies.
An analyst's prediction that Bitcoin's price could "explode" after the CPI report highlights the market's sensitivity to inflation data. If the CPI report comes in lower than expected, it could signal that inflationary pressures are easing, potentially leading central banks to adopt a more dovish monetary policy (e.g., interest rate cuts). Lower interest rates reduce the opportunity cost of holding non-yielding assets like Bitcoin, making them more attractive to investors. Conversely, if inflation remains stubbornly high, it could reinforce Bitcoin's narrative as an inflation hedge, also potentially driving its price up as investors seek refuge from fiat currency debasement.
The market's reaction to such reports is often driven by expectations. If the report aligns with or exceeds dovish expectations, it could lead to a surge in liquidity and risk appetite, benefiting Bitcoin. Conversely, an unexpectedly hawkish report could lead to short-term volatility. However, the overarching sentiment among many analysts is that even in a hawkish scenario, Bitcoin's role as a hedge will continue to attract capital. The June 11 CPI report is therefore a critical event that could provide the immediate impetus for Bitcoin's next major price movement, potentially validating the "moonshot" thesis.
Bitcoin Price Will See ‘Short-Term Correction’ Before $140K: Analysts
While the overall sentiment for Bitcoin is overwhelmingly bullish, some analysts predict a "short-term correction" before the price initiates a rally to all-time highs above $140,000. This perspective is not necessarily bearish; rather, it reflects a healthy market dynamic. Corrections are a natural part of any asset's price discovery process, allowing the market to consolidate gains, shake out overleveraged positions, and attract new buyers at slightly lower price points.
A short-term correction typically involves a temporary pullback in price after a significant upward move. This can be triggered by profit-taking from early investors, macroeconomic news, or technical resistance levels. Analysts who foresee such a correction often view it as a necessary reset that builds a stronger foundation for the next leg of the rally. For instance, a drop could see Bitcoin retest key support levels that were previously resistance, confirming their strength before moving higher.
The prediction of a correction before reaching $140,000 suggests that while the long-term outlook is incredibly strong, the path to new all-time highs may not be a straight line. Such a correction could present an excellent buying opportunity for those who missed the initial surge or wish to increase their holdings. It also aligns with the idea of a healthy market that allows for organic growth rather than unsustainable parabolic pumps. The $140,000 target itself is a significant psychological and technical level, and reaching it would mark a substantial milestone for Bitcoin, further solidifying its position as a premier digital asset.
The Return of Altcoin Season: Why Bitcoin Dominance Must Fall To 62%
As Bitcoin continues its ascent, the conversation often shifts to the broader cryptocurrency market, specifically the potential for an "Altcoin Season." Altcoin Season refers to a period when altcoins (cryptocurrencies other than Bitcoin) experience significant price appreciation, often outperforming Bitcoin. For an Altcoin Season to truly kick off, analysts often point to a crucial prerequisite: a decrease in Bitcoin's dominance.
Bitcoin dominance (BTCD) measures Bitcoin's market capitalization as a percentage of the total cryptocurrency market capitalization. Currently, Bitcoin's dominance is relatively high, reflecting its recent strength and the capital flowing into it. However, for altcoins to flourish, capital needs to flow from Bitcoin into other cryptocurrencies. This typically happens when Bitcoin has made significant gains, and investors begin to seek higher returns in riskier, smaller-cap altcoins.
The specific threshold of Bitcoin dominance falling to 62% is often cited as a key indicator for the start of Altcoin Season. When Bitcoin's dominance drops to this level or lower, it suggests that a substantial amount of capital is rotating out of Bitcoin and into altcoins, signaling a broader market rally. This rotation is a healthy sign of market maturation, as it indicates that investors are diversifying their portfolios and recognizing the value proposition of other blockchain projects.
The return of Altcoin Season would signify a broader bullish trend across the entire cryptocurrency ecosystem. It would mean that the value proposition of decentralized finance (DeFi), non-fungible tokens (NFTs), and various Layer 1 and Layer 2 solutions built on other blockchains is gaining traction. While Bitcoin remains the undisputed king, a thriving altcoin market indicates a robust and diversified digital economy. The anticipation of this shift further underscores the dynamic and evolving nature of the cryptocurrency market, where Bitcoin's strength often paves the way for the growth of the entire ecosystem.
In conclusion, Bitcoin stands on the precipice of a new era of growth, driven by a powerful synergy of fundamental strength, technical indicators, and evolving market dynamics. The unwavering conviction of long-term holders, evidenced by a climbing Realized Cap and a pervasive "HODL mode," forms a robust foundation. The predictable monetary policy enforced by the difficulty adjustment mechanism instills unwavering confidence in its scarcity. Recent price surges, fueled by institutional interest and macroeconomic tailwinds, underscore its immediate bullish momentum. While a short-term correction may be on the cards, it is viewed as a healthy precursor to an explosive rally towards and beyond the $140,000 mark. Furthermore, Bitcoin's continued strength is expected to eventually pave the way for an "Altcoin Season," signaling the maturation and diversification of the broader crypto market. For investors and
enthusiasts alike, ignoring Bitcoin's current trajectory would be to miss a pivotal moment in the ongoing digital revolution, as it solidifies its grip on the financial future.

BTC Testing Major Resistance >>> Rejection Likely?Hi guys!
Did you see my last analysis about Btc? Let's break it down more!
Bitcoin is now testing a major resistance zone around $106.8K, where a descending trendline has already pushed the price down several times.
This area could act as a reversal point again. If BTC fails to break above, we might see a move down toward $102.2K — a strong support level from earlier this month.
Right now, the market is showing signs of weakness near resistance, so this could be a good spot to watch for a short setup — unless bulls step in with strong volume and break out cleanly.
attention to these levels:
Resistance: $106.8K (trendline + supply zone)
Support target: $102.2K
Outlook: Bearish unless breakout confirmed
