BTCUSDT | No Rejection Yet, Higher Targets in SightThe current price action is still leaning bullish. We haven’t seen a sharp rejection or breakdown from key structure — and until that happens, I expect the move to stretch toward the 107,600 region.
Volume remains consistent, and there’s subtle support in the lower timeframes. Buyers are holding their ground, and as long as that continues, the path of least resistance remains up.
Wait for price to disprove the idea before abandoning it. That’s how you stay ahead.
📌I keep my charts clean and simple because I believe clarity leads to better decisions.
📌My approach is built on years of experience and a solid track record. I don’t claim to know it all but I’m confident in my ability to spot high-probability setups.
📌If you would like to learn how to use the heatmap, cumulative volume delta and volume footprint techniques that I use below to determine very accurate demand regions, you can send me a private message. I help anyone who wants it completely free of charge.
🔑I have a long list of my proven technique below:
🎯 ZENUSDT.P: Patience & Profitability | %230 Reaction from the Sniper Entry
🐶 DOGEUSDT.P: Next Move
🎨 RENDERUSDT.P: Opportunity of the Month
💎 ETHUSDT.P: Where to Retrace
🟢 BNBUSDT.P: Potential Surge
📊 BTC Dominance: Reaction Zone
🌊 WAVESUSDT.P: Demand Zone Potential
🟣 UNIUSDT.P: Long-Term Trade
🔵 XRPUSDT.P: Entry Zones
🔗 LINKUSDT.P: Follow The River
📈 BTCUSDT.P: Two Key Demand Zones
🟩 POLUSDT: Bullish Momentum
🌟 PENDLEUSDT.P: Where Opportunity Meets Precision
🔥 BTCUSDT.P: Liquidation of Highly Leveraged Longs
🌊 SOLUSDT.P: SOL's Dip - Your Opportunity
🐸 1000PEPEUSDT.P: Prime Bounce Zone Unlocked
🚀 ETHUSDT.P: Set to Explode - Don't Miss This Game Changer
🤖 IQUSDT: Smart Plan
⚡️ PONDUSDT: A Trade Not Taken Is Better Than a Losing One
💼 STMXUSDT: 2 Buying Areas
🐢 TURBOUSDT: Buy Zones and Buyer Presence
🌍 ICPUSDT.P: Massive Upside Potential | Check the Trade Update For Seeing Results
🟠 IDEXUSDT: Spot Buy Area | %26 Profit if You Trade with MSB
📌 USUALUSDT: Buyers Are Active + %70 Profit in Total
🌟 FORTHUSDT: Sniper Entry +%26 Reaction
🐳 QKCUSDT: Sniper Entry +%57 Reaction
📊 BTC.D: Retest of Key Area Highly Likely
📊 XNOUSDT %80 Reaction with a Simple Blue Box!
📊 BELUSDT Amazing %120 Reaction!
📊 Simple Red Box, Extraordinary Results
📊 TIAUSDT | Still No Buyers—Maintaining a Bearish Outlook
📊 OGNUSDT | One of Today’s Highest Volume Gainers – +32.44%
I stopped adding to the list because it's kinda tiring to add 5-10 charts in every move but you can check my profile and see that it goes on..
Btcusdbuy
Bitcoin: Will it surpass $109k in its upward trend?Since April, Bitcoin has traded in a clearly defined upward channel with two lower and upper trend lines. This channel was formed three touchpoints both on the lower and upper trendlines.
Near a critical zone
Now, BTC is at a key resistance zone where it previously peaked around $109,000, holding its all-time high. This level resists both judgement as well as forensic level significantly of a psychological barrier because it was the peak of the last major bull cycle. The price is currently hovering around the everyday resistance line while BTC is still in the upward channel. In conjunction with the historic all-time high and the upper channel resistance, range bound price action gives us an accurate capture of BTC’s behaviour.
Bullish breakout
The scenario outlined for this resistance zone makes the most sense as a rejection may lead to a temporary pullback, likely to the somewhat lower boundary of the rising channel. This in itself would not be the termination of the bullish trend, but instead a healthy retracement within the confines of an uptrend structure. But, if the market does break out above the $109,000 level with ample volume and bullish momentum, then things could start changing in the market for the better from there. Such breakout will confirm the uptrend is strong and valid where else new breakout targets will also be set turning the old high into new low. The $109,000 level would then probably move from resistance to support, making it a critical area for bulls to protect on any retests in the future.
A bearish breakout
The ramifications of a breakdown below the rising channel should also be understood by traders. It is crucial to keep an eye on the channel's lower barrier, which is presently at about $104,000. A significant decline below this level would signal a loss of short-term bullish momentum and lead to a more thorough correction. In that scenario, Bitcoin would probably go for the imbalanced area between $97,500 and $100,500, where the price has previously moved quickly without forming any solid support or resistance. Buyers may be able to intervene in this zone and try to restore bullish dominance, which may pave the way for a new breakout attempt and another surge toward the $109,000 barrier.
Conclusion
In conclusion, Bitcoin is at a critical point right now. Bitcoin is currently facing a significant resistance zone at its prior all-time high, but the upward channel that has directed price action since April is still in place. The degree of market momentum and the actions of buyers and sellers at these critical levels will determine whether the price hits new highs or declines. Investors and traders should be alert and ready for both situations since the next action could determine how Bitcoin develops over the following few weeks.
I appreciate your help.
To ensure you do not miss the upcoming analysis, be sure to follow me!
Please leave a remark and a like!

BITCOIN SIGNALS (DON'T MISS)Hello friends
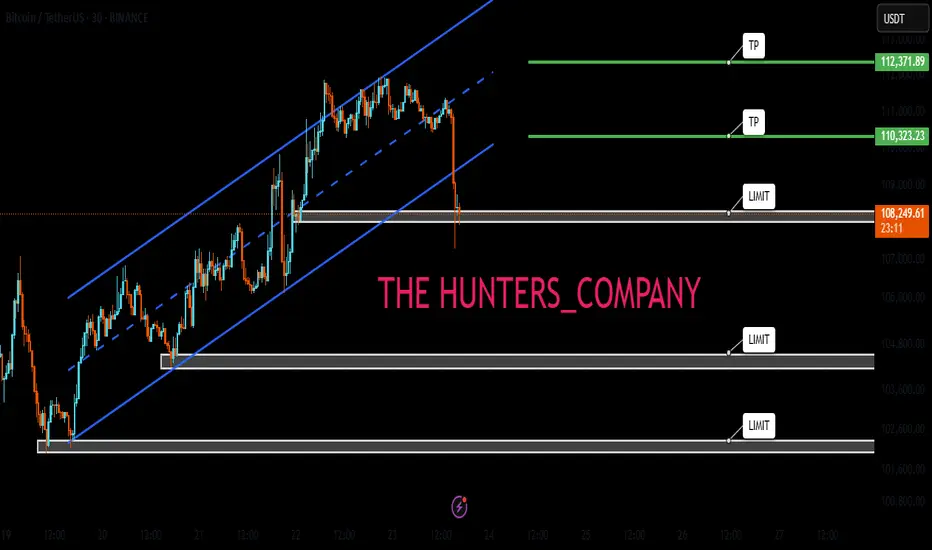
Given the good price growth we had, you can see that the price has entered a correction and has provided us with a good opportunity to buy in steps in the specified support areas (of course with capital management)
The targets have also been specified...
*Trade safely with us*
Bitcoin (BTC/USDT) – Flag Breakout Points to $114KHello guys!
Bitcoin continues to respect the bullish structure within its ascending channel, and we just got a clean breakout from a textbook bull flag.
After a solid move higher earlier this month, BTC cooled off inside a tight flag pattern, consolidating above $106K. That pullback helped reset momentum, and now we’ve broken out with conviction.
You can read about it here:
We’re currently hovering around $ 109.8 K. A short-term retest of the breakout zone near $108K–$108.5K wouldn’t be surprising. it could even offer a great entry opportunity before the next leg up.
If momentum holds, the projected target from this flag pattern lands in the $113.5K–$114K zone.
watch these:
Support: $107.5K–$108.5K
Target: $114K
Invalidation: Break below $107K
Bias remains bullish unless we lose the channel structure.

$BTC to $120K?Bitcoin is still moving strongly inside the ascending channel, respecting both support and midline zones.
After bouncing from the lower boundary and holding above key horizontal support at $104.8K, BTC is showing signs of strength again.
With the trend intact and momentum building, a breakout toward the $116k 120k supply zone looks likely in the coming days.
Bulls remain in control as long as price holds above the mid channel and key FVG (Fair Value Gap) areas.
Watch the channel closely for confirmation.
DYRO, NFA

BTC Crypto Futures Trade Plan 2025-05-26BTC Crypto Analysis Summary (2025-05-26)
Comprehensive Summary of Each Model
Grok/xAI Report
BTC at $109,553, trading above all major MAs (20/50/200 SMAs, 9/21 EMAs) → strong bullish trend RSI 67.02 (approaching overbought), MACD positive but slight bearish divergence Volume declining → possible consolidation or reduced buying interest Funding rate low (0.0002%) → not overleveraged long Trade suggested: long at $110,000, SL $107,000, TP1 $113,000, TP2 $115,000, size 1% equity, confidence 80%
Claude/Anthropic Report
Confirms price above all key MAs, RSI approaching overbought, MACD divergence Price near upper Bollinger Band → resistance Concludes short-term momentum weakening → moderately bearish bias Recommends no trade (confidence 72%), waits for break above $111,800 or below $105,000
Llama/Meta Report
Bullish MA alignment, RSI slightly overbought, price near upper BB Funding rate neutral, sentiment generally positive Trade suggested: long on pullback to SMA20 at $105,295.59, SL $103,000, TP $110,000, size = 2–3% equity, confidence 80%
Gemini/Google Report
Strong bullish trend (EMA9 > EMA21 > SMA20 > SMA50 > SMA200), RSI 67, BB upper ~$111,724 MACD bearish crossover → potential short-term pullback Recommends long at ~$109,550, SL $107,700, TP $113,100, size 1 BTC, confidence 75%
DeepSeek Report
Price near upper Bollinger Band, MACD bearish crossover, RSI divergence Countertrend short trade: entry $109,553, SL $111,725, TP $105,295, size 1 BTC, confidence 75% Areas of Agreement and Disagreement
Agreement
BTC is in a strong uptrend, trading above all major moving averages RSI ~67 suggests rising momentum but nearing overbought MACD shows a bearish divergence or crossover, warning of short-term momentum loss Price is close to the upper Bollinger Band → stretched conditions
Disagreement
Directional bias: Grok, Llama, and Gemini bullish; Claude is cautious/no-trade; DeepSeek bearish countertrend Entry levels: ranges from pullbacks to 105k (Llama) to market price ~109.55k (Gemini/Grok) Risk appetite: varying leverage and position-sizing recommendations Trade/no-trade: Claude advises holding; others recommend active positions Conclusion and Trade Recommendation
Overall Market Direction Consensus
Moderately Bullish: the dominant trend is up, supported by MA structure and recent performance, despite short-term momentum warnings.
Recommended Trade
Direction: Long BTC futures Entry Range: Near current market (109,500–109,600) or immediate retest of EMA9 (~109,550) Stop Loss: 107,700 (below EMA9 and minor support) Take Profit: 113,100 (just above recent swing highs/upper BB) Position Size: 1 BTC (adjust per account to risk ~1–2%) Confidence Level: 78%
Key Risks and Considerations
Momentum Divergence: MACD bearish crossover and RSI near overbought may trigger a pullback Volatility Spikes: leverage can amplify slippage and liquidation risk Broader Crypto Moves: altcoin correlation or market-wide news can quickly shift prices Funding Rate Shifts: a sudden spike could accelerate long-side liquidations
TRADE_DETAILS (JSON Format) { "instrument": "BTC", "direction": "long", "entry_price": 109550.0, "stop_loss": 107700.0, "take_profit": 113100.0, "size": 1, "confidence": 0.78, "entry_timing": "market_open" }
📊 TRADE DETAILS 📊 🎯 Instrument: BTC 📈 Direction: LONG 💰 Entry Price: 109550.0 🛑 Stop Loss: 107700.0 🎯 Take Profit: 113100.0 📊 Size: 1 💪 Confidence: 78% ⏰ Entry Timing: market_open
Disclaimer: This newsletter is not trading or investment advice but for general informational purposes only. This newsletter represents my personal opinions based on proprietary research which I am sharing publicly as my personal blog. Futures, stocks, and options trading of any kind involves a lot of risk. No guarantee of any profit whatsoever is made. In fact, you may lose everything you have. So be very careful. I guarantee no profit whatsoever, You assume the entire cost and risk of any trading or investing activities you choose to undertake. You are solely responsible for making your own investment decisions. Owners/authors of this newsletter, its representatives, its principals, its moderators, and its members, are NOT registered as securities broker-dealers or investment advisors either with the U.S. Securities and Exchange Commission, CFTC, or with any other securities/regulatory authority. Consult with a registered investment advisor, broker-dealer, and/or financial advisor. By reading and using this newsletter or any of my publications, you are agreeing to these terms. Any screenshots used here are courtesy of TradingView. I am just an end user with no affiliations with them. Information and quotes shared in this blog can be 100% wrong. Markets are risky and can go to 0 at any time. Furthermore, you will not share or copy any content in this blog as it is the authors' IP. By reading this blog, you accept these terms of conditions and acknowledge I am sharing this blog as my personal trading journal, nothing more.

Accumulate waiting for the next new ATH, BTC 💎 Update Plan BTC (May 26)
Notable news about BTC:
Bitcoin (BTC) is trading above $109,000 as of Monday, staging a solid rebound after Friday’s sharp pullback. The recovery has been largely driven by renewed optimism following US President Donald Trump’s decision to postpone the implementation of a 50% tariff on European Union imports. This move helped calm market jitters and reignited investor appetite for risk assets, including digital currencies.
Institutional interest in Bitcoin also appears to be gaining momentum, with the latest data showing the strongest weekly inflows since late April—an encouraging sign that confidence in the asset remains resilient despite recent volatility.
Trump’s tariff delay spurs BTC bounce
In a post on his Truth Social platform, President Trump announced an extension of the EU tariff deadline to July 9, backing away from the previously scheduled June 1 hike. This announcement came just days after he criticized the lack of progress in negotiations with Brussels, which had rattled markets and led to a 3.9% drop in BTC on Friday. The policy reversal helped restore calm and provided a tailwind for Bitcoin’s upward move to start the week.
Technical analysis angle
The question that investors most interested now is when BTC will have 120k?
Congratulations to the investors. BTC goes on our analysis. Although the price is sideways, we still earn 3000 prices from this coin.
Note that the 113k region can be an important price area for adjustment before 120k and even higher
🔥BTC 4H is currently in the adjustment phase, this time will cause a lot of traders, Future - Margin to lose money, this rhythm will last long
At this time, whether new or old, should spend more time to practice, load more knowledge about the PTKT, as well as find knowledge posts at the channel ..., to strengthen the solid foundation, as well as avoid losing money at this time offline
==> Comments for trend reference. Wishing investors successfully trading

Gold Surges, Euro Plunges, BTC at RiskOn May 23rd's U.S. session, Trump's EU/Apple tariff plans sparked market chaos:
Gold surged 💥 as a safe haven.
The euro plunged on EU tariff fears.
If tariffs persist, capital may flood into gold/forex, likely triggering a BTC crash.
⚡⚡⚡ BTCUSD ⚡⚡⚡
🚀 Sell@109500 - 108500
🚀 T P 106500 - 104500
👇Accurate signals are updated every day 📈 If you encounter any problems during trading, these signals can serve as your reliable guide 🧭 Feel free to refer to them! I sincerely hope they'll be of great help to you 👇
BTC/USDT Long Buy TradeBINANCE:BTCUSDT.P
Entry 108100
SL 107200
TGT 113700
BTC forming The Signature W Pattern

Trump Tariffs Risk Triggering BTC Crash as Capital Flows to GoldOn May 23rd's U.S. session, Trump's EU/Apple tariff plans sparked market chaos:
Gold surged 💥 as a safe haven.
The euro plunged on EU tariff fears.
If tariffs persist, capital may flood into gold/forex, likely triggering a BTC crash.
⚡⚡⚡ BTCUSD ⚡⚡⚡
🚀 Sell@110000 - 109000
🚀 TP 106500 - 104500
👇Accurate signals are updated every day 📈 If you encounter any problems during trading, these signals can serve as your reliable guide 🧭 Feel free to refer to them! I sincerely hope they'll be of great help to you 👇

BITCOIN : FREE SIGNAL (DON'T MISS)Hello friends
According to the upward trend we had, you can see that the price is stuck in a channel and after the third collision with the channel ceiling, it has managed to break the channel, which indicates the power of buyers and you can buy within the specified support ranges with capital and risk management and move with it to the upcoming goals.
*Trade safely with us*

New BTC ATH, National FOMO💎 Update Plan BTC (May 22)
Notable news about BTC:
Gold prices climbed over 0.50% on renewed safe-haven demand, holding firm above the $3,300 threshold as investor anxiety grows ahead of the U.S. tax bill vote and mounting geopolitical tensions in the Middle East. At the time of writing, XAU/USD trades around $3,317, rebounding from an intraday low of $3,285.
Sentiment remains fragile, with U.S. equity markets slipping into negative territory and Treasury yields ticking higher. All eyes are on the impending vote on President Trump’s tax reform proposal, which the Congressional Budget Office (CBO) estimates could inflate the national debt by approximately $3.8 trillion. Uncertainty around the fiscal outlook continues to fuel demand for gold as a defensive asset.
Technical analysis angle
The question that investors most interested now is when BTC will have 120k?
After the breakdown of channel structure increases around the 108k area, the 113k landmark is the most expected milestone before the price approaches 120k
We still expect a slight adjustment to 108k to continue Long and Target are still 113k and 120k
🔥BTC 4H is currently in the adjustment phase, this time will cause a lot of traders, Future - Margin to lose money, this beat will last until 23-25/5
At this time, whether new or old, should spend more time to practice, load more knowledge about the PTKT, as well as find knowledge posts at the channel ..., to strengthen the solid foundation, as well as avoid losing money at this time offline
==> Comments for trend reference. Wishing investors successfully trading

BTC/USD Bullish Setup: Double Bottom Breakout Targeting $110,000 Trade Setup Analysis
1. Support & Resistance Zones
Support Zone (Buy Zone):
Highlighted in purple, between $103,764 and $104,633, with a noted stop loss area near $104,061.
Resistance/Target Zone (Take Profit Area):
Around $109,878 – $110,002 labeled as “EA TARGET POINT”.
2. Double Bottom Pattern (Bullish Signal)
There are two orange circles at the bottom, indicating a double bottom pattern—often a bullish reversal signal.
This is supported by a neckline break near the entry point at $104,534.
3. Moving Averages
Two moving averages are displayed:
Likely a short-term MA (red) and a medium/long-term MA (blue).
The price crossing above both suggests bullish momentum.
4. Trade Plan
Entry Point: Around $104,534
Stop Loss: Below $104,061
Take Profit (Target): $109,878 – $110,002
Risk/Reward Ratio: High, given the tight stop and wide target.
📈 Price Projection
The blue arrowed path suggests:
A minor dip or consolidation near $104,534, followed by a strong upward move toward the target zone.
The movement outlines a classic cup-and-handle or double-bottom breakout pattern.
🧠 Conclusion
This is a bullish trading setup for BTC/USD with a favorable risk-reward ratio. The chart suggests:
Buying near $104,534
Stop loss just below support
Targeting a move to ~$110,000

BTC/USD: Structural Breakout of Curved Resistance – Eyes on $116Technical Overview:
Bitcoin (BTC) has successfully completed a significant technical breakout after months of accumulation and resistance interaction. The chart highlights a precise market structure where price has moved from a phase of consolidation into a confirmed bullish breakout, with a clearly defined target and invalidation level.
1. SR Interchange Zone (Support-turned-Resistance):
From May to October 2024, BTC price action was trapped in a sideways range, marked by an extended accumulation phase between approximately $60,000 to $73,000. This zone acted as a historical resistance level during the downtrend, but was later flipped into support, forming a classic SR Interchange — a foundational concept in market structure analysis.
This area provided a strong base from which BTC launched its late 2024 rally.
2. Consolidation Below Curved Resistance (Dec 2024 – Apr 2025):
Following a steep bullish impulse, BTC entered a multi-month consolidation phase, forming a rounded top pattern — shown on the chart as the Black Mind Curve Resistance. This curved resistance represented a psychological and structural ceiling, suppressing bullish momentum and trapping liquidity.
Price action was tightly compressed under this dynamic resistance curve, with multiple failed breakout attempts. This period was marked by range-bound volatility and low directional commitment — classic behavior during a re-accumulation phase.
3. Breakout of Black Mind Curve Resistance (May 2025):
A major technical event occurred as BTC broke decisively above the Black Mind Curve Resistance, accompanied by a surge in bullish momentum. This move not only invalidated the prior rounding top structure but also confirmed a trend continuation breakout.
The breakout was clean, with strong follow-through volume and a higher high structure above the Major Horizontal Resistance Zone (~$105,000–$109,000) — now confirmed as flipped support.
4. Bullish Continuation & Price Target:
Following the breakout, BTC has established a higher low and continued its upward trajectory toward the marked target zone at $116,065. This zone coincides with:
Previous untested supply levels
Technical Fibonacci extension (1.272–1.618 zone)
Measured move from the curve structure base
With current momentum and structure intact, BTC remains bullishly biased until it either reaches the target zone or breaks below the invalidation level.
5. Invalidation & Risk Management:
A close below $102,005 — the defined SI (Support-Invalidation) level — would be considered structurally bearish. This level represents:
The most recent higher low
Base of the breakout structure
Re-entry into previous consolidation range
A breakdown below this level would invalidate the bullish thesis and may open the door for a deeper pullback toward $95,000 or even $88,000.
✅ Conclusion:
The breakout of the Black Mind Curve Resistance marks a significant technical shift in Bitcoin’s trend. With momentum in favor of the bulls and market structure supporting higher prices, BTC appears poised to test the $116,000 target zone in the short to mid-term — barring a breakdown below key support.
📌 Key Levels Recap:
Level Type Price
Target Zone $116,065
Current Price $110,902
Support / Invalidation (SI) $102,005
📈 Strategy Outlook:
Bias: Bullish
Entry Area: Retest of $107,000–$109,000 (if offered)
Target: $116,065
Stop-Loss: Below $102,005 (structural invalidation)
💬 Stay focused on structure, not emotions. The best trades are born from patience, not prediction.
Let me know if you'd like a summary version for use on social media or a custom signature block for your TradingView profile.

BTC Creating THIS Pattern Right Now – 108K Next?#BTC is forming a powerful pattern right now! 📊
Are we about to witness the breakout that takes us to **108K**? ⏰
Watch closely – the market's heating up! 🔥
#Bitcoin #Crypto #BullRun #BTC108K

BTCUSDT | Chasing in Euphoria? Here’s the Smarter MoveI’ve watched BTC explode during rallies like this, and trust me, finding low-timeframe entries in euphoria is a trap for most. The move looks unstoppable… until it isn't.
Right now, I’m only considering a 1R risk from the green box support . No more. No less. The risk is calculated, not emotional.
If you’re thinking of jumping in recklessly, don’t.
I’ll be watching the 1-minute timeframe closely for a clean upward break before doing anything. No confirmation, no trade.
Reminder:
“I will not insist on my short idea. If the levels suddenly break upwards and do not give a downward break in the low time frame, I will not evaluate it. If they break upwards with volume and give a retest, I will look long.”
Most people don’t know how to think like this. That’s why they lose.
You’re here to win, and I’m here to guide you.
📌I keep my charts clean and simple because I believe clarity leads to better decisions.
📌My approach is built on years of experience and a solid track record. I don’t claim to know it all but I’m confident in my ability to spot high-probability setups.
📌If you would like to learn how to use the heatmap, cumulative volume delta and volume footprint techniques that I use below to determine very accurate demand regions, you can send me a private message. I help anyone who wants it completely free of charge.
🔑I have a long list of my proven technique below:
🎯 ZENUSDT.P: Patience & Profitability | %230 Reaction from the Sniper Entry
🐶 DOGEUSDT.P: Next Move
🎨 RENDERUSDT.P: Opportunity of the Month
💎 ETHUSDT.P: Where to Retrace
🟢 BNBUSDT.P: Potential Surge
📊 BTC Dominance: Reaction Zone
🌊 WAVESUSDT.P: Demand Zone Potential
🟣 UNIUSDT.P: Long-Term Trade
🔵 XRPUSDT.P: Entry Zones
🔗 LINKUSDT.P: Follow The River
📈 BTCUSDT.P: Two Key Demand Zones
🟩 POLUSDT: Bullish Momentum
🌟 PENDLEUSDT.P: Where Opportunity Meets Precision
🔥 BTCUSDT.P: Liquidation of Highly Leveraged Longs
🌊 SOLUSDT.P: SOL's Dip - Your Opportunity
🐸 1000PEPEUSDT.P: Prime Bounce Zone Unlocked
🚀 ETHUSDT.P: Set to Explode - Don't Miss This Game Changer
🤖 IQUSDT: Smart Plan
⚡️ PONDUSDT: A Trade Not Taken Is Better Than a Losing One
💼 STMXUSDT: 2 Buying Areas
🐢 TURBOUSDT: Buy Zones and Buyer Presence
🌍 ICPUSDT.P: Massive Upside Potential | Check the Trade Update For Seeing Results
🟠 IDEXUSDT: Spot Buy Area | %26 Profit if You Trade with MSB
📌 USUALUSDT: Buyers Are Active + %70 Profit in Total
🌟 FORTHUSDT: Sniper Entry +%26 Reaction
🐳 QKCUSDT: Sniper Entry +%57 Reaction
📊 BTC.D: Retest of Key Area Highly Likely
📊 XNOUSDT %80 Reaction with a Simple Blue Box!
📊 BELUSDT Amazing %120 Reaction!
📊 Simple Red Box, Extraordinary Results
I stopped adding to the list because it's kinda tiring to add 5-10 charts in every move but you can check my profile and see that it goes on..

BTC Hits New All-Time High: Is a $128K Blow-Off Top Next?Bitcoin's Meteoric Ascent: New All-Time Highs Fuel $128K "Blow-Off Top" Predictions Amidst Unprecedented Adoption
The digital gold rush of the 21st century is reaching a fever pitch. Bitcoin (BTC), the pioneering cryptocurrency, has not only shattered previous records but is now tantalizingly close to new, stratospheric all-time highs, with analysts eyeing a potential "blow-off top" as high as $128,000. This electrifying surge, which saw BTC climb to within 1.5% of new peaks as bullish sentiment decisively overcame final resistance, is underpinned by a confluence of factors: soaring institutional and retail adoption, particularly in the United States, booming ETF inflows, growing political and regulatory support, and a shifting macroeconomic landscape that increasingly favors non-traditional assets. As of May 21, 2025, Bitcoin has firmly established itself above the $109,000 mark, a testament to its resilience and burgeoning mainstream acceptance.
The recent price action has been nothing short of spectacular. Bitcoin bulls have been relentlessly "grilling sellers," pushing the price to historic milestones. On May 21, 2025, Bitcoin etched a new all-time high (ATH) above $109,000, a landmark achievement that notably placed 100% of BTC holders into profit. This surge saw Bitcoin's market capitalization briefly surpass that of e-commerce giant Amazon, a symbolic victory highlighting its growing financial clout. Specific figures around this period include a climb to a record $109,302, and another peak at a historic $109,500, demonstrating the intense buying pressure and bullish conviction in the market. Analysts are now recalibrating their upside targets, with many calling for $116,000 as the next significant milestone on the path to even loftier valuations.
This bullish momentum isn't occurring in a vacuum. It's the culmination of years of development, increasing understanding, and a series of pivotal events that have collectively propelled Bitcoin into the financial limelight.
The American Bitcoin Boom: Adoption Surpasses Gold, Institutions Dive In
One of the most compelling narratives driving Bitcoin's current rally is its explosive growth in the United States. A staggering 50 million Americans now own Bitcoin, a figure that notably surpasses the 37 million gold holders in the country. This demographic shift signifies a profound change in investment preferences, particularly among younger generations who are increasingly comfortable with digital assets. Bitcoin is no longer a niche interest for tech enthusiasts; it's becoming a recognized component of diversified investment portfolios across a broad swathe of the American population.
The institutional embrace within the US is equally, if not more, impactful. US firms now hold an astonishing 94.8% of the Bitcoin reserves held by publicly traded companies globally. This concentration underscores the confidence American corporations have in Bitcoin as a treasury reserve asset, a hedge against inflation, and a potential source of significant returns. Furthermore, the United States is solidifying its position as the global epicenter of the Bitcoin industry, with 40% of all Bitcoin companies headquartered domestically. This robust ecosystem of miners, exchanges, wallet providers, and ancillary service companies fosters innovation and provides a strong foundation for continued growth.
The advent and subsequent success of Bitcoin Exchange Traded Funds (ETFs) have been a game-changer. These regulated financial products have opened the floodgates for a new wave of capital, allowing retail and institutional investors to gain exposure to Bitcoin through traditional brokerage accounts without the complexities of direct ownership and custody. The "booming ETF inflows" are a direct contributor to the recent price surge, creating sustained buying pressure and signaling widespread market acceptance.
Macroeconomic Tailwinds and Regulatory Optimism
Beyond direct adoption, broader economic and political factors are playing a crucial role. The recent new all-time high of $109,000 was notably set just nine days after the US and China closed a 90-day trade agreement. This resolution eased economic uncertainty and market jitters that had previously weighed on global markets. In such an environment, assets perceived as hedges against traditional market volatility or fiat currency devaluation, like Bitcoin and gold, often thrive. Indeed, concurrent with Bitcoin's rise, concerns such as Japan's debt woes have contributed to gold surpassing the $3,300 mark, indicating a broader flight to alternative stores of value.
Furthermore, there's growing optimism around US regulations concerning cryptocurrencies. While the regulatory landscape is still evolving, recent pronouncements and actions suggest a move towards greater clarity and a more accommodative stance, rather than outright prohibition. This "growing political support" is crucial for long-term institutional commitment, as regulatory uncertainty has historically been a significant barrier to entry for larger, more conservative investors. The fact that Bitcoin climbed to a record of $109,302, breaching a previous high set around the time of a major political event like a presidential inauguration (specifically referenced as Trump's inauguration on Jan. 20 in a historical context for a previous ATH), often correlates with market sentiment interpreting political or regulatory shifts as favorable.
The "Bitcoin Strategic Reserve" (BSR): A Paradigm Shift for National Economies?
An intriguing, albeit more speculative, concept gaining traction is the idea of a "Bitcoin Strategic Reserve" (BSR). While not yet a formal policy in any major nation, the discussion itself highlights Bitcoin's evolving perception from a purely speculative asset to one with potential strategic geopolitical and economic importance.
A BSR would involve a nation-state, such as the United States, acquiring and holding Bitcoin as part of its national reserves, much like it currently holds gold or foreign currencies. The rationale behind such a move could be multifaceted:
1. Hedging Against Fiat Devaluation: As central banks globally continue to engage in monetary expansion, concerns about the long-term purchasing power of fiat currencies persist. Bitcoin, with its fixed supply, offers a potential hedge against this inflation.
2. Participating in a New Financial System: If Bitcoin continues its trajectory towards becoming a globally recognized store of value or even a medium of exchange for certain international transactions, holding it in reserve would position a nation to participate actively in this emerging financial infrastructure.
3. Technological Leadership: For a country like the US, which already leads in Bitcoin company headquarters and corporate holdings, establishing a BSR could further cement its leadership in the digital asset space, attracting talent and capital.
4. Economic Resilience: In a future where digital currencies play a more significant role, a BSR could offer a degree of economic resilience and autonomy, reducing reliance on traditional financial systems or the currencies of other nations.
The implications of a major economic power like the US even seriously considering, let alone implementing, a BSR would be monumental for Bitcoin's legitimacy and price. It would signal ultimate institutional acceptance and could trigger a wave of similar considerations by other nations, creating immense demand for a limited supply of BTC. While the "Bitcoin Strategic Reserve Explained and What BSR Means for the US Economy" remains a topic of forward-looking discussion, its emergence in financial discourse is a testament to how far Bitcoin has come.
The Path to $128K: Understanding the "Blow-Off Top"
With Bitcoin having decisively broken past $109,000 and upside targets of $116,000 now in common parlance, the ultimate bull-case scenario being discussed is a "blow-off top" potentially reaching $128,000 or even higher.
A "blow-off top" is a chart pattern that signifies a steep and rapid price increase in an asset, often on high volume, followed by an equally sharp reversal. It typically occurs at the end of a prolonged bull market or a parabolic advance. The psychology behind it involves:
1. Euphoria and FOMO (Fear Of Missing Out): As prices accelerate, media attention intensifies, and stories of quick riches abound. This draws in a flood of retail investors who don't want to miss out on the gains.
2. Exhaustion of Buyers: The parabolic rise eventually becomes unsustainable. The last wave of enthusiastic buyers enters at or near the peak.
3. Smart Money Distribution: Experienced traders and institutions, who may have accumulated positions much lower, begin to sell into this heightened demand, taking profits.
4. Sharp Reversal: Once buying pressure is exhausted and selling pressure mounts, the price can fall dramatically as latecomers panic-sell and stop-losses are triggered.
Predicting the exact peak of a blow-off top is notoriously difficult. However, analysts use a combination of technical analysis (chart patterns, momentum indicators, Fibonacci extensions), on-chain data (network activity, holder behavior), and market sentiment to identify potential price targets and warning signs. The $128,000 figure is likely derived from such analyses, representing a significant psychological level or a projection based on previous market cycle behavior.
Navigating the Bull Market: Indicators for Identifying a Cycle Top
While the current sentiment is overwhelmingly bullish, savvy Bitcoin traders and investors are always mindful of market cycles and the potential for corrections or trend reversals. The question, "Is Bitcoin price close to a cycle top?" is one that prudent market participants constantly evaluate. Several indicators can help traders gauge whether a market might be overheating:
1. Moving Average Convergence Divergence (MACD): This trend-following momentum indicator can show bearish divergences, where the price makes new highs, but the MACD fails to do so, signaling weakening momentum.
2. Relative Strength Index (RSI): An RSI reading above 70 is generally considered overbought, and readings above 80 or 90 in a strong bull market can signal extreme conditions, though Bitcoin can remain overbought for extended periods. Bearish divergences on the RSI are also key.
3. On-Chain Metrics (e.g., MVRV Z-Score, Puell Multiple, SOPR):
o MVRV Z-Score (Market Value to Realized Value): Compares Bitcoin's market cap to its realized cap (the price at which each coin last moved). High Z-scores indicate the market cap is significantly higher than the average cost basis, suggesting the asset is overvalued and potentially near a top.
o Puell Multiple: Looks at the supply side of Bitcoin's economy – miners and their revenue. It divides the daily issuance value of bitcoins (in USD) by the 365-day moving average of daily issuance value. High values suggest miner profitability is high compared to historical norms, which has sometimes coincided with market tops.
o Spent Output Profit Ratio (SOPR): This indicates if holders are, on average, selling in profit or loss. Values significantly above 1 suggest holders are realizing substantial profits, which can increase sell pressure. A sustained drop below 1 after a peak can signal a shift in trend.
4. Logarithmic Growth Curves: Bitcoin's long-term price action has often respected logarithmic growth channels. When the price reaches the upper band of these channels, it has historically indicated a market top.
5. Funding Rates and Open Interest in Derivatives Markets: Extremely high positive funding rates on perpetual swaps indicate that an overwhelming number of traders are long and paying a premium to maintain those positions. This can signal excessive bullishness and a crowded trade, making the market vulnerable to a long squeeze if prices reverse. High open interest can also exacerbate volatility.
While Bitcoin is currently refusing to give up on its quest to revisit $108,000 (a level now surpassed) and beyond, concerns over a trend change, though perhaps quieter amidst the euphoria, are always present in the minds of seasoned investors. These indicators provide a more objective lens through which to assess the sustainability of the current rally.
The Road Ahead: Uncharted Territory with Immense Potential
As Bitcoin forges new all-time highs, it enters uncharted territory. The confluence of unprecedented US adoption, robust institutional investment via ETFs, a more favorable regulatory outlook, and supportive macroeconomic conditions has created a potent cocktail for price appreciation. The surpassing of Amazon's market cap, even if temporary, and the fact that 100% of BTC holders are in profit, are powerful psychological milestones that can fuel further confidence.
The predictions of a $116,000 interim target and a potential $128,000 blow-off top are no longer fringe theories but are being seriously discussed by mainstream analysts. The narrative of Bitcoin as "digital gold" is gaining more traction than ever, especially as traditional safe havens like gold also see increased interest amidst global economic uncertainties like Japan's debt situation.
However, the path is unlikely to be linear. Bitcoin's inherent volatility means that sharp corrections can and will occur, even within a broader uptrend. The "concerns over a trend change" will likely grow louder as prices reach more extreme levels, and profit-taking becomes more tempting. Investors should remain vigilant, utilize the available indicators to assess market conditions, and practice sound risk management.
In conclusion, May 2025 has marked a historic period for Bitcoin. Its surge above $109,000, driven by a powerful combination of fundamental adoption and favorable market dynamics, has set the stage for potentially even more dramatic price action. Whether the ultimate peak of this cycle is $116,000, $128,000, or another figure entirely, one thing is clear: Bitcoin has firmly cemented its place in the global financial landscape, and its journey is far from over. The coming weeks and months will be closely watched by investors worldwide as the world's preeminent cryptocurrency continues to redefine the boundaries of financial assets.
________________________________________
Disclaimer: This article is for informational purposes only, based on the provided snippets, and should not be considered financial advice. Investing in Bitcoin and other cryptocurrencies is highly speculative and carries a significant risk of loss. Past performance is not indicative of future results. Always conduct your own thorough research and consult with a qualified financial advisor before making any investment decisions.

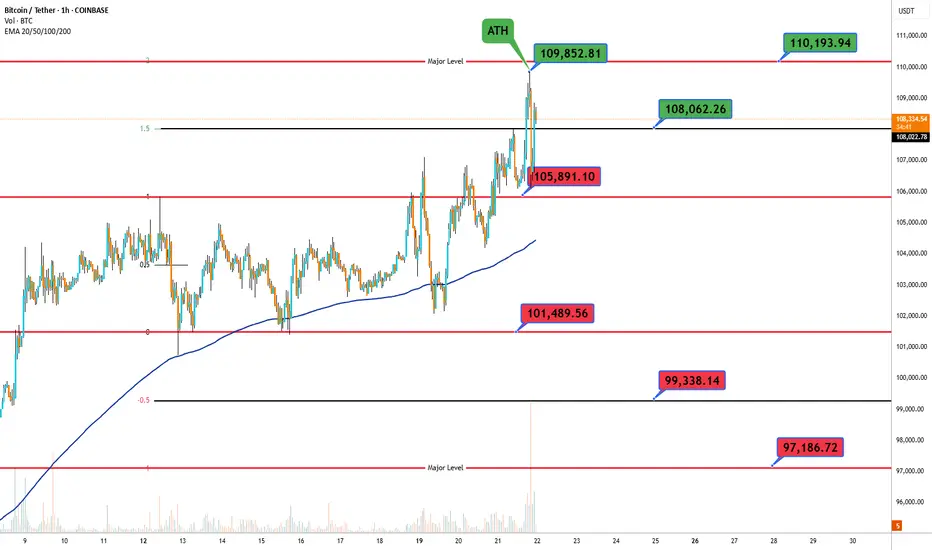
Bitcoin ATHBased on the chart for Bitcoin/Tether ( BINANCE:BTCUSDT ) on a 1-hour timeframe 📈, here are the complete support and resistance levels:
Support Levels: 🛡️
97,186.72
99,338.14
101,489.56
Resistance Levels: 🚧
108,062.26
109,852.81
110,193.94
Bitcoin (BTC/USD) Timeframe: 4-HourCurrent Price: ~$108,120
Key Chart Elements:
🔹 BOS (Break of Structure):
Multiple BOS markers indicate continuation of bullish structure from late April onward.
Recent BOS near $107,000 confirms bullish momentum is active again after a brief consolidation.
🔹 CHoCH (Change of Character):
Initial CHoCH around $104,000 signals a trend reversal from previous downtrend to bullish structure.
Later CHoCH further confirms buyers taking control.
🔹 FVG (Fair Value Gaps):
Multiple FVG zones are marked below price (between ~$93,000 to ~$106,000).
These represent areas where price moved impulsively, possibly returning to fill gaps.
The most recent FVG (between ~$107,244 and ~$105,518) acted as a support zone on the current retracement.
🔹 Fibonacci Retracement:
Price bounced off between the 0.5 and 0.618 fib levels (~$107,000–$106,387), a typical reversal zone in a strong trend.
Current Setup & Projection:
Price has broken above resistance near $108,000, suggesting a bullish continuation.
Target zone projected at $113,634, supported by structure and volume breakout.
Strong bullish momentum is visible after the BOS, and the price retest of FVG confirms smart money accumulation.
Volume Analysis:
Noticeable volume spike with the most recent bullish breakout, supporting the continuation case.
No large bearish volume indicating supply absorption—bulls remain in control.
Summary:
Bitcoin has completed a successful breakout from consolidation with bullish confirmation through BOS, FVG support, and volume spike. As long as price holds above $107,000–$106,200, the target zone around $113,634 remains highly probable.

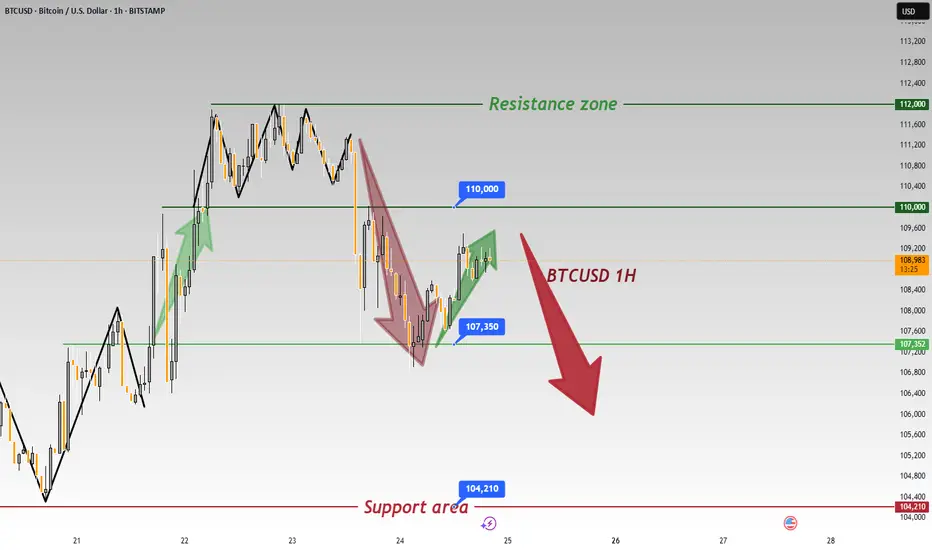
Bitcoin: Bullish Momentum Tests 109k, Eyes 110k
The Bitcoin price fluctuated in a narrow range near the 106,000 level 😊. After touching the 106,800 level, it failed to break through the 107,000 resistance level and subsequently fell back to consolidate near the 106,200 level 😐. Shortly after, the bulls regained momentum, pushing the price rapidly higher to hit a high of 109,410 🚀! Currently, the price is consolidating near the 109,100 level 🔄.
From a technical perspective, the 107,000 resistance level has turned into support after being broken, with short-term momentum favoring the bulls 👊. If the price can hold above 109,000, it may further challenge the psychological barrier of 110,000 🌟. However, caution is warranted regarding potential pullbacks from high levels 🚨. Key support below lies in the 107,000–106,200 range ⚠️.
For trading strategies: Short-term traders may consider light-position entry after the price stabilizes above 109,000, targeting 110,000 🎯. If the price pulls back and holds at the 107,000 support level, dip-buying opportunities may emerge 💰. Medium-term investors should adjust positions flexibly based on whether the 110,000 level is breached 📊.
Overall, market sentiment remains optimistic 😃, but attention should be paid to trading volume confirmation and unexpected news events 📢. Strict risk control and cautious operations are recommended ⚖️!
Buy@108000-108500
tp:109500-110500
Professional trading strategies are pushed daily 📊
Lock in precise signals amid market fluctuations 🚀
Confused about market trends? Stuck in strategy bottlenecks?
Real-time strategies serve as your "trading compass" 🌐
From trend analysis to entry/exit points, dissect market logic comprehensively
Refer now 📲
Help you move steadily forward in investments ✨
👇👇👇

BTC- crash is coming? Most likely no)In its best traditions, bitcoin in one impulse reached the monthly target 95000, which I wrote about
The probability of a correction to set a higher low in the equilibrium area of the range is increasing.
Probably in May the crypto market will have to pass the last stability test, in case of success we will get excellent opportunities for spot and speculative positions before the next cyclical growth spiral.
For now have to wait for weekly open but there are 2 options:
pump till PWH and then move on correction
slow bleeding till 0.5 or mb till 83k in worst case and then pump to ATH

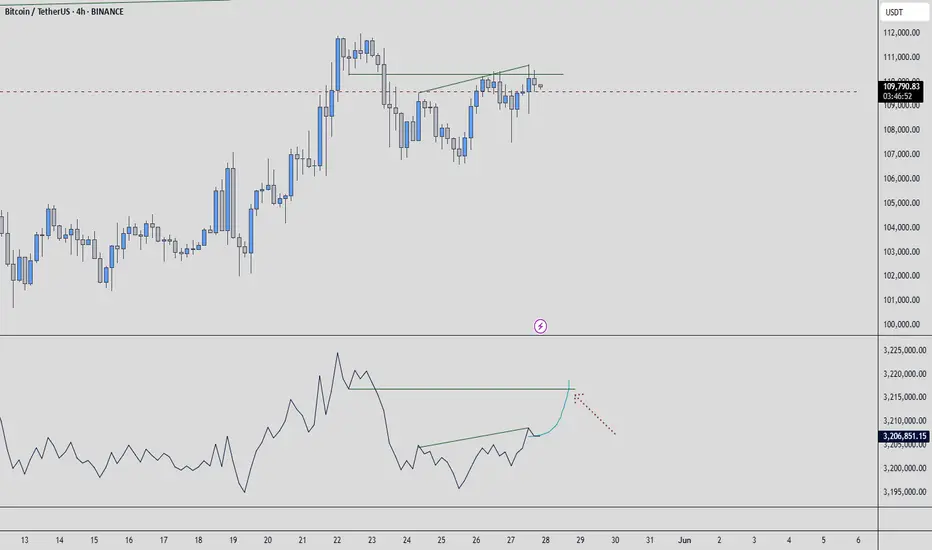
$BTC 4H Outlook – Holding the Trendline or Losing Momentum?Bitcoin just saw a strong rejection from the upper resistance zone (highlighted in red), forming a sharp wick after a quick pump.
✅ Key support has held for now, aligning with both the ascending trendline and moving average — historically zones of strong buyer interest (green circles).
⚠️ What’s next?
A 4H candle close above the resistance zone is crucial for bullish continuation.
Failure to close above = potential fakeout and downside pressure.
Eyes on the next reaction — will we see the same buying volume kick in again from support?
📌 Watch closely – confirmation will shape the next move.

Btc short analysis successfully target reached. Trust on my analysis target 🎯 reached successfully
1000+pips profit booked
Enrty at 83800
Tp at 82300
