BTC Shows Positive Awesome Oscillator and RSI Signals!I am thrilled to share with you some positive indicators that have recently emerged for Bitcoin (BTC), which may present a lucrative opportunity for potential gains.
Firstly, let's talk about the Awesome Oscillator (AO). It is a technical analysis tool that measures market momentum, specifically the difference between the 34-period and 5-period simple moving averages. The Awesome Oscillator for BTC has been displaying a remarkable upward trend, indicating a strong bullish momentum in the market. This is a positive sign for those considering entering a long position on BTC.
Moreover, the Relative Strength Index (RSI) is another powerful indicator that measures the speed and change of price movements. BTC's RSI has recently shown a significant surge, crossing the threshold into overbought territory. This suggests that the buying pressure has been consistently strong, potentially leading to further upward movement shortly.
With these positive signals from both the Awesome Oscillator and RSI, it's hard not to feel optimistic about the potential for BTC's price to continue its upward trajectory. As traders, we need to seize such opportunities when they arise.
Therefore, I encourage you to consider taking a long position on BTC currently. However, as always, it is crucial to conduct your own thorough analysis and risk assessment before making any trading decisions. Remember, the cryptocurrency market is highly volatile, and it's essential to stay informed and exercise caution.
If you're interested in exploring this opportunity further, I recommend keeping a close eye on BTC's price movements and monitoring any additional positive indicators that may emerge. Timing is key, so be sure to stay vigilant and act accordingly.
I hope this news brings a smile to your face and ignites a spark of excitement within you. Let's make the most of this potential opportunity and continue to navigate the cryptocurrency market with enthusiasm and positivity!
Wishing you happy trading and successful ventures ahead!
BTCUSDC

Bitcoin Eyes Upside MoveBitcoin (BTC) has breached the resistance level of $38,008, though not decisively, trading at $38,139 at the time of writing. There is still potential to extend towards the higher range at $38,414 or, in the case of a strong uptrend, reach $40,000. The Relative Strength Index (RSI) is moving upwards and is about to cross above the signal line (yellow band). Historically, each time this crossover occurs, BTC reacts with a bold upward move, interpreting this intersection as a buying signal.
Similarly, the Awesome Oscillator (AO) indicator continues to hold in the positive territory, indicating that the bulls still maintain control despite strong downward price pressure. On the other hand, increasing selling pressure could push the price of Bitcoin down below the support level of $38,008 or, worse, test the support at $35,487. In a more severe scenario, a downturn could cause BTC to lose the confluence support between the horizontal line and the 50-day Simple Moving Average (SMA) at $33,912. Breaking and closing below this level would invalidate the bullish outlook, setting the stage for further downside towards the psychological level of $30,000.

Get Ready for an Exciting BTC Upswing! 🚀I couldn't contain my excitement as I analyzed the most recent weekly Bitcoin (BTC) chart, which hints at an imminent upswing that could bring substantial gains. So, buckle up, and let's dive into the details!
As we all know, BTC has been consolidating within a wedge pattern over the past few weeks, exhibiting a narrowing range of price movements. However, the latest developments have me feeling particularly bullish about the future. The wedge is reaching its apex, indicating that a significant breakout is just around the corner!
The beauty of wedge patterns is that they often precede explosive price movements, and this one seems no different. The narrowing range suggests that the market is preparing for a strong move, and history has shown that these breakouts can lead to substantial gains for those who seize the opportunity at the right time.
Now, let's talk about the call-to-action that could potentially change the game for your trading portfolio. I strongly encourage you to consider going long on BTC to anticipate this upcoming upswing. By opening a long position, you position yourself to benefit from potential price surges and maximize your profit potential.
Remember, timing is crucial in the world of trading, and this could be the perfect moment to take advantage of the market's momentum. As always, it's important to conduct your analysis and assess your risk tolerance before making any trading decisions. However, given the current market conditions and the promising wedge pattern, it's hard not to feel a surge of excitement about the potential gains that lie ahead!
So, my dear traders, seize this opportunity and make the most of this potentially game-changing upswing. Keep a close eye on the BTC charts, set your entry and exit points wisely, and let's ride this wave together!

Expired BTC.USD Weekly outlook. 5th WK NOV 2023Expired BTC.USD Weekly outlook. 5th WK NOV 2023
> BULLISH 📈 CORRECT
Closed Price: 37,274
Target Price: 37,838 | Strike Price: 38,420 NOV28
Upper Range: 44,183
Lower Range: 31,493

Interesting Events With ORDI Token. . Potentially the next move?
ORDI is seen as the first BRC-20 test where the supply is 21,000,000 and the test mints were limited to 1,000.
I have experimented with this like I did with the original NFT coins, Ordinals are seen as Artifacts on the blockchain which in theory makes perfect sense. You can hardcode your own artifact to the most secure computer network in the world.
ORDI? you don't need any to create an artifact "Inscribing" but the Origin test tokens were in fact ORDI meaning if the "Inscribing" market takes off there will be major interest on the ORDI token.
ORDI is almost like creating a future "poor mans bitcoin" the silver to gold.
Worth it to buy a few if you can afford to lose it, pretty soon ORDI could be over $100 on the way to something like $3,000

BTC movement patternHi all) Doing an update on the structure. Now we observe the movement in sideways range on BTC - which is good fuel for altcoins) This model is shown to understand the most likely movement schematically) It makes no sense to analyze bitcoin on the timeframe below the daily, as narrow sidewall does not form anything interesting. There is an increase in volume over the last few days, as well as a rounding and a smooth increase in volume over the last three months. The price is pushing towards $25,000 and a lot of volume is being generated, but there is no result. This is very bad for a drop from the current levels. It is logical to put arrow there, because the main liquidity area is at 25k level) It is necessary to see the dominance growth for large scale growth of BTC. That is liquidity from alts or new money.

The biggest Ascending Triangle pattern I've ever seen BTC.D
(note this is inverse meaning up = all non (btc) marketcap rising.
If you invert the BTC.D I can't deny that the bounce here is pointing to a reversal in this asset class.
Bitcoin can go to 10-20 trillion in market cap and still have a BTC.D that reverses.
The Spot BTC ETF could be starting to spawn I hate to say it but a crypto v2 boom similar to the 1920s (roaring 20s).
I've made post on here on how market cap is a terrible indicator for the amount of cash inside this asset class and you only need a few trillion of real currency to hit a large total market cap.
How funny that random internet "coins" could have the potential to reach 20% of the market cap of the Total Market Capitalization of Public U.S. Companies.
I still see most of the ecosystems in this system are beyond useless but then again why do people stay in terrible countries? they create villages and tribes and they isolate, it's almost like tribes and villages are spawning globally with the reserve asset being Bitcoin not Gold this time.

BTC Skyrockets Above $38,000! Seize the Opportunity to Long BTC Bitcoin (BTC) has just made an astonishing breakthrough, surging above the $38,000 mark! This remarkable jump can be attributed to a recent dovish comment made by the Federal Reserve governor, signaling a potential bullish run for BTC.
The crypto market is buzzing with excitement as this significant price movement indicates a golden opportunity for those who are quick to act. Now is the time to capitalize on this momentum and seize the chance to long BTC, potentially reaping substantial profits in the process.
The Federal Reserve Governor Waller’s dovish comment has sent shockwaves through the traditional financial markets, driving investors towards Bitcoin as a safe haven asset. With the ever-increasing adoption of cryptocurrencies and the continuous influx of institutional interest, BTC is poised for an explosive surge in the near future.
So, what are you waiting for? It's time to ride the wave and take advantage of this exciting development. Here's your call-to-action: Long BTC now and position yourself to potentially reap enormous gains! Don't let this opportunity slip through your fingers!
To assist you further, I want to highlight a few key indicators that support the bullish case for BTC:
1. Positive Market Sentiment: The recent dovish comment from the Federal Reserve governor has injected renewed enthusiasm into the market, boosting confidence among traders.
2. Growing Institutional Adoption: Major financial institutions, corporations, and even governments are increasingly embracing cryptocurrencies, which further solidifies BTC's position as a valuable asset.
3. Technical Analysis: Expert analysts predict that BTC has the potential to break through key resistance levels, paving the way for even greater gains.
Remember, timing is crucial in the world of trading, and this moment is ripe with immense potential. As BTC pushes above $38,000, it's essential to act swiftly and strategically. Stay informed, keep an eye on market trends, and consider consulting with trusted experts to make well-informed trading decisions.
In conclusion, the recent dovish comment from the Federal Reserve governor has set the stage for an exhilarating bull run in the Bitcoin market. This is your chance to join the ranks of successful traders who seize opportunities when they arise. Long BTC now and position yourself to ride the wave of extraordinary profits!

Bitcoin Surge Amid Stablecoin ShiftsBitcoin's price surged to a local high of $38,400 on November 24, before retracing to $37,300 at the beginning of Monday. According to Santiment data, the late October to early November price increase of this asset was driven by an increasing supply of stablecoins on exchanges. A similar outcome is expected as stablecoin dominance continues to decline. The rising mining difficulty contributes to network security, making it more challenging to launch attacks on the Bitcoin network. Adjusting the difficulty, along with halving events, ensures that the influx of new BTC into the market will gradually slow down over time.
Therefore, the recent spike in mining difficulty is a significant milestone for the Bitcoin network.
BTC's rise to $35,000 may be triggered by the increasing reserves of Tether (USDT) and USD Coin (USDC) on cryptocurrency exchanges. According to Santiment's data, from August 19 to October 16, 3.54% of the entire USDT supply and 0.72% of the USDC supply were transferred to cryptocurrency exchanges. Subsequent to these movements was a sudden surge in BTC prices.
Santiment analysts believe that the return of USDT and USDC to exchanges, following a recovery period, will fuel Bitcoin's second bullish wave in 2023.

Bitcoin 4 dummies Greetings,
I have been quiet, weather has been crazy over here. Anyway... here is my thoughts on BTC rn mateos.
Although the king has looked to have changed structure, imo we are technically still bullish until we see a 4hr candle close under the simple trend line (Yellow).Targets have been set (Green boxes).
I've told my boiz, I expect to see bitcoin at 18k before 40k (which i have now revised to 44.9k). Expect the unexpected, this time things are different and the world is changing rapidly.
Remember, nothing is guaranteed, control the controllables.
Mogues
(#1 DumMy)
Here's a song i'm listening to repeat whilst i lern
open.spotify.com

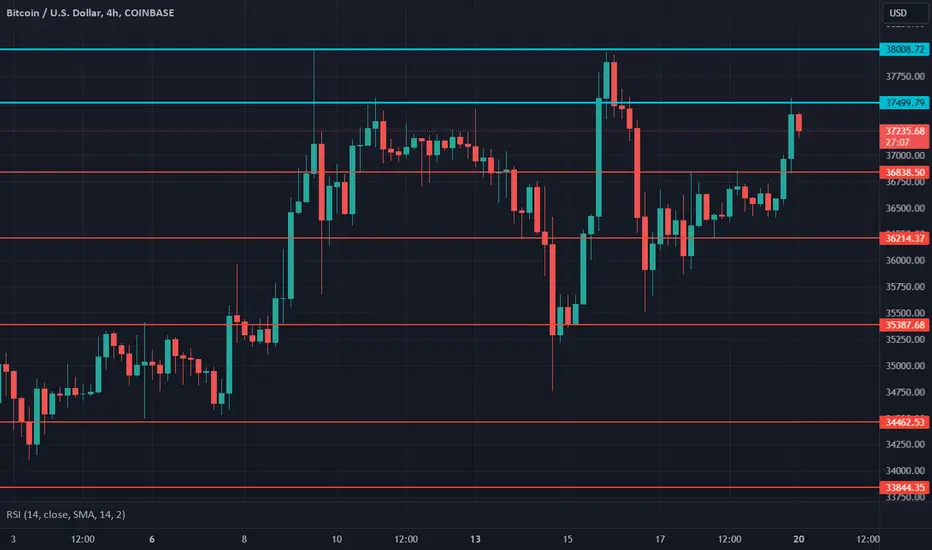
$BTC Daily UpdateCRYPTOCAP:BTC #BTC well well 4th time's the charm! 😂😂
$37,499 supporting! $38,768 next key resistance then $39,458, Bullish engulfing on 4h same on 1D as well but candle not so good - follow thru skeptical, if followed thru it should gain $38,008 support, RSI on 1d and 4h looking good.

BTC Breaks Through $38K Support Target - Time to Go Long!BTC has just broken through the $38K support target, and it's time to take action and go long!
The cryptocurrency market has been buzzing with anticipation, and today's breakthrough is a clear indication of the immense potential BTC holds. With this significant milestone, we can expect a surge in momentum and a potential bull run that could lead to substantial gains.
Now, you might be wondering why going long on BTC is the right move at this moment. Allow me to shed some light on this. Breaking through the $38K support target strongly signals that BTC has the strength and support to continue its upward trajectory. It demonstrates renewed confidence from investors and a growing interest in the cryptocurrency market.
By going long on BTC, you position yourself to benefit from the potential price appreciation that lies ahead. This breakthrough could be the catalyst for a sustained upward trend, which means there's a high probability of capturing significant profits. It's time to ride the wave and make the most of this exciting opportunity!
So, how can you take advantage of this bullish momentum? Here's a call to action for you:
1. Conduct thorough market research: Before investing, it's crucial to analyze the current market conditions, consider recent trends, and evaluate expert opinions. Gather as much information as possible to make an informed decision.
2. Set your long position: Once you've researched and feel confident about BTC's potential, open a long position on a reliable trading platform. Ensure you set a stop-loss order to manage potential risks effectively.
3. Monitor the market closely: Keep a close eye on BTC's price movements, news updates, and any significant developments that might impact its value. Stay informed and be ready to adjust your strategy accordingly.
4. Consider diversification: While BTC holds great potential, it's always wise to diversify your portfolio. Explore other promising cryptocurrencies or investment opportunities to mitigate risks and maximize your chances of success.
Remember, timing is crucial in the cryptocurrency market, and with BTC breaking through the $38K support target, now is the perfect moment to take action. Don't miss out on this thrilling opportunity to go long on BTC and potentially reap substantial rewards.
Let's seize the moment and make the most of this bullish breakthrough together!

Bitcoin Price Targets Upside MomentumBitcoin's price is currently in an upward trend, starting in November 2022. The asset has surged from $15,700 to its local high of $37,991 on November 15, 2023. BTC may encounter resistance around the psychological level of $40,000 in its ongoing bullish trend.
The Exponential Moving Averages (EMA) at 10, 50, and 200 days stand at $36,918, $33,848, and $29,590, respectively, potentially serving as support levels for the asset's pullback. In case of a downturn, Bitcoin's price could retreat to the 38.2% Fibonacci retracement level at $35,861, measured from the high of $69,121 in November 2021 to the local low of $15,396 in November 2022.

Bitcoin (BTC) Outlook Amid Regulatory ShiftsBitcoin's price continues to decline, but there's optimism following recent US Department of Justice actions that may pave the way for approving Bitcoin spot exchange-traded funds (ETFs). Analysts point out that one obstacle to approval is the dominance of the Binance exchange in the Bitcoin market, which has shown weakness, recording a 3% decrease for the day, particularly after news related to Binance. Testing a critical support level at $36,788, and with the Relative Strength Index (RSI) indicating weakening momentum, BTC may face a decline. Increasing selling pressure below the $36,788 support within the extended range from $36,276 to $37,301 could present an opportunity for an extended price drop, with experts predicting it could reach the psychological level of $30,000.
Currently, the Awesome Oscillator (AO) bars have turned red and are inching towards the daily midpoint, suggesting a gradual bearish takeover. Conversely, rising buying pressure from investors looking to capitalize on the retest of the $36,788 level may push Bitcoin's price higher. Initially surpassing the local peak at $37,972, it could then test the higher range at $37,980 and ultimately achieve the psychological milestone of $40,000, representing a 10% increase from current levels.

BTC's Potential to Break Through $40K with ETF Approval The cryptocurrency market is about to witness a potential breakthrough that could send Bitcoin (BTC) soaring beyond the $40,000 mark. How, you may ask? Well, if the eagerly anticipated ETF (Exchange-Traded Fund) gets approved by January 10, we could be in for an incredible ride!
Imagine the possibilities that lie ahead if the ETF is given the green light. Not only will it unlock new opportunities for institutional investors to enter the crypto space, but it will also provide a significant boost to BTC's overall market sentiment. This approval has the potential to ignite a wave of positive momentum, propelling Bitcoin's value to new heights.
Now, I know what you're thinking - how can we capitalize on this exciting development? Well, my friends, it's time to consider going long on BTC! By taking a bullish stance and positioning ourselves strategically, we can potentially ride the wave of this anticipated surge. Remember, fortune favors the bold!
Here's a call-to-action for you: seize this opportunity and consider long positions on BTC. As experienced traders, we understand the importance of staying ahead of the curve and taking calculated risks. This is your chance to be part of a potentially historic moment in the cryptocurrency market.
Of course, it's important to remember that trading always carries risks, and it's crucial to conduct thorough research and analysis before making any investment decisions. However, with the potential for a significant breakthrough on the horizon, it's hard not to feel a sense of excitement and optimism.
So, let's keep our fingers crossed for the ETF approval and prepare ourselves for what could be an incredible start to the year for Bitcoin. As always, stay informed, stay proactive, and let's make the most of this thrilling opportunity together!

BTC BITCOIN Technical Analysis and Trade IdeaBTC BITCOIN has been exhibiting a robust bullish trend, prominently visible on a 1W weekly chart. Our focus zeroes in on the 1W and 1D time frames, strategically seeking the best entry points amidst a significant price swing with an anticipated retracement phase.
Our focus lies in identifying retracement levels between 50% to 61.8% fibo zone, an area we favor for optimal entry. This video explores price action, market structure, and overarching trends, revealing crucial insights into technical analysis.
Throughout this breakdown, we delve into pivotal aspects: market structure dynamics, price action nuances, trend patterns, and essential technical analysis components. It's pivotal to note that this content is intended for educational purposes only. As such it's essential to avoid interpreting it as financial advice.
Keywords: BTC, Bitcoin, cryptocurrency, trading, technical analysis, market trends, price action, Fibonacci retracement, entry points, bullish trends

Bitcoin Price Trend: Potential Upside Faces Resistance at 37,972Bitcoin is currently hovering near crucial support at $36,788 after breaking into an extended supply zone from $36,276 to $37,301. To sustain the upward trend, prices need a decisive move above this level and surpass the resistance at $37,972.
Until then, Bitcoin's upward potential is under threat, with the Relative Strength Index (RSI) showing no change. The Awesome Oscillator (AO) also supports a subdued outlook, with its histogram bars in red, trending towards the middle line. If this continues, the AO might soon turn bearish.
Increasing selling pressure could push Bitcoin below the $36,788 support, potentially testing the rising trendline support at $35,410. In a more severe scenario, the decline might extend to the psychological level of $34,000, while the Buyers' Strength Level (BSL on the chart) remains below.
However, to confirm an extended downward trend, Bitcoin must break and close below the midline at $30,824 of the supply zone (currently acting as a trend-breaking tool) extending from $30,126 to $31,524. If this level fails to hold as support, BTC could slide towards $29,753.

Celebrating Argentina's New President and Bitcoin's Soaring Pric
Bitcoin has skyrocketed above the $37,000 mark, and we have Argentina's newly elected president to thank for this remarkable surge. Let's dive into the details and explore the fantastic opportunities that lie ahead!
The recent election of Argentina's new president has brought about a wave of optimism and positive sentiment in the country. With a strong focus on economic reforms and a commitment to embracing digital currencies, the new government has sparked a renewed interest in Bitcoin. As a result, we've witnessed an incredible surge in its price, which is now soaring above $37,000!
This significant milestone not only showcases the growing acceptance of cryptocurrencies but also highlights the potential for substantial gains in the market. As traders, it's crucial to seize such opportunities and make the most of this exciting time. With Argentina's new president paving the way for digital currencies, now is the perfect moment to consider a long position on Bitcoin.
Here's why a long position on Bitcoin can be a game-changer:
1. Positive Market Sentiment: The election of Argentina's new president has injected a fresh wave of optimism, creating a bullish market sentiment that can propel Bitcoin's price even higher.
2. Economic Reforms: The government's commitment to implementing economic reforms and embracing digital currencies is likely to attract more investors and drive further growth in the cryptocurrency market.
3. Global Impact: Argentina's move towards embracing cryptocurrencies can have a ripple effect worldwide, potentially inspiring other nations to follow suit. This could lead to increased adoption and further price appreciation for Bitcoin.
With all these positive factors aligning, it's time to consider taking a long position on Bitcoin. By strategically capitalizing on this upward trend, you can maximize your potential profits and be part of a groundbreaking moment in the crypto market.
x
Wishing you an exhilarating trading journey and abundant profits!

Is Bitcoin Going To REPEAT THIS MOVE?Looks like Bitcoin might repeat a parabolic like... right about now!
The overal picture looks really good but things can always change at the drop of a hat..

$BTC Daily UpdateCRYPTOCAP:BTC #BTC testing $37,499 resistance, last 1D closed with bullish engulfing, needs a follow thru today to take $38,008 support. RSI on 1D and 4H looking good, 3rd attempt on key resistance range underway, $36,868 support not yet tested
BTCUSD Ascending triangleIn my previous analysis, we have a perfect analysis and follow every change of direction at BTCUSD.
Today we have an ascending triangle pattern with strong resistance at $37,984.
If this resistance is still hard to break, we will have one more bearish wave to reach fibonacci support or triangle support around $36,446.
If this pattern breaks up, bullish target $41,290
I will update more if I find a new pattern.
If you have any question, do not hesitate to contact me
Your support at this analysis will also support BTCUSD to reach bullish target
Click here to check my other analysis

Seize the Moment: Explosive BTC Price Rally - It's Time to Long!Excitement is mounting in the world of cryptocurrency as we witness an extraordinary development in the BTC trading landscape. I am reaching out to share the latest market analysis, revealing an incredibly promising outlook for Bitcoin (BTC) that you simply cannot ignore.
Our technical analysis indicates that the simple moving average (SMA) of 50 days for BTC price has surged above the SMA 100 days, pointing towards an upward trend that demands immediate attention. This bullish crossover represents a compelling sign of positive market momentum, heightening the prospects of exponential gains.
But wait, there's even more reason to be thrilled! The SMA 100 days, matched with a positively trending moving average convergence divergence (MACD), further reinforces the notion of substantial upside potential. These strong indicators working hand in hand signify a remarkable opportunity for lucrative gains.
With this groundbreaking development, I urge you to take action and seize the moment. Don't let this exciting chance to long BTC slip through your fingers. By capitalizing on this trend, you stand to maximize your returns and position yourself at the forefront of profit-making potential.
Gain an edge in the market by staying proactive and being one step ahead of the crowd. As experienced traders, we know that timing is critical, and there has never been a more opportune moment to dive into the world of BTC trading.

Exciting News: BTC Soars Around $36,000! SMA 50 > SMA 100 200The latest news is that BTC is currently hovering around an impressive $36,000 mark! This is a momentous milestone that demands our attention and calls for action.
Why am I so thrilled about this? Well, let me break it down for you. As seasoned traders, we understand the importance of technical indicators and trends. And right now, BTC is showing us some auspicious signs. The Simple Moving Average (SMA) 50 has surged higher than the SMA 100 and 200. This is a clear indication of a bullish trend, suggesting that BTC has the potential to continue its upward trajectory.
Now, I don't know about you, but this information has got my adrenaline pumping! It's the perfect opportunity to capitalize on the market movement and maximize our profits. So, without further ado, I urge you to consider joining the long BTC movement today!
By going long on BTC, we position ourselves to benefit from the potential price appreciation and take advantage of this bullish trend. As we've seen in the past, BTC has a history of remarkable surges, and this could be just the beginning of another significant upward movement.
So, here's the call to action: Take action now and seize this golden opportunity! Open your positions and go long on BTC. Don't let this thrilling moment pass you by. As traders, we live for these exhilarating market conditions; this is our chance to ride the wave of success.
Remember, trading always involves risks, and it's essential to conduct your own analysis and make informed decisions. However, with the current market indicators favoring a bullish trend, going long on BTC seems like a promising strategy.
As always, stay updated with the latest market news, monitor your positions closely, and adapt your trading strategies accordingly. The crypto market is dynamic and ever-changing, but we can navigate it successfully with a calculated approach and a touch of excitement.
