$108K BTC ATH in Sight Despite ETF & Moody's HeadwindsBitcoin's Turbulent Ascent: Charting a Course Through Volatility, Institutional Embrace, and the $108,000 Horizon Amid Shifting Economic Sands
The world of cryptocurrency is once again fixated on its undisputed leader, Bitcoin (BTC). The digital behemoth is currently navigating a period of intense market activity, marked by dramatic price swings, a nuanced evolution in institutional engagement, and a striking resilience in the face of macroeconomic tremors. As Bitcoin flirts with the $102,900 threshold and repeatedly tests the crucial $104,000 psychological barrier, the air is thick with anticipation. Market analysts and enthusiasts alike are closely watching for a potential surge that could propel Bitcoin beyond its previous all-time high (ATH) to an ambitious $108,000 within the current month. This intricate dance unfolds against a complex global backdrop: a recent downgrade of US debt by Moody's, significant and strategic Bitcoin accumulation by institutional players like Japan's Metaplanet, and observable shifts in the open interest of Bitcoin Exchange Traded Funds (ETFs).
The narrative for Bitcoin in May 2025 is one of inherent strength and heightened expectation. While a recent, sharp pullback from the $107,000 mark was widely attributed to investors capitalizing on recent gains—a classic profit-taking maneuver—rather than a panicked reaction to Moody's revised outlook on US debt, the digital asset staged a swift and impressive recovery, climbing back towards the $105,000 level. This rapid rebound underscores a complex interplay of market forces, investor sentiment, and perhaps a growing perception of Bitcoin as an asset with unique characteristics. This resilience, buttressed by robust underlying network fundamentals and an increasingly confident institutional presence, paints a compelling and multifaceted picture of Bitcoin's current trajectory and its potential future.
Navigating Price Swings: Profit-Taking, Market Maturity, and a Dismissal of Moody's Downgrade
Bitcoin's recent price journey has been nothing short of a rollercoaster, a testament to its well-documented volatility. However, these fluctuations also hint at a market that is gradually maturing in its response to external economic shocks. The digital currency experienced a notable dip, with some initial commentary linking it to a broader "risk-off" sentiment ostensibly triggered by Moody's downgrade of US sovereign debt. Indeed, Moody's Investors Service adjusted the U.S. government's long-term issuer and senior unsecured ratings from the pristine AAA to Aa1. The agency cited mounting concerns over the nation's escalating debt burden and the sustainability of its interest payments, a move that traditionally sends ripples of caution through global financial markets, often prompting investors to reduce exposure to assets perceived as higher risk.
However, the narrative surrounding Bitcoin's reaction quickly evolved. The sharp sell-off from its recent high near $107,000 was predominantly identified by market observers as a consequence of profit-taking. Investors who had benefited from the preceding upward trend chose to realize their gains, a standard market dynamic in any asset class. This distinction is critically important. It suggests that the selling pressure was primarily an internal market mechanism within the cryptocurrency space itself, rather than a direct, sustained erosion of confidence directly attributable to the US debt downgrade.
In a remarkable display of this independent strength, Bitcoin demonstrated a robust recovery, rallying back towards the $105,000 mark. This price action was widely interpreted as Bitcoin effectively "ignoring" or "shrugging off" the downgrade's potential long-term implications for its own valuation. Some market analysts posit that this behavior lends further credence to Bitcoin's burgeoning role as a potential hedge against instability in traditional financial systems and a perceived decline in the long-term purchasing power of fiat currencies. While Bitcoin's price did exhibit a corrective phase around the time of the downgrade announcement, its capacity to swiftly regain lost ground suggests that the market may have either already factored in such macroeconomic developments or, more significantly, views Bitcoin's fundamental, long-term value proposition as increasingly detached from traditional economic indicators. The market's reaction, characterized by an initial dip followed by a spirited recovery, highlights Bitcoin's complex and evolving relationship with macroeconomic news. It behaves at times like a risk asset, sensitive to global liquidity and investor sentiment, and at other times, it exhibits characteristics of a safe-haven asset, sought after during periods of uncertainty.
The Alluring Prospect of a New Zenith: Is $108,000 Bitcoin's Next Landmark?
Amidst this characteristic volatility, a palpable undercurrent of optimism pervades the Bitcoin market. Strong suggestions and analytical forecasts point towards the possibility that Bitcoin could not only retest but decisively surpass its previous all-time high, potentially charting a course towards $108,000, and perhaps even higher, within the current month. Technical analyses, which scrutinize historical price patterns and market statistics to predict future movements, lend support to this bullish outlook. Some chartists and forecasters have identified take-profit targets for bullish positions clustering around the $109,158.98 region.
Currently, Bitcoin's price appears to be in a consolidation phase, hovering around the $102,957 mark after a retreat from a local peak of $107,115. Market participants are intensely focused on key resistance levels. The zone between $105,000 and $108,700 is viewed as a particularly critical hurdle. A decisive daily trading session closing above the $108,700 level could act as a powerful catalyst, potentially triggering a fresh wave of buying interest and propelling Bitcoin towards the $110,000 milestone. Should this momentum be sustained, a further ascent to $115,000 by the end of May is considered a plausible scenario by optimistic analysts.
This bullish sentiment is further amplified by what some market commentators describe as Bitcoin's "volatile liquidity run." This phenomenon, characterized by rapid shifts in market liquidity and price, is believed by some analysts to be capable of paving the way for new record highs. The market has recently observed unusual trading patterns, such as CME (Chicago Mercantile Exchange) Bitcoin futures contracts leading volatile price action, even during weekend trading sessions when traditional markets are closed. This indicates a dynamic and continually evolving market structure, increasingly influenced by institutional-grade trading venues.
Historically, Bitcoin's price has demonstrated a notable correlation with global liquidity conditions, particularly metrics like the M2 money supply. Expansions in M2, representing a broader measure of money in circulation, have often coincided with upward trends in Bitcoin's price. While current expansions in M2 could theoretically provide a tailwind for Bitcoin, the future trajectory of global liquidity is somewhat clouded by persistent inflation concerns and mixed signals from various economic sectors. Nevertheless, the potent combination of strong technical chart patterns, the potential for favorable liquidity conditions, and a resilient underlying market sentiment keeps the prospect of a new all-time high firmly within the realm of possibility. Analysts are keenly eyeing the $108,000 mark as a significant psychological and technical target. A convincing breakout above this level could potentially unleash further euphoric momentum, drawing in more retail and institutional capital.
The Institutional Equation: ETF Open Interest Moderates, While Metaplanet Intensifies Accumulation
The role and behavior of institutional investors continue to be a pivotal factor shaping Bitcoin's market dynamics and its journey towards mainstream acceptance. Recently, a noteworthy development was observed in the Bitcoin ETF space: open interest saw a 5% dip, settling at approximately $29.47 billion. This occurred even as Bitcoin itself maintained its price position near the $102,900 level. This decline in open interest, which represents the total number of outstanding derivative contracts that have not been settled, coupled with a discernible slowdown in weekly inflows into Bitcoin ETFs (which were reported as the lowest in a month, at $603.74 million for the period of May 12-16), suggests a degree of caution or perhaps a phase of consolidation among ETF investors. This follows a period of particularly heightened activity and significant inflows earlier in the year, often associated with the launch and growing popularity of spot Bitcoin ETFs in major markets. The relatively rangebound trading of Bitcoin, oscillating primarily between $102,711 and $104,971 during this period, likely contributed to this softer, more measured demand for ETF exposure.
However, it would be premature to interpret this dip in ETF open interest as a signal of a broader or sustained institutional retreat from Bitcoin. Activity in the derivatives markets, for instance, paints a more nuanced, and in some aspects, more bullish picture. Strong demand for call options, which give buyers the right but not the obligation to buy Bitcoin at a specific price in the future, indicates that a segment of sophisticated traders is actively positioning for an upward price movement, with some targeting levels around $110,000. In futures markets, when open interest rises in tandem with price, it typically signals that new capital is entering the market, reinforcing the strength and conviction behind the prevailing trend.
Contrasting sharply with the moderation observed in ETF flows is the aggressive and strategic accumulation of Bitcoin by corporate entities, most notably exemplified by Metaplanet. The Japanese investment firm recently captured headlines with its announcement of an additional purchase of 1,004 Bitcoin. This transaction marked its second-largest single acquisition of the cryptocurrency to date. This significant purchase, valued at approximately $104.3 million at the time of execution, increased Metaplanet's total Bitcoin holdings to an impressive 7,800 BTC. This substantial stash is currently worth over $800 million, fluctuating slightly with market prices but generally estimated between $806 million and $807 million. The company disclosed that its average acquisition price for this latest tranche of Bitcoin was around 15.13 million Japanese yen per BTC. Crucially, its overall average cost per BTC for its entire holdings now stands at approximately $91,340.
Metaplanet's Bitcoin strategy is notably ambitious and long-term in its orientation. The company has publicly stated its goals of accumulating 10,000 BTC by the end of 2025 and has even hinted at a more audacious long-term vision of potentially holding up to 1% of the total global Bitcoin supply. This proactive accumulation positions Metaplanet as a significant corporate holder of Bitcoin, particularly prominent within the Asian financial landscape. Its approach has drawn frequent comparisons to that of Strategy (formerly MicroStrategy), the US-based software intelligence firm renowned for its pioneering and substantial investments in Bitcoin as a primary treasury reserve asset.
Such large-scale corporate buying, as demonstrated by Metaplanet and Strategy, can exert considerable upward pressure on Bitcoin's price. By acquiring and holding substantial amounts of BTC, these corporations effectively reduce the freely circulating supply available on exchanges, a phenomenon sometimes referred to as exerting deflationary pressure, especially when corporate and even governmental buying activity is rapid and sustained. Metaplanet's actions, alongside those of other forward-thinking firms, underscore a growing and significant trend: the diversification of corporate treasuries into digital assets. These companies increasingly view Bitcoin not just as a speculative investment, but as a strategic reserve asset, a potential hedge against inflation, and a safeguard against the perceived long-term devaluation of fiat currencies. This movement has seen a notable surge in Bitcoin holdings by businesses globally, particularly since early 2024, signaling a paradigm shift in how corporations manage their financial reserves.
The Bedrock of Bitcoin: Network Health, Hashrate Resilience, and Expanding Mining Margins
Beneath the often-turbulent surface of price charts and the ebb and flow of institutional capital, the fundamental health and security of the Bitcoin network itself remain remarkably robust. Investment banking giant JPMorgan recently reported that the Bitcoin Network Hashrate experienced a slight but discernible rise in the first two weeks of May. The average hashrate during this period was noted at 88.5 Exahashes per second (EH/s), representing a 2% increase. Other data sources from the blockchain analytics community corroborate this trend, showing the daily hashrate reaching even higher levels, such as 831 EH/s as of May 1, 2025, and even peaking at an impressive 921 EH/s earlier in the month. This represents a significant increase from the lows observed in 2024. As of May 15, 2025, the Bitcoin Network Hash Rate was recorded at approximately 864.51 million Terahashes per second (TH/s), which translates to 864.51 EH/s. This continued upward trajectory in computational power dedicated to the network, even in the aftermath of events like the Bitcoin halving (which reduces the block rewards issued to miners), underscores the sustained confidence of miners and contributes directly to the network's formidable security.
Adding to this positive picture, mining gross margins have reportedly expanded sequentially throughout this month. JPMorgan's analysis highlighted that as Bitcoin prices appreciated, miners' gross profit margins also saw a month-on-month expansion, leading to improved economic conditions for those securing the network. The "hash price," a key metric representing daily mining profitability per unit of hash power, increased by a notable 13% when compared to April's figures. In the initial two weeks of May, Bitcoin miners earned approximately $50,100 per EH/s in daily block rewards (which includes both newly minted bitcoins and transaction fees). This figure is up 13% from the previous month and shows a 3% year-on-year increase.
This financial viability is crucial. It enables miners to continue investing in their operations, which includes covering significant energy costs and upgrading their specialized hardware (ASICs – Application-Specific Integrated Circuits) to maintain competitiveness and efficiency. Leading manufacturers like Bitmain and MicroBT continuously release more powerful and energy-efficient mining rigs. The fact that the market price of Bitcoin remains significantly higher than the average cost of mining (estimated by some analyses to be around $36,800 per BTC) indicates a healthy profit margin for the mining industry. These margins are comparable to those observed at the beginning of previous bull market cycles, further fueling optimism. Some publicly traded mining companies, such as LM Funding, have reported improved mining margins in the first quarter of 2025, successfully navigating the headwinds from the halving event through operational improvements, strategic power agreements, and in some cases, diversifying revenue streams like power sales.
The Untamed Frontier: Meme Coins and the Curious Case of BTC Bull Token
While Bitcoin, with its established infrastructure and growing institutional adoption, commands the lion's share of attention, the broader cryptocurrency ecosystem continues to be a fertile ground for innovation, experimentation, and, undeniably, speculation. One of the most prominent and often controversial manifestations of this is the meme coin phenomenon. The question frequently arises in online forums and social media: "Best Meme Coins like BTC Bull Token Next to Surge?" This highlights the persistent allure of these unique digital assets. Meme coins are a distinct category of cryptocurrency, typically inspired by internet memes, viral social media trends, or popular culture. Their value is often driven less by intrinsic utility or underlying technological fundamentals and more by community-generated hype, speculative fervor, and the quest for rapid, exponential gains. They are infamous for their extreme volatility, capable of producing meteoric price surges in short periods, but also equally susceptible to precipitous crashes.
BTC Bull Token ($BTCBULL) has emerged as a specific example within this highly speculative niche. It has positioned itself with taglines such as "the official Bitcoin meme coin" or a "Bitcoin-themed meme coin," attempting to leverage the brand recognition and market sentiment surrounding Bitcoin itself. Its core proposition appears to be a system of rewarding its token holders with airdrops of actual Bitcoin when BTC achieves certain predetermined price milestones (for example, when Bitcoin's price reaches $150,000, $200,000, or $250,000). Additionally, the $BTCBULL project outlines plans for token burn events. These events, designed to reduce the total supply of $BTCBULL tokens and theoretically increase their scarcity, are scheduled to occur when Bitcoin's price increases by specific increments (e.g., for every $25,000 increase in Bitcoin's price, starting from a baseline of $125,000). Currently reported to be in its presale phase, projects like BTC Bull Token aim to capitalize on the excitement and upward momentum of Bitcoin bull runs. They offer a highly leveraged, and therefore highly risky, way for speculators to potentially profit from Bitcoin's upside.
It is absolutely paramount for anyone considering an allocation to meme coins, including those linked thematically to Bitcoin, to thoroughly understand their inherent high-risk, high-reward nature. These assets are, by definition, intensely speculative. They are highly susceptible to "pump-and-dump" schemes, where coordinated buying inflates the price before early holders sell off en masse, leaving later entrants with significant losses. Many meme coins lack long-term viability, tangible real-world applications, or robust development teams. While the allure of quick, life-changing profits can be undeniably strong, the potential for substantial, and often total, financial loss is equally, if not more, significant. Prudent investors should approach such tokens with extreme caution, treating them more as a form of high-stakes gambling or digital entertainment rather than a serious, fundamentally-driven investment. Due diligence, a clear understanding of the risks involved, and an investment amount one can afford to lose are critical prerequisites.
Weaving the Narrative: A Complex Market of Resilience, Adoption, and Speculation
The current Bitcoin landscape presents a fascinating and intricate tapestry, woven from a diverse array of threads. We observe robust price action that seems increasingly capable of defying or quickly recovering from macroeconomic pressures. There is the steady, albeit sometimes fluctuating, march of institutional adoption, most visibly through products like ETFs, but also through direct corporate treasury allocations. The unwavering commitment of long-term corporate accumulators, exemplified by firms like Metaplanet, adds another layer of demand. Underpinning all of this is the fundamental strength and security of the Bitcoin network itself, evidenced by a healthy and growing hashrate. And, at the periphery, the ever-present speculative fervor of the broader crypto market, including the volatile world of meme coins, adds a unique dynamism.
Bitcoin's demonstrated ability to absorb the potential shock of Moody's US debt downgrade and subsequently rally, largely on the back of what was identified as profit-taking, indicates a growing maturity within its market. It also suggests a potential decoupling, at least to some extent, from the reflexive reactions often seen in traditional financial markets. The widespread anticipation of a new all-time high, with many eyes fixed on the $108,000 level, is not without foundation. It is supported by various technical indicators, ongoing positive sentiment, and a persistent bullish undercurrent in many segments of the market. However, the recent dip in ETF open interest serves as a salient reminder that institutional sentiment can be subject to caution and re-evaluation, and that the path to higher valuations is rarely a straight, uninterrupted line. Corrections and consolidations are natural parts of any market cycle.
Metaplanet's aggressive Bitcoin acquisition strategy highlights a different, perhaps more profound, facet of institutional interest. This is not just about short-term trading or exposure to a new asset class; it's about a long-term conviction in Bitcoin's potential role as a strategic treasury reserve asset. Such a trend, if it continues to grow, could have a more sustained and significant impact on Bitcoin's supply and demand dynamics over time. Meanwhile, the healthy hashrate figures and reports of improving miner profitability provide a solid and reassuring foundation for the network's continued secure operation and the confidence of its participants.
The emergence and popularity of meme coins like BTC Bull Token, while arguably peripheral to Bitcoin's core value proposition and its aspirations as a global financial asset, reflect the undeniable speculative energy that often accompanies bull markets in the cryptocurrency space. It serves as a reminder of the diverse and sometimes bewildering ecosystem that Bitcoin anchors – an ecosystem that now ranges from highly sophisticated institutional financial products and regulated investment vehicles to community-driven, high-risk, and often ephemeral digital tokens.
Gazing Forward: A Market Poised for Potentially Defining Movements
As May 2025 continues to unfold, the Bitcoin market stands at a fascinating and potentially pivotal juncture. The confluence of technical factors, institutional behavior, network fundamentals, and macroeconomic influences creates an environment ripe for significant moves. Several key elements will be crucial to watch in the coming weeks and months:
• Price Action Around Critical Levels: Bitcoin's ability to decisively breach and, more importantly, hold above the formidable resistance zone generally identified between $105,000 and $108,700 will be a critical determinant of whether a new all-time high is imminent. A strong breakout could ignite further momentum. Conversely, key support levels, likely around the $100,000 to $102,000 range, must hold firm to maintain the prevailing bullish market structure. A break below these supports could signal a deeper correction.
• Institutional Capital Flows: Continued monitoring of inflows and outflows from Bitcoin ETFs, as well as changes in their open interest, will provide valuable insights into shorter-term institutional sentiment and positioning. Simultaneously, tracking further corporate accumulation by entities like Metaplanet and Strategy will offer signals regarding long-term conviction and the adoption of Bitcoin as a treasury asset.
• Network Fundamentals and Security: Sustained growth in the Bitcoin network hashrate and the maintenance of healthy mining economics will continue to be vital indicators of the network's underlying security, resilience, and the confidence of its core infrastructure providers. Any significant disruptions or negative trends in these areas could impact broader market sentiment.
• Overarching Macroeconomic Influences: While Bitcoin has demonstrated a degree of resilience, the broader global economic climate will undoubtedly continue to exert an influence. Key factors to watch include inflation data from major economies, monetary policy decisions from central banks (particularly regarding interest rates and quantitative easing/tightening), and any further significant developments related to sovereign debt or geopolitical stability.
• Prevailing Market Sentiment: The overall sentiment within the cryptocurrency market, as reflected in metrics like the Fear & Greed Index, activity in derivatives markets (funding rates, options skew), and the tenor of discussions within online communities and social media, will play a significant role in driving short-term price movements. This is particularly true for the more speculative assets within the ecosystem.
Bitcoin's journey is one of perpetual evolution, marked by innovation, debate, and dramatic market cycles. The current phase, characterized by ambitious price targets, strategic institutional chess moves, and robust underlying network strength, suggests that the coming weeks and months could be particularly pivotal in shaping its longer-term narrative. While the prospect of Bitcoin surpassing the $108,000 mark and venturing into new price discovery territory excites many participants, the asset's inherent volatility, coupled with the speculative elements that froth at the market's fringes, necessitates a balanced and informed perspective. Acknowledging both the transformative potential of Bitcoin and the considerable risks that continue to define its unique position in the global financial landscape remains essential for anyone navigating this dynamic space.
BTCUSDC

#BTC/USDT#BTC
The price is moving within a descending channel on the 1-hour frame, adhering well to it, and is heading for a strong breakout and retest.
We are experiencing a rebound from the lower boundary of the descending channel, which is support at 103200.
We are experiencing a downtrend on the RSI indicator, which is about to break and retest, supporting the upward trend.
We are looking for stability above the 100 moving average.
Entry price: 103708
First target: 104152
Second target: 104900
Third target: 105900

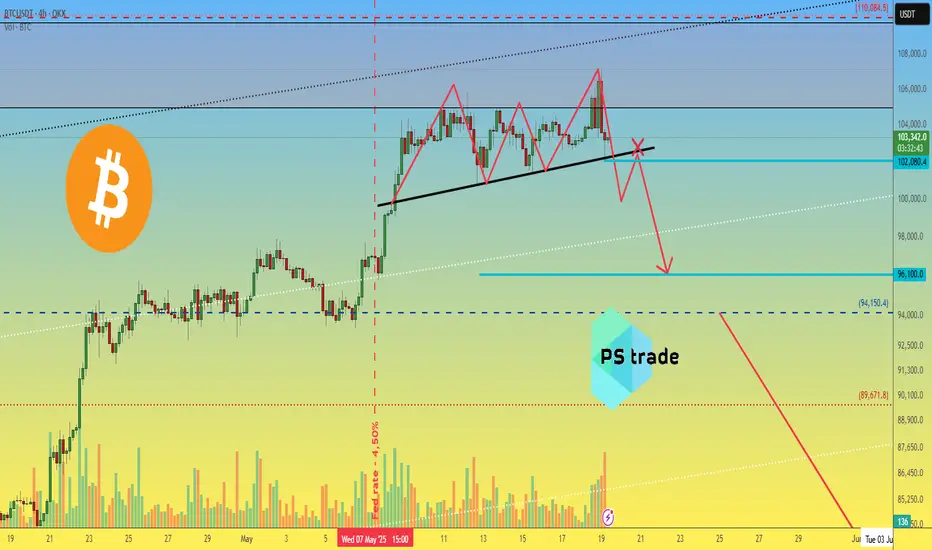
Bitcoin BTC price analysis - be careful📉 The cryptocurrency market is forming an "order" for "Red Monday".
On the OKX:BTCUSDT chart, the "Triple Top" pattern is probably nearing completion - its recognizable feature is the more lower central top and the right “powerful shake out” (for more details, if you are interested, you can read Encyclopedia of chart patterns/Thomas Bulkowski)
🆗 So, the minimum target for this pattern is $96100 per CRYPTOCAP:BTC
❗️ Confirmation of the "Triple Top" pattern development - after the base breakout and the inability to consolidate higher on the retest.
💰 Globally, we wrote our thoughts on the possible price of #Bitcoin in May/June a week earlier 👇
Also, to make trading decisions and determine which direction to trade, you need to analyze the situation on the charts:
1️⃣ BTC.D 👇
and
2️⃣ USDT.D 👇
_____________________
Did you like our analysis? Leave a comment, like, and follow to get more
Bitcoin (BTC/USDT) - Support Trendline & Zone Price Test - DailyBitcoin (BTC/USDT) price recently rejected down from $107000 on May 19th, 2025.
The yellow Support Trendline below is currently being tested ($103000 price level).
Several candle body closes below the Support Trendline could signal weakness in the daily price trend (potential rising wedge pattern).
The April inverse head-and-shoulders price pattern and targets have been completed (+12% and +24%).
note: Breaking news, government law changes, corporate announcements, and crypto crime could affect the Bitcoin price and charts.

BITCOIN BUY LIMIT Hello friends
If you are a risk taker, this position is for you...
Given the price growth, we expect a correction, so in the pullback we have identified important points to buy with capital and risk management and move towards the specified goals.
*Trade safely with us*


BTC Crossroads: Will Tariff News Trigger a Counter-Trend Move?Given the recent easing of US-China tariff tensions, Bitcoin may consolidate or experience a slight pullback as capital rotates into equities. The resulting strength in the US dollar could further contribute to a Bitcoin retracement. I'm watching for a potential counter-trend setup, specifically a short entry on a break of market structure. However, this scenario is contingent on the price action unfolding as described in the video; otherwise, the idea will be invalidated.
Not financial advice.

Bullish Tide: Are Bears Drowning as $31M Shorts VanishBullish Tide: Are Bears Drowning as FWB:31M Shorts Vanish and "Price Discovery 2" Looms?
The cryptocurrency landscape is once again electric with anticipation, and at the heart of this renewed fervor stands Bitcoin. As of May 2025, the prevailing winds appear to be firmly in the sails of the bulls. A cascade of recent market events, headlined by a dramatic $31 million liquidation of Bitcoin short positions, is sending a stark warning to pessimistic speculators. This, coupled with compelling technical analysis suggesting that Bitcoin must close the week above a crucial level to initiate 'price discovery 2', paints a picture of a market on the brink of a potentially explosive upward trajectory.
This isn't merely about fleeting price surges. Underlying these market dynamics is a growing conviction that Bitcoin doesn’t need to change; the world does. While critics often call for Bitcoin to become "faster, cheaper, greener," a powerful counter-narrative champions its existing, robust design as a solution to the inherent weaknesses of traditional systems. Adding fuel to this bullish fire is the subtle but significant trend of Bitcoin’s Quiet Coup, as wealth funds methodically build up their holdings. Furthermore, market sentiment indicators like Bitcoin funding rates remaining positive on major exchanges like Binance seem to confirm a strong, underlying uptrend. Are Bitcoin bears truly losing out, and are we witnessing the dawn of a new era for the king of cryptocurrencies?
The Cost of Doubt: $31 Million in BTC Shorts Wiped Out
The unforgiving nature of leveraged trading in the cryptocurrency markets was recently laid bare with the news that a staggering $31 million in Bitcoin short positions were liquidated. This event serves as a potent illustration of the risks involved in betting against Bitcoin's momentum, especially in the current climate.
Short selling in the crypto sphere, much like in traditional markets, involves traders borrowing Bitcoin, selling it with the expectation that its price will fall, and then planning to buy it back at a lower price to profit from the difference. However, the crypto markets are known for their high volatility and the widespread use of leverage, particularly in perpetual futures contracts. Leverage allows traders to control a much larger position than their initial capital would normally allow, amplifying potential profits but also, crucially, potential losses.
When the market moves sharply against a leveraged short position – meaning Bitcoin's price surges upwards – traders can face a margin call. If they cannot add more funds to cover their mounting losses, the exchange automatically closes their position to prevent further debt. This forced closure is a liquidation. The $31 million wipeout signifies that a substantial volume of bets on Bitcoin's price decline was overwhelmed by a potent wave of buying pressure.
This mass liquidation event has several implications. Firstly, it inflicts significant financial pain on those who were positioned for a downturn, effectively Bitcoin bears losing out on their wagers. Secondly, these forced closures inherently involve buying Bitcoin to cover the short positions, which paradoxically adds more fuel to the upward price movement. This can trigger a "short squeeze," where rising prices force more shorts to cover, leading to further liquidations and an accelerated price rally. Such events bolster bullish sentiment, demonstrating underlying market strength and deterring further aggressive short selling. It’s a clear signal that the market's undercurrent was far more robust than the bears had anticipated.
On the Cusp of a New Frontier: The Critical Weekly Close and "Price Discovery 2"
The excitement among Bitcoin proponents is palpable, with many analysts asserting that Bitcoin bulls are on the cusp of launching the market back to all-time highs and beyond. Central to this optimistic outlook is the focus on an upcoming, crucial weekly close. According to prevailing technical analysis, Bitcoin must close the week above a specific, strategically important price level to start 'price discovery 2'.
"Price discovery" is the process by which market participants determine the fair value of an asset through their buying and selling activities. When an asset like Bitcoin surpasses its previous all-time high (ATH), it enters a phase where historical resistance levels cease to exist. This is true price discovery – the market is venturing into uncharted territory, with no past price ceilings to act as psychological or technical barriers. "Price Discovery 1" can be considered Bitcoin's journey to its previous peak (around $69,000 in November 2021). The term "Price Discovery 2" thus implies a new, sustained bull run that would take Bitcoin significantly beyond that former zenith.
The significance of a "weekly close" above a key resistance level cannot be overstated in technical analysis. Weekly charts smooth out short-term noise and are often seen as better indicators of major trend shifts. A decisive weekly close above, say, the previous ATH or a major interim peak, would be a powerful confirmation for many traders and investors that the bulls are firmly in control. It would invalidate bearish scenarios that predicted a rejection at these upper levels and would likely attract a fresh wave of capital into the market.
Several potent catalysts could fuel this ascent into "Price Discovery 2." The quadrennial Bitcoin halving event, the most recent of which occurred in April 2024, historically constricts the new supply of Bitcoin, often leading to significant price appreciation in the months and years that follow as demand outstrips this reduced supply. Continued institutional adoption, evidenced by wealth funds accumulating Bitcoin, provides a steady stream of large-scale buying pressure. Furthermore, a challenging macroeconomic environment, characterized by persistent inflation in major fiat currencies or geopolitical uncertainties, can enhance Bitcoin's appeal as a non-sovereign store of value and a hedge against systemic risks. Should Bitcoin achieve this critical weekly close and embark on "Price Discovery 2," the upside could be substantial, as the market seeks to establish a new equilibrium in uncharted price territory.
The Unwavering Standard: Bitcoin Doesn’t Need to Change, The World Does
Amidst the price charts and market analyses, a more profound narrative is solidifying: Bitcoin doesn’t need to change; the world does. For years, critics have argued that Bitcoin should be faster, cheaper, greener, often comparing its transaction throughput or energy consumption to centralized payment networks or newer, less proven blockchain protocols. However, an increasing number of proponents argue that maybe the point isn’t to fix Bitcoin. Maybe it’s to fix everything else with Bitcoin.
This perspective champions Bitcoin's core attributes – often perceived as limitations by detractors – as its most vital strengths:
• Unparalleled Decentralization: Bitcoin operates on a globally distributed network with no single point of control. This makes it resistant to censorship, shutdown, or manipulation by any government or corporation. In an age of increasing financial surveillance and control, this is a feature, not a bug.
• Robust Security and Immutability: The Proof-of-Work (PoW) consensus mechanism, while energy-intensive, is what underpins Bitcoin's formidable security. The immense computational power dedicated to mining creates an economic fortress around the network, making its transaction history virtually tamper-proof. While the "greener" argument often pushes for alternatives like Proof-of-Stake (PoS), many believe PoW offers a unique level of objective security crucial for a global store of value. Moreover, the narrative around Bitcoin's energy use is evolving, with increasing adoption of renewable and stranded energy sources for mining, and a growing recognition that its energy consumption is a worthwhile trade-off for securing a truly independent financial system.
• Absolute Scarcity: Bitcoin's supply is capped at 21 million coins, a hard-coded limit that cannot be altered. This programmatic scarcity makes it a powerful antidote to the inflationary pressures inherent in fiat currencies, which can be created limitlessly by central banks. This "digital gold" characteristic is fundamental to its value proposition.
• Layered Scaling: While the Bitcoin base layer prioritizes security and decentralization over raw transaction speed, innovation is flourishing on Layer 2 solutions like the Lightning Network. These protocols enable fast, low-cost transactions by batching them off-chain and settling them periodically on the main Bitcoin blockchain, thus allowing Bitcoin to scale for everyday payments without compromising its core principles.
The argument is that instead of trying to mold Bitcoin to fit the constraints of the old financial world, we should recognize how its unique properties can address the systemic flaws within that world – issues like inflation, financial exclusion, censorship, and counterparty risk. Bitcoin, in its current form, offers a radical, resilient alternative.
The Silent Infiltration: Wealth Funds Build Up Bitcoin Holdings
Further bolstering the bullish case is the ongoing, often understated, trend of Bitcoin’s Quiet Coup: Wealth Funds Build Up Holdings. This isn't about flashy headlines but rather a methodical, strategic accumulation of Bitcoin by sophisticated institutional investors, including pension funds, endowments, sovereign wealth funds, and large family offices.
These entities, traditionally conservative and managing trillions of dollars in assets, are increasingly allocating a portion of their portfolios to Bitcoin. Their motivations are manifold:
• Diversification: Bitcoin has historically exhibited low correlation with traditional assets like stocks and bonds, making it an attractive addition for enhancing portfolio risk-adjusted returns.
• Inflation Hedge: In an environment of persistent global inflation, Bitcoin's finite supply positions it as a potential store of value, a digital hedge against currency debasement.
• Asymmetric Upside: Even a small allocation to Bitcoin can offer significant upside potential, an appealing proposition for large funds seeking growth.
• Growing Regulatory Clarity and Infrastructure: The approval of Bitcoin ETFs in major jurisdictions like the U.S. has provided regulated and accessible avenues for institutional investment, alongside the development of institutional-grade custody and trading solutions.
This "Quiet Coup" signifies a maturing perception of Bitcoin, moving it from a speculative niche asset to a legitimate component of institutional investment strategy. The steady inflow of significant capital from these large players not only provides price support but also lends credibility and encourages further adoption, potentially reducing long-term volatility as more Bitcoin is held by entities with long-term horizons.
Reading the Bullish Tea Leaves: Bitcoin Funding Rates Remain Positive
Adding another layer of confirmation to the prevailing bullish sentiment is the observation that Bitcoin Funding Rates Remain Positive On Binance — Strong Uptrend Confirmed? Funding rates are a key mechanism in cryptocurrency perpetual futures markets, designed to keep the price of the perpetual contract aligned with the spot price of the underlying asset.
When funding rates are positive, it generally means that traders holding long positions (betting on a price increase) are paying a premium to those holding short positions. This indicates a higher demand for long leverage, reflecting overall bullish sentiment in the derivatives market. Consistently positive funding rates on a major exchange like Binance, which boasts significant trading volume, suggest that this optimism is sustained. It implies that traders are confident enough in Bitcoin's upward trajectory to pay a recurring fee to maintain their leveraged long positions.
While extremely high funding rates can sometimes signal an over-leveraged market ripe for a correction (a "long squeeze"), moderately and persistently positive rates, as currently observed, are often interpreted as a healthy sign of a strong and well-supported uptrend. It suggests that the rally is not just speculative froth but is backed by conviction among active traders.
Conclusion: A Perfect Storm for Bitcoin's Next Chapter?
As May 2025 progresses, the confluence of factors points towards a potentially transformative period for Bitcoin. The $31 million decimation of short positions serves as a stark reminder of the perils of underestimating Bitcoin's strength. The market's eager anticipation of a weekly close that could unlock "Price Discovery 2" highlights the potent bullish technical setup. This is further reinforced by the fundamental conviction that Bitcoin's core design is its ultimate strength, offering solutions the traditional financial world desperately needs.
The quiet, strategic accumulation by wealth funds injects not only capital but also a profound sense of legitimacy, while positive funding rates reflect a confident and sustained bullish sentiment among active traders. While the path ahead will undoubtedly feature volatility – a characteristic inherent to Bitcoin's journey – the current alignment of technical indicators, institutional adoption, strong market sentiment, and a compelling fundamental narrative suggests that Bitcoin bears may indeed be losing out, and significantly so. The stage appears set for Bitcoin to not only challenge its previous highs but to potentially embark on a new, exhilarating phase of growth and adoption, further solidifying its role in the evolving global financial order.

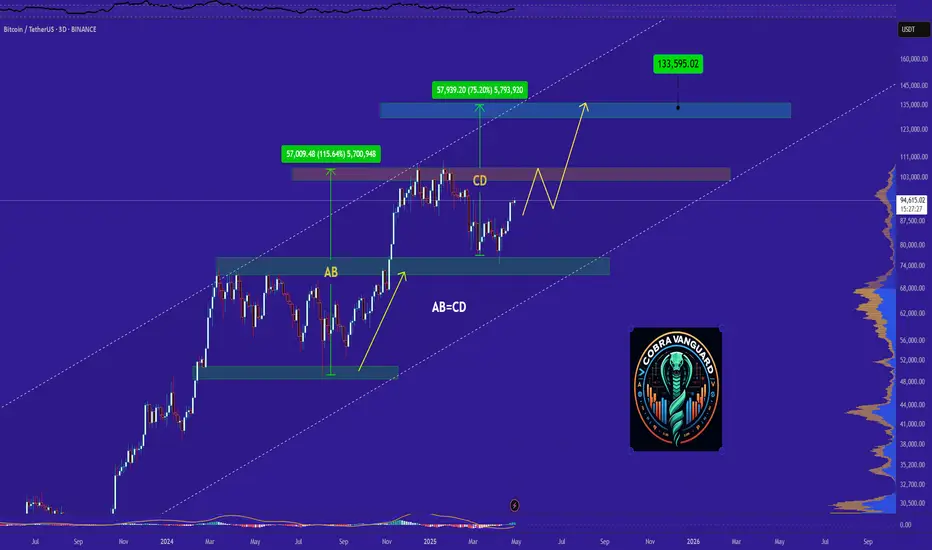
Chart is speaking itself...For months, I've been saying Bitcoin is bullish, and few believed it. I hope you made good profits. Get ready, Bitcoin will hit $300K soon.
PREVIOUS ANALYSIS
Stay Awesome , CobraVanguard

Bitcoin and altcoins are entering a correctionWe expect Bitcoin to reach around 80-83k.
Closer to the time, we’ll monitor and look for entry points in altcoins 🤔.
During this rapid rise, Bitcoin was actively sold on the Bitfinex exchange, +1 for a correction:

$BTC, Bitcoin update: what is going on?🚨 Bitcoin Update: We've just seen a decent correction on CRYPTOCAP:BTC followed by a strong pump.
I’ve warned about this already — this pump is not organic. It's largely driven by institutions and Michael Saylor, using leverage.
📉 A healthy price movement should look like a staircase: move up, consolidate, reset the daily MACD, then push higher again.
Each rally should be followed by a slight pullback — that’s how sustainable trends are built.
❌ But this natural cycle is being disrupted.
Saylor and ETFs keep buying the top to prevent corrections. Some laugh and call it incompetence, but I believe it’s strategic.
These players don’t care about making money on trades.
Their goal is to inflate the value of their companies (or stock value), which are now heavily tied to Bitcoin’s price.
That’s why they don’t want BTC to consolidate.
Every time there's weakness, they step in to buy, preventing any pullback and forcing the price through resistances and fair value gaps.
🤖 The problem? Bots — which represent +80%+ of the trading volume — are not wired this way.
They sell when BTC is overbought and buy when it's oversold.
But with institutions disrupting this cycle, exchanges end up selling BTC, and whales scoop it up — leading to lower supply on exchanges.
Exchanges then have to buy BTC back at higher prices, sometimes even at a loss — often by printing billions in Tether (USDT) to compensate.
🎈 This entire mechanism is inflating Bitcoin’s price, exactly what Bitcoin maximalists want.
But it also kills the chance for an altseason, which usually comes after Bitcoin tops out.
📊 So what’s next?
Ideally, we get a consolidation to around $91K to avoid a major bearish divergence.
If BTC breaks below $90K, we could see GETTEX:82K — but given current conditions, that’s unlikely.
On the chart, RSI is high on daioly, Williams indicator is turning bearish and MACD too. These are all signs of a most needed consolidation. But as I explained, this is cancelled at the moment.
💰 Can institutions push BTC to a new all-time high?
Yes — they basically have unlimited capital and the money printer will turn back on by September.
But once again, altseason is postponed.
#Bitcoin #BTC #CryptoMarkets #MichaelSaylor #ETF #BTCAnalysis #Altseason #CryptoPump #MarketManipulation #BTCUpdate #Tether #CryptoWhales #DailyMACD #TechnicalAnalysis #CryptoInsights #Web3

"Bitcoin Analysis" (Update)The price has reached the 0.78 Fibonacci level, and as you can see, there is a low probability that this level will be broken. I expect that, from a technical perspective, the price will form a double top here and then decline to the Fibonacci levels. After reaching the support levels, I anticipate a strong push to GETTEX:98K . Additionally, the tensions from the India-Pakistan conflict could drive the price downward.
Stay Awesome , CobraVanguard

Bitcoin Analysis - 7 MayThe price continues to move within the range of $91,700 - $100,400.
In approximately 3 hours, the FED will announce its interest rate decision.
The expectation is for it to remain unchanged.
If it remains unchanged;
there could be a horizontal consolidation between 94,990 – 97,500.
If a breakout occurs, the upward movement will accelerate; otherwise, there could be a pullback to the 91,781 – 94,990 levels.
If the interest rate is reduced;
the psychological resistance at 100,400 USDT may be tested, and if surpassed, the target of 109,605 (ATH) comes into play.
If the interest rate is increased;
the supports at 94,990 USDT and below could be tested quickly.
The levels of 91,781 and 85,085 USDT become potential targets.
With stronger selling, the support zone at the 2024 ATH level of 73,776 USDT may come into play.

BTC SHORT TERM FOLLOW UP BE SURE TO BUY AT 89-91k"Last alert for the dip — this is a follow-up to my initial analysis on the short-term period."

"Bitcoin Analysis" (Update)Here's what I can gather from the chart right now:
The Minor Resistance zone has been strongly broken to the upside; we haven't seen good pullbacks to this level yet.
On the other hand, below the broken zone, there's a price gap toward the FVG, as indicated by the arrow.
Also, the pullback to the breakout level at 0.382 has not been completed, and no patterns have formed in that area!
So? When we analyze all the breakout factors, we see a very high chance of a correction.
Now, this correction could start from the confirmation level at 96,364, or with an overextension, it could happen from the 98k zone.
Stay Awesome , CobraVanguard

New Bitcoin ATH Incoming? Key Bullish Signals & Decoupling AnalyBitcoin at the Precipice: Analyzing the Confluence of Bullish Signals, Decoupling Dynamics, and the Looming Question of a New All-Time High
The cryptocurrency market, and Bitcoin in particular, exists in a perpetual state of flux, analysis, and fervent speculation. In recent weeks and months, a compelling narrative has begun to coalesce, woven from disparate threads of technical indicators, on-chain data, market dynamics, and historical parallels. Bitcoin, after a period of consolidation and correction, appears to be sending signals that have historically preceded significant upward movements. Analysts are pointing to specific indicators flashing green, a potential local bottom seems confirmed, and intriguing shifts are occurring in mining difficulty and Bitcoin's relationship with the wider altcoin market. All this culminates in the tantalizing question echoing across trading desks and social media: Is a new Bitcoin All-Time High (ATH) incoming, perhaps even within the next year?
This article delves deep into the multifaceted factors fueling this speculation. We will dissect the analyst flags suggesting a major rally, examine the evidence for a confirmed local bottom, explore the significant decoupling of Bitcoin from altcoins, analyze the implications of the shifting mining difficulty, evaluate the compelling comparison to Gold's historical breakout, and assess the technical picture presented by indicators like the Stochastic RSI and Taker Buy/Sell ratio. By synthesizing these elements, we aim to provide a comprehensive overview of the forces currently shaping Bitcoin's trajectory and the arguments underpinning the bullish outlook for a potential new ATH, possibly targeting Q2 2025.
Part 1: Reading the Tea Leaves – Indicators Flagging a Potential Rally
Experienced market analysts often rely on a combination of technical and on-chain indicators to gauge market sentiment and predict future price movements. Recently, several reports have highlighted specific indicators whose current state mirrors conditions observed just before previous major Bitcoin bull runs. While the exact proprietary indicators used by every analyst vary, common themes emerge:
• On-Chain Metrics: These look at the activity happening directly on the Bitcoin blockchain. Key metrics often cited include:
o Supply Dynamics: Tracking the amount of Bitcoin held by long-term holders versus short-term speculators. An increase in long-term holding often suggests accumulation and reduced selling pressure. Metrics like "Supply Last Active 1+ Years Ago" reaching high levels can indicate strong conviction among holders.
o Network Activity: While not always a direct price predictor, sustained growth in active addresses or transaction counts can signal underlying adoption and utility growth.
o Profit/Loss Indicators: Metrics like Net Unrealized Profit/Loss (NUPL) or Spent Output Profit Ratio (SOPR) help gauge whether the market is overheated or potentially finding a bottom. A shift from capitulation (heavy losses) towards profitability can be a bullish sign.
• Technical Indicators: These are derived from price and volume data.
o Moving Averages: Crossovers of key moving averages (e.g., the 50-day moving average crossing above the 200-day moving average, known as a "Golden Cross") are classic bullish signals for many traders. The positioning of price relative to these averages is also crucial.
o Momentum Oscillators: Indicators like the Relative Strength Index (RSI) and the Moving Average Convergence Divergence (MACD) measure the speed and change of price movements. Emerging from oversold conditions or showing bullish divergences can signal strengthening momentum.
• Market Sentiment Indicators: While harder to quantify, tools analyzing social media sentiment, futures market positioning (funding rates, open interest), and options market data (put/call ratios) can provide clues about the prevailing mood among traders.
The core argument presented by analysts is that a confluence of these diverse indicators, many of which have strong historical track records in predicting Bitcoin rallies, are simultaneously aligning in a bullish formation. It's not just one signal, but a pattern across multiple datasets suggesting that the groundwork for a significant upward move is being laid. This historical resonance provides a powerful argument for those anticipating a break towards previous highs.
Part 2: The Confirmed Local Bottom – Building a Foundation for Growth?
Complementing the forward-looking indicators is the assertion that Bitcoin has successfully established a "local bottom." This implies that a recent period of price decline has concluded, and a new support level has been found from which price can potentially rebound. Confirmation of a bottom is often a multi-step process:
1. Price Action: A clear cessation of the downtrend, often marked by a specific low point that holds despite retests. This might involve candlestick patterns indicating reversal (like hammers or engulfing patterns) or the formation of a sideways consolidation range after a fall.
2. Volume: Capitulation volume (a spike in selling volume near the low) followed by declining volume during consolidation, and then potentially increasing volume on upward moves, can support the idea of a bottom.
3. Indicator Confirmation: Technical indicators like the RSI moving out of oversold territory (<30) or MACD showing a bullish crossover below the zero line often accompany bottom formations.
4. Holding Key Support: The price successfully defending a significant historical support level or a key Fibonacci retracement level adds weight to the bottoming argument.
The claim that "all indicators flash bullish" in conjunction with a confirmed local bottom suggests a powerful technical setup. It implies that the selling pressure that drove the price down has exhausted itself, buyers are stepping back in at these levels, and multiple technical measures are signaling renewed upward momentum. Establishing a firm bottom is crucial; without it, any rally attempt could be short-lived. This confirmed base provides psychological reassurance to bulls and a defined level for risk management (placing stop-losses below the confirmed low). The question then shifts from "Will it stop falling?" to "Where is the price headed next?"
Part 3: The Great Crypto Decoupling – Bitcoin Forges Its Own Path
One of the most significant market structure shifts observed over the past year is the growing divergence between Bitcoin and the broader altcoin market. Historically, Bitcoin often acted as the tide lifting all crypto boats; when Bitcoin rallied, altcoins typically followed, often with even greater percentage gains (and vice-versa). However, recent data points to a stark change:
• Record Market Cap Gap: The difference in total market capitalization between Bitcoin and the entire altcoin sector has reportedly reached its largest point ever. This signifies that capital inflows are disproportionately favoring Bitcoin.
• Performance Divergence: While Bitcoin has made significant strides, reclaiming substantial portions of its previous losses and challenging key resistance levels, many altcoins have lagged considerably. Some have even continued to trend downwards relative to both the US Dollar and Bitcoin itself.
• Shift from Tandem Movement: The lockstep correlation that characterized previous cycles appears broken, or at least significantly weakened. Bitcoin is charting a course influenced more by its own specific drivers than by the general sentiment across the entire crypto asset class.
•
Several factors likely contribute to this decoupling:
• Institutional Adoption & ETFs: The launch and success of spot Bitcoin ETFs in the US (and similar products elsewhere) have provided a regulated, accessible channel for institutional capital to flow directly into Bitcoin. This capital is often focused solely on Bitcoin as a digital store of value or portfolio diversifier, largely ignoring the more speculative altcoin market.
• Narrative Strength: Bitcoin's core narrative as "digital gold" – a decentralized, scarce, censorship-resistant store of value – has gained traction, particularly in environments of macroeconomic uncertainty or inflation concerns. This narrative is unique to Bitcoin and doesn't necessarily extend to most altcoins, which often have different value propositions (utility tokens, DeFi platforms, etc.).
• Regulatory Clarity (Relative): While regulatory landscapes are still evolving globally, Bitcoin generally enjoys a greater degree of regulatory clarity (often classified as a commodity in key jurisdictions like the US) compared to many altcoins, which face ongoing scrutiny regarding their potential classification as securities. This perceived lower regulatory risk can make Bitcoin more attractive to cautious investors.
• Flight to Quality: During periods of market uncertainty or following negative events within the broader crypto space (like exchange collapses or protocol exploits), investors may rotate capital from riskier altcoins into the perceived safety and established network effect of Bitcoin.
•
This decoupling has profound implications. For investors, it means diversification within the crypto space is becoming more complex; owning altcoins is no longer a guaranteed way to amplify Bitcoin's gains. For Bitcoin, it suggests a maturation of its asset class status, attracting capital based on its unique properties rather than just general crypto market sentiment. This potentially makes Bitcoin's price action more robust and less susceptible to negative developments in obscure corners of the altcoin market.
Part 4: Mining Difficulty Adjustment – A Breather for the Network's Backbone
The Bitcoin network's health and security rely on miners who dedicate vast computational power to validating transactions and adding new blocks to the blockchain. The "Difficulty" is a crucial network parameter that automatically adjusts roughly every two weeks (every 2016 blocks) to ensure that new blocks are found, on average, every 10 minutes, regardless of how much total mining power (hash rate) is connected to the network.
• How it Works: If blocks are being found too quickly (more hash rate online), the difficulty increases, making it harder to find the next block. If blocks are being found too slowly (hash rate has dropped), the difficulty decreases, making it easier.
• Recent Trend: The report notes that difficulty had increased in the four previous adjustments, indicating a sustained rise in the total hash rate competing on the network.
• Expected Drop: Now, on-chain data forecasts an almost 5% drop in difficulty for the upcoming adjustment. This implies that a noticeable amount of hash rate has recently come offline.
•
Why might hash rate decrease, leading to a difficulty drop?
• Profitability Squeeze: Mining profitability is determined by the price of Bitcoin, the miner's electricity costs, the efficiency of their mining hardware (ASICs), and the current network difficulty. If Bitcoin's price stagnates or drops while difficulty remains high (or energy costs rise), less efficient miners or those with higher operating costs may become unprofitable and shut down their rigs.
• Hardware Cycles: Older generation ASICs become obsolete as newer, more efficient models are released. A difficulty drop might reflect a temporary lull before newer hardware is fully deployed or older hardware being permanently retired.
• External Factors: Regional energy price fluctuations, regulatory changes affecting mining operations in certain areas, or even extreme weather events impacting large mining facilities can temporarily reduce the global hash rate.
What are the implications of a difficulty drop?
• A Break for Miners: For the remaining miners, a lower difficulty means they have a slightly higher chance of finding the next block with the same amount of hash power. This can improve their profitability, potentially reducing the need for them to sell mined Bitcoin immediately to cover operational expenses. Reduced selling pressure from miners is generally considered a positive market factor.
• Network Self-Regulation: It demonstrates the robustness of Bitcoin's design – the network automatically adjusts to maintain its target block time, ensuring consistent transaction processing regardless of fluctuations in mining participation.
• Not Necessarily Bearish: While a significant drop could signal miner capitulation in a deep bear market, a moderate drop after a period of sustained increases might simply be a healthy cooldown or consolidation phase in hash rate growth, allowing the ecosystem to adjust.
This expected difficulty drop, therefore, provides a welcome respite for miners, potentially easing selling pressure and showcasing the network's adaptive capabilities.
Part 5: Technical Signals and Historical Echoes – Stochastic RSI, Taker Ratio, and the Gold Fractal
Beyond the broader indicators and market dynamics, specific technical signals and historical chart patterns are adding fuel to the bullish fire:
• Bitcoin Stochastic RSI: The Stochastic RSI is a momentum indicator that uses RSI values (rather than price) within a stochastic oscillator formula. It ranges between 0 and 100 and is used to identify overbought and oversold conditions, but often more effectively in identifying strengthening momentum. A signal suggesting "brewing bullish momentum" likely means the Stochastic RSI is rising from oversold levels or showing a bullish crossover, indicating that underlying momentum (as measured by RSI) is accelerating upwards. Such signals often precede periods of strong price appreciation.
• Taker Buy/Sell Ratio (Binance): This ratio measures the aggression of buyers versus sellers executing market orders (takers) on a specific exchange (in this case, Binance, a major hub for crypto trading). A "sharp increase" in the Taker Buy Ratio (or Buy/Sell Ratio) signifies that buyers are aggressively hitting the ask price to acquire Bitcoin, willing to pay the market price rather than waiting for their limit orders to be filled. This indicates strong immediate demand and buying pressure, often interpreted as a bullish signal suggesting conviction among buyers.
• Bitcoin Mirroring Gold's Breakout Structure: This is a fascinating observation based on fractal analysis – the idea that chart patterns can repeat themselves across different time scales and different assets. The claim is that Bitcoin's current price structure (consolidation patterns, corrections, subsequent recovery) closely resembles the structure Gold exhibited before one of its major historical breakouts. If this fractal pattern holds true, it suggests Bitcoin might be in the final stages of consolidation before a significant upward move, mirroring Gold's past trajectory. This analysis leads to the specific, albeit highly speculative, prediction of a potential new ATH occurring in Q2 2025. While historical parallels are not guarantees, they provide a compelling narrative and roadmap for traders looking for historical context.
• Sandwiched Between Support & Resistance: This describes the immediate technical battleground. Bitcoin's price is currently caught in a range defined by a significant support level below (a price floor where buying interest has previously emerged) and a major resistance level above (a price ceiling where selling pressure has previously intensified). The outcome of this battle is critical. Can the bulls, bolstered by the positive indicators and dynamics discussed, muster enough strength to break decisively above resistance? Or will the bears successfully defend that level, potentially leading to another rejection or further consolidation? This price zone represents the current line in the sand.
Part 6: Synthesis and Outlook – Weighing the Evidence for a New ATH
Synthesizing these diverse factors paints a complex but potentially bullish picture for Bitcoin:
• The Bullish Case: Multiple historically reliable indicators are signaling conditions that preceded past rallies. A local bottom appears confirmed, providing a stable base. Bitcoin is increasingly decoupling from the riskier altcoin market, potentially attracting more focused institutional capital via ETFs. A looming drop in mining difficulty could ease selling pressure from miners. Specific technical indicators like the Stochastic RSI and Taker Buy/Sell Ratio point towards growing buying momentum and aggression. Furthermore, a compelling (though speculative) historical parallel with Gold's breakout structure offers a potential roadmap towards a new ATH, perhaps by Q2 2025.
• The Hurdles and Risks: Despite the bullish signals, significant resistance levels lie ahead, representing areas where sellers have previously overwhelmed buyers. Macroeconomic uncertainty (inflation, interest rates, geopolitical events) can always impact risk assets like Bitcoin. Regulatory developments, while potentially clarifying for Bitcoin, remain a source of potential volatility. The crypto market is inherently volatile, and unforeseen events ("black swans") can rapidly alter market sentiment. The Gold fractal is a historical observation, not a guarantee.
Conclusion:
Bitcoin currently stands at a fascinating juncture. The confluence of bullish indicators flagged by analysts, the apparent confirmation of a local bottom, the significant decoupling from altcoins driven partly by institutional flows, the potential easing of pressure on miners via a difficulty drop, and specific technical signals like the Stochastic RSI and Taker Buy Ratio collectively build a strong case for optimism. The comparison to Gold's historical breakout adds another layer of intrigue, offering a specific (though speculative) timeline for a potential new All-Time High.
However, optimism must be tempered with caution. Major resistance levels loom large, representing the immediate challenge for bulls. The broader macroeconomic and regulatory environments remain key variables. While the indicators suggest brewing momentum and historical patterns offer encouraging parallels, breaking through established resistance and embarking on a sustained rally towards a new ATH is never a certainty in the volatile world of cryptocurrency.
The coming weeks and months will be crucial in determining whether the bullish signals translate into decisive price action. Can the bulls overcome the resistance that currently sandwiches the price? Will the decoupling trend continue to funnel capital into Bitcoin? Will the mining landscape stabilize favorably? The answers to these questions will likely determine if the whispers of an incoming ATH, potentially mirroring Gold's path towards Q2 2025, become a roar or fade back into the market noise. The stage seems set, the indicators are aligning, but the final act is yet to be written.

Do you think I'm joking ???I might be wrong and this might never happen, but it might come true From a technical perspective!!!
Give me some energy !!
✨We spend hours finding potential opportunities and writing useful ideas, we would be happy if you support us.
Best regards CobraVanguard.💚
_ _ _ _ __ _ _ _ _ _ _ _ _ _ _ _ _ _ _ _ _ _ _ _ _ _ _ _ _ _ _ _
✅Thank you, and for more ideas, hit ❤️Like❤️ and 🌟Follow🌟!
⚠️Things can change...
The markets are always changing and even with all these signals, the market changes tend to be strong and fast!!
Is Bitcoin Overextended? Here's My Trade Plan If BTC Retraces!Bitcoin Daily Chart Analysis 📝
🚀 Current Market Structure:
The daily BTC/USDT chart clearly shows a strong bullish trend, with price action recently making a significant upward move. The current candles are consolidating near the highs, suggesting a potential overextension after a parabolic rally. This often precedes a corrective phase, as buyers may take profits and new participants wait for a more favorable entry.
🔍 Wyckoff Perspective:
Your approach aligns with the Wyckoff Method, specifically looking for a retracement to the 50% level of the current swing. This would place the ideal entry zone around the $93,071 area, as marked on your chart. According to Wyckoff, after such a retrace, we should watch for an accumulation range—a period of sideways movement where smart money absorbs supply. The key signal to watch for is a "spring" (a false breakdown below the range), followed by a strong bullish breakout, confirming demand dominance.
🌐 Fundamental Backdrop:
Fundamentally, Bitcoin remains supported by several macro factors:
Institutional adoption continues, with ETFs and large funds increasing exposure.
The recent halving event has reduced new supply, historically a bullish catalyst.
Regulatory clarity in major markets (e.g., US, EU) is improving, reducing uncertainty. However, risks remain from potential regulatory crackdowns, macroeconomic headwinds (such as interest rate hikes), and geopolitical tensions.
💬 Sentiment & Analyst Consensus:
Market sentiment is currently optimistic, with the Crypto Fear & Greed Index hovering in the "Greed" zone. Many analysts are calling for a healthy correction before the next leg up, echoing your expectation of a retrace. Some prominent voices suggest that a pullback to the $92,000–$94,000 range would be constructive, allowing for reaccumulation and a more sustainable rally.
📈 Technical Triggers to Watch:
Retrace to 50% Level: Monitor for price action around $93,071–$94,593.
Accumulation Range: Look for a period of low volatility and tight range after the retrace.
Spring & Breakout: A false breakdown below the range, quickly reclaimed, followed by a strong bullish candle, would be the classic Wyckoff entry trigger.
⚠️ Disclaimer
This analysis is for informational purposes only and does not constitute financial advice. Cryptocurrency markets are highly volatile and risky. Always conduct your own research and consult with a professional before making investment decisions.

Bitcoin's Crossroads: Golden Cross Signals, Capital Floods In
The Bitcoin narrative is rarely static. It oscillates between fervent optimism and deep skepticism, driven by a complex interplay of technical patterns, on-chain data, macroeconomic shifts, and evolving investor perceptions. Recently, several compelling signals have converged, painting a picture of a market potentially at a significant juncture. A rare "Golden Cross" technical pattern has formed, an event often associated with the start of major bull cycles. Simultaneously, on-chain data reveals a surge in "hot supply," indicating a significant influx of new capital and heightened market activity. Adding another layer, Bitcoin demonstrated surprising resilience and relative strength against traditional assets like gold and tech stocks during recent market turbulence, exhibiting an unusually low beta that hints at potential maturation.
This confluence of technical momentum, fresh capital inflow, and changing market behavior warrants a deep dive. What exactly is the Golden Cross, and what does its appearance portend for Bitcoin? How should we interpret the nearly $40 billion in "hot supply," and what risks and opportunities does this influx of potentially newer, less experienced capital present? And critically, does Bitcoin's recent outperformance and low correlation signal a fundamental shift in its role within the broader financial landscape? This article will dissect these interconnected developments, exploring their historical context, potential implications, and the inherent uncertainties that always accompany the world's leading cryptocurrency.
Decoding the Golden Cross: A Technical Harbinger?
Technical analysis (TA) is a cornerstone of trading in many markets, including cryptocurrency. It involves studying past price action and volume data to identify patterns and trends that might predict future movements. One of the most widely recognized and discussed bullish signals in TA is the "Golden Cross."
• What is a Golden Cross? A Golden Cross occurs when a shorter-term moving average (MA) of an asset's price crosses above a longer-term moving average. The most commonly watched Golden Cross involves the 50-day simple moving average (SMA) crossing above the 200-day SMA.
o The 50-day SMA reflects the average closing price over the last 50 trading days, representing recent momentum.
o The 200-day SMA reflects the average closing price over the last 200 trading days, representing the longer-term underlying trend.
• Traditional Interpretation: When the faster-moving 50-day MA overtakes the slower 200-day MA, it suggests that recent price momentum is strengthening significantly relative to the long-term trend. Technicians interpret this as a potential confirmation that a bottom may be in, and a new, sustained uptrend could be starting. It's often seen as a lagging indicator (confirming a trend already underway) but one that can signal the potential for significant further upside. Conversely, the opposite pattern, where the 50-day MA crosses below the 200-day MA, is known as a "Death Cross" and is considered a bearish signal.
• The "Once Per Cycle" Phenomenon: The claim that this specific Golden Cross (50-day crossing 200-day) happens "once every cycle" for Bitcoin generally refers to its appearance after major bear market bottoms and preceding significant bull runs in Bitcoin's roughly four-year halving cycles. Historically, looking back at Bitcoin's chart, these crosses have indeed often preceded periods of substantial price appreciation. For example, Golden Crosses occurred in 2012, 2015, 2019, and 2020, each preceding major bull markets, albeit with varying time lags and magnitudes.
• Historical Performance and Caveats: While historically bullish for Bitcoin, the Golden Cross is not an infallible predictor.
o Lagging Nature: By the time the cross occurs, a significant portion of the initial rally off the bottom may have already happened.
o False Signals: Markets can experience "whipsaws," where a Golden Cross forms briefly only to reverse into a Death Cross shortly after, trapping overly eager bulls. This was seen briefly in some shorter timeframes or even on the daily chart during choppy periods in Bitcoin's history.
o Context Matters: The broader market environment, macroeconomic factors, and fundamental developments play crucial roles. A Golden Cross during a period of intense regulatory crackdown or global recession might not have the same impact as one occurring during quantitative easing and growing institutional interest.
o Confirmation Needed: Traders often look for confirmation signals after a Golden Cross, such as sustained price action above the moving averages, increasing volume, or bullish follow-through patterns.
What to Expect from the Golden Cross?
The formation of a Golden Cross on Bitcoin's daily chart is undeniably a positive technical development that captures market attention. It suggests underlying strength and improving medium-term momentum. Historically, it has often marked the transition from a bear market recovery phase to a more sustained uptrend.
However, expectations should be tempered with caution. It's a signal, not a guarantee. It indicates potential but requires confirmation through continued price strength and favorable market conditions. Relying solely on this pattern for investment decisions is risky. It should be considered alongside other factors – on-chain data, fundamental developments, and macroeconomic context – to form a more complete picture. The most reasonable expectation is that the Golden Cross increases the probability of further upside but doesn't eliminate the possibility of consolidation, pullbacks, or even failure of the nascent uptrend.
The Heat is On: Understanding the Surge in 'Hot Supply'
While technical analysis looks at price charts, on-chain analysis delves into the activity happening directly on the Bitcoin blockchain, providing insights into investor behavior and capital flows. A key metric highlighted recently is the rise of "Bitcoin hot supply."
• What is 'Hot Supply'? "Hot Supply" typically refers to Bitcoin that has been moved on the blockchain relatively recently, often within the last few months (definitions can vary slightly between analytics platforms, e.g., coins moved within the last 1-3 months or sometimes up to 6 months). These coins are considered "hot" because they are more likely to be involved in active trading or spending, as opposed to "cold" supply held in long-term storage (often associated with HODlers). It represents the portion of the Bitcoin supply that is more liquid and actively circulating.
• Nearing $40 Billion: The fact that this hot supply is nearing a value of $40 billion is significant. It indicates a substantial amount of Bitcoin changing hands and reflects a "surge in capital turnover," as described in the analysis. This suggests heightened market activity, increased liquidity, and, crucially, the entry of new participants or the reactivation of dormant capital.
• New Investors Flooding In (at High Prices?): The analysis explicitly links this surge to new investors and speculators taking an interest, likely attracted by Bitcoin's recent price recovery and multi-month highs. The mention of "$95K" (even if potentially a typo or hypothetical peak target in the source analysis) symbolizes the risk that many of these new entrants might have acquired Bitcoin at relatively elevated prices compared to the cycle lows. This creates a cohort of investors with a higher cost basis.
• Implications of High Hot Supply:
o Increased Liquidity: More coins moving means more potential buyers and sellers, which can facilitate smoother price discovery and larger trades.
o Fuel for Rallies: An influx of new capital provides buying pressure that can sustain upward price momentum. Speculative interest often feeds on itself in bull markets.
o Increased Volatility: Coins held by newer entrants or short-term speculators are often considered "weaker hands." These holders may be more susceptible to panic selling during price dips or quick profit-taking during rallies, potentially leading to sharper price swings in both directions.
o Potential Overhead Supply: If the price stalls or reverses, the large volume of coins acquired at recent highs ( SGX:40B worth moved recently) represents potential selling pressure as these holders seek to break even or cut losses.
Interpreting the Influx:
The surge in hot supply is a double-edged sword. On one hand, it confirms growing interest and provides the necessary capital flow to potentially validate the bullish signal from the Golden Cross. New demand is essential for sustained price increases. On the other hand, it introduces a layer of fragility. The market's ability to absorb potential selling from these newer, higher-cost-basis holders during inevitable corrections will be a key test of the underlying strength of the current trend. Monitoring whether this "hot supply" gradually cools down (moves into longer-term holding) or remains elevated will be crucial in the coming months.
Bitcoin's Relative Strength: Outshining Gold and Tech Amid Turmoil
Beyond technicals and on-chain flows, Bitcoin's performance relative to traditional assets, especially during periods of market stress, offers valuable insights into its evolving perception. The observation that Bitcoin outperformed both gold (a traditional safe-haven) and tech stocks (risk-on assets) in April, particularly amidst "tariff turmoil" or other geopolitical/economic uncertainties, is noteworthy.
• Challenging Correlations: Historically, Bitcoin often traded with a high correlation to risk assets like tech stocks, particularly during market downturns. Investors tended to sell Bitcoin alongside equities during risk-off periods. Gold, conversely, often acts as a safe haven, rallying during uncertainty. Bitcoin outperforming both simultaneously suggests a potential breakdown in these typical correlations, at least temporarily.
• Why the Outperformance? Several factors could contribute:
o Unique Drivers: Bitcoin's price is influenced by factors unique to its ecosystem, such as halving cycles, adoption news, regulatory developments, and flows into new instruments like spot ETFs. These can sometimes override broader market trends.
o Inflation Hedge Narrative: Persistent inflation concerns may lead some investors to seek alternatives to fiat currency, benefiting both gold and Bitcoin, but perhaps Bitcoin more so due to its perceived higher growth potential.
o Safe-Haven Experimentation: While gold remains the established safe haven, some investors might be tentatively allocating a small portion to Bitcoin as a potential alternative store of value or hedge against systemic risk, especially if they perceive traditional systems as vulnerable.
o Decoupling Narrative: Some proponents argue that Bitcoin is increasingly decoupling from traditional markets as it matures and establishes itself as a distinct asset class. The recent performance could be seen as evidence supporting this view.
o Coincidence/Timing: It's also possible that the timing was coincidental, with Bitcoin-specific catalysts driving its price higher while unrelated factors weighed on gold and tech stocks during that specific period.
Significance of Relative Strength:
Demonstrating strength during periods when traditional assets are struggling enhances Bitcoin's appeal. It challenges the simplistic "risk-on only" label and suggests it might offer diversification benefits. If this pattern persists over longer periods and across different market stressors, it could significantly bolster the case for Bitcoin's inclusion in traditional investment portfolios.
Maturation Signal? The Low Beta Phenomenon
Closely related to relative strength is the concept of beta. Beta measures the volatility or systematic risk of an asset compared to the overall market (often represented by an index like the S&P 500).
• Beta Explained:
o A beta of 1 indicates the asset's price tends to move with the market.
o A beta greater than 1 indicates the asset is more volatile than the market.
o A beta less than 1 indicates the asset is less volatile than the market.
o A beta of 0 suggests no correlation.
• Bitcoin's Historically High Beta: Traditionally, Bitcoin has exhibited a high beta, especially relative to equity markets. It was often seen as a high-volatility asset that amplified broader market moves, particularly to the downside during risk-off events.
• Recent Low Beta Observation: The finding that Bitcoin displayed an "unusually low beta during recent market stress" is significant. It implies that its price movements were less correlated with, and potentially less volatile than, the broader market during that period of turbulence.
• Implications of Low Beta:
o Maturation Narrative: A lower, less correlated beta is often characteristic of more mature assets or distinct asset classes. It suggests investors might be viewing Bitcoin with a longer-term perspective, less prone to knee-jerk selling based on short-term fluctuations in other markets.
o Diversification Potential: Assets with low correlation to traditional portfolios (like stocks and bonds) are valuable for diversification, as they can potentially reduce overall portfolio volatility. A sustained low beta would strengthen Bitcoin's diversification credentials.
o Shift in Holder Base?: It could indicate a shift towards more institutional and long-term holders who are less reactive to daily market noise compared to purely retail speculators.
o Store of Value Aspirations: While still highly volatile compared to traditional stores of value like gold, a decreasing beta could be interpreted as a tentative step towards fulfilling some store-of-value properties, particularly if it holds value better than risk assets during downturns.
Is it Sustainable?
While the recent low beta is an encouraging sign for Bitcoin bulls and proponents of its maturation narrative, it's crucial to question its sustainability. Was it a temporary anomaly driven by specific market conditions in April, or does it represent a durable shift? Bitcoin's correlation and beta have fluctuated throughout its history. Renewed market panic, significant regulatory shocks, or major shifts in macroeconomic policy could potentially cause correlations to snap back. Continued observation across different market environments is needed to determine if this low beta is a new regime or a fleeting characteristic.
Synthesizing the Signals: A Complex Tapestry
Bringing these threads together – the Golden Cross, the surge in hot supply, relative outperformance, and low beta – reveals a complex and somewhat contradictory picture:
1. Technical Momentum Meets New Money: The Golden Cross provides a technically bullish backdrop, potentially encouraging more participants. The SGX:40B in hot supply confirms that new capital is entering, providing the fuel that could validate the technical signal.
2. Speculation vs. Maturation: The influx of hot supply points towards increased speculation and potentially "weaker hands." Yet, the low beta and relative outperformance during stress hint at underlying strength and potential maturation, suggesting a core base of holders is becoming less reactive. This highlights the heterogeneous nature of the Bitcoin market, with different investor cohorts exhibiting different behaviors simultaneously.
3. Opportunity and Risk: The convergence creates both opportunity and risk. The opportunity lies in the potential for the Golden Cross and new capital to ignite a sustained rally, further bolstered if Bitcoin continues to act as a diversifier (low beta). The risk lies in the potential fragility introduced by the high volume of recent entrants (hot supply) who might capitulate during dips, potentially invalidating the Golden Cross and reversing the low beta trend.
The current environment suggests Bitcoin is navigating a transition. The technicals point upwards, fresh capital is flowing in, and its behavior relative to traditional markets is showing intriguing signs of change. However, the presence of significant "hot" money serves as a reminder that volatility and sharp corrections remain distinct possibilities.
Overarching Risks and Necessary Caveats
Despite the positive signals, numerous risks persist:
• Technical Analysis is Not Predictive: The Golden Cross is a historical pattern, not a crystal ball. It can fail.
• 'Hot Supply' Risk: A large cohort of investors with a high cost basis can become a source of significant selling pressure if sentiment shifts.
• Macroeconomic Headwinds: Persistent inflation, rising interest rates (globally), geopolitical conflicts, or a global recession could dampen appetite for risk assets, including Bitcoin.
• Regulatory Uncertainty: While spot ETFs marked progress, the global regulatory landscape for crypto remains fragmented and uncertain. Unexpected crackdowns remain a threat.
• Correlation Risk: The low beta and decoupling narrative could prove temporary. Bitcoin could easily recouple with risk assets during a broader market panic.
Conclusion: Bitcoin at an Inflection Point?
Bitcoin currently stands at a fascinating crossroads, illuminated by a confluence of compelling, albeit sometimes conflicting, signals. The rare Golden Cross offers a technically bullish omen, suggesting underlying momentum is shifting favorably for a potential long-term uptrend, echoing patterns seen in previous cycles. This technical optimism is fueled by tangible evidence of renewed interest, with nearly $40 billion in "hot supply" indicating a significant surge in capital turnover and the arrival of fresh speculative and investment capital.
Simultaneously, Bitcoin's recent behavior exhibits intriguing signs of potential maturation. Its ability to outperform traditional safe havens like gold and risk assets like tech stocks during periods of market stress, coupled with an unusually low beta, challenges its historical "risk-on only" profile. This suggests a growing base of investors may be viewing it through a longer-term lens, potentially as a unique store of value or a portfolio diversifier, less swayed by short-term market noise.
However, this complex picture demands caution. The very influx of capital that fuels optimism also introduces fragility, as newer entrants with higher cost bases may be quicker to sell during downturns. The Golden Cross, while historically significant, remains a lagging indicator with no guarantee of future success. And the low beta, while encouraging, could prove ephemeral in the face of severe macroeconomic shocks or shifts in market sentiment.
Ultimately, Bitcoin's trajectory towards 2030 and beyond will depend on its ability to navigate these dynamics. Can it convert the current technical momentum and capital influx into a sustainable trend? Will its utility and adoption grow sufficiently to solidify its role beyond pure speculation? Will it continue to carve out a unique space in the financial ecosystem, proving its resilience and diversification benefits across various market conditions? The current signals suggest the potential is there, but the path forward remains intrinsically linked to broader economic forces, regulatory evolution, and the ever-unpredictable psychology of the market. Bitcoin is flashing signs of both renewed vigor and evolving character, making the coming months and years critical in defining its future role.

Bitcoin's 215-Day Pattern: Another Breakout Loading?The Bitcoin chart shows a repeating pattern of consolidation lasting 215 days before each major upward breakout. This cycle has occurred multiple times over the past two years, with each accumulation zone followed by a strong bullish rally.
Currently, Bitcoin is once again emerging from a similar 215-day consolidation phase, suggesting the potential for another significant move to the upside if the pattern holds. If history repeats, we could see a target around $150K.
BINANCE:BTCUSDT CRYPTOCAP:BTC

BTC Correction Likely Before ATHBTCUSDT technical analysis update
BTC price could drop to the GETTEX:89K –$91K range before moving higher. There's a CME futures gap at $90.7K, which may act like a magnet. BTC has strong support around $90K and may see a small pullback before reaching a new all-time high.

BITCOIN Ready for PUMP or what ?Currently, COINBASE:BTCUSD is forming an ascending triangle, indicating a potential price increase. It is anticipated that the price could rise, aligning with the projected price movement (AB=CD).
However, it is crucial to wait for the triangle to break before taking any action.
Give me some energy !!
✨We spend hours finding potential opportunities and writing useful ideas, we would be happy if you support us.
Best regards CobraVanguard.💚
_ _ _ _ __ _ _ _ _ _ _ _ _ _ _ _ _ _ _ _ _ _ _ _ _ _ _ _ _ _ _ _
✅Thank you, and for more ideas, hit ❤️Like❤️ and 🌟Follow🌟!
⚠️Things can change...
The markets are always changing and even with all these signals, the market changes tend to be strong and fast!!
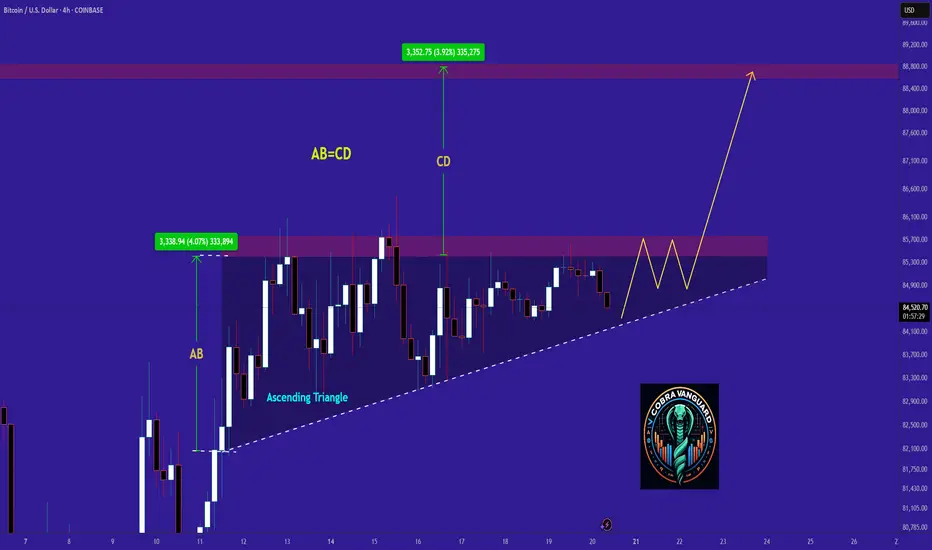
Bitcoin correction. Waiting for 70k-76kBitcoin correction. Waiting for 70k-76k
The previous idea suggested Bitcoin would reach $95,000-$100,000 before entering a 1-2 year bear phase alongside the U.S. stock market decline.
Bitfinex:
However, based on Coinbase orders in the $70,000-$76,000 range and recent BTC sell-offs on Bitfinex over the past three days, it looks like this correction is being dragged out to trigger more liquidations.
This crypto correction might also align with an SP500 drop. Waiting for lower levels to find good entry points.
Coinbase orders:
BTC/USDC Liquidation Heatmap
