Is BTC Bitcoin Overextended? My Bias Is Bullish With Conditions!This 30-minute chart 🌟 shows Bitcoin consolidating within a descending channel after a recent bullish breakout 🚀, with a potential bullish structure forming. The price is currently testing the upper boundary of the channel near $87,500 🛡️. If the price breaks below the channel and retests the equilibrium support, it could present a strong buy opportunity 💰 . Considering the broader analysis 🌍, a break above $87,926 with strong volume 🔥 would confirm bullish momentum toward $90,000 🎯 . Not financial advice. ✨
BTCUSDC

When will BTC break through 89,000?Currently, Bitcoin is in a strong upward trend. It has soared directly from a sideways movement at 84,000 to the resistance zone near 89,000. Now, with the price at 86,000, the market sentiment remains bullish.
If BTC maintains a stable sideways movement between 87,000 and 88,000, the bulls can gradually accumulate upward momentum. Once ready, BTC will undoubtedly break through 89,000.
Technically, Bitcoin has broken through the sideways range, and its moving averages show a bullish alignment. The 85,000 level has emerged as a significant support.
Fundamentally, factors such as global economic uncertainties, exuberant market sentiment, and a relatively relaxed regulatory environment are jointly driving the continuous upward movement of its price.
💎💎💎 BTCUSD 💎💎💎
🎁 Buy@85500 - 86000
🎁 TP 87000 88000 89000
The market has been extremely volatile lately. If you can't figure out the market's direction, you'll only be a cash dispenser for others. If you also want to succeed,Follow the link below to get my daily strategy updates

$BTC double top pattern detected 1H timeframe.As shown on the chart, a double top has formed on the CRYPTOCAP:BTC chart.
While the overall trend remains bullish, there is also a clear bearish divergence.
The question is — will CRYPTOCAP:BTC follow the technicals and see a short-term correction, or will it continue pumping as if nothing happened? Let’s wait and see!
DYOR

Bitcoin Plan B Update — a correction to $95,000-$100,000.I’m now expecting a correction to $95,000-$100,000.
After that, the bearish phase kicks in, targeting $5,000.

Continue to wait for BTC to break through 89,000Currently, Bitcoin is in a strong upward trend. It has soared directly from a sideways movement at 84,000 to the resistance zone near 89,000.
If BTC maintains a stable sideways movement between 87,000 and 88,000, the bulls can gradually accumulate upward momentum. Once ready, BTC will undoubtedly break through 89,000.
💎💎💎 BTCUSD 💎💎💎
🎁 Buy@85500 - 86000
🎁 TP 87000 88000 89000
The market has been extremely volatile lately. If you can't figure out the market's direction, you'll only be a cash dispenser for others. If you also want to succeed,Follow the link below to get my daily strategy updates

BTC IMF Tracking, Liquidation Frenzy, and Market PredictionsBitcoin's recent price action has been a rollercoaster, marked by significant gains, dramatic liquidations, and a confluence of macroeconomic factors that are shaping its trajectory. From the International Monetary Fund (IMF) officially tracking Bitcoin in cross-border finance to speculative predictions of a potential $87,000 surge, the cryptocurrency remains a focal point of intense market scrutiny.
One of the most noteworthy developments is the IMF's increasing recognition of Bitcoin's role in global finance. While the IMF previously issued warnings to El Salvador regarding its Bitcoin adoption, its decision to now track Bitcoin in cross-border financial flows signals a tacit acknowledgment of the cryptocurrency's growing significance. This shift reflects a broader trend of institutions grappling with the reality of digital assets, forcing them to incorporate these assets into their analytical frameworks.
Simultaneously, the Bitcoin market has witnessed a surge towards the $87,000 mark, triggering a wave of short liquidations. This phenomenon occurs when traders who have bet against Bitcoin's price are forced to close their positions at a loss as the price rises. The sheer magnitude of these liquidations, exceeding $110 million in a short period, underscores the volatility and the inherent risks associated with leveraged trading in the cryptocurrency market. The total market liquidations surpassing $200,000 in 24 hours only highlights the dramatic price swings and the vulnerability of short positions.
Adding to the complexity of the market dynamics is the emergence of another CME gap in the $84,000–$85,000 range. Historically, these gaps, which represent discrepancies between trading prices on the Chicago Mercantile Exchange (CME) and other exchanges, tend to be filled, suggesting a potential pullback in Bitcoin's price. This pattern creates a sense of uncertainty, with traders weighing the potential for further gains against the possibility of a corrective downturn.
Furthermore, the surge in Bitcoin open future bets on Binance, with an increase of $600 million, indicates heightened price volatility. Open interest, which measures the total number of outstanding futures contracts, often correlates with price movements. A rise in open interest alongside a price increase typically confirms an uptrend, but it also signals the potential for sharp price swings as more capital enters the market.
Market analysts are divided on Bitcoin's future trajectory. Some predict a "brutal bleed lower," while others foresee a break towards new all-time highs in the second quarter. The critical level to watch is $93,000. If Bitcoin can reclaim this level as support, it would significantly reduce the risk of a fresh collapse. However, until this threshold is breached, the market remains vulnerable to downward pressure.
On a more positive note, the S&P 500's reclamation of its 200-day moving average provides a potential tailwind for Bitcoin. This technical breakout in equities, coupled with similar signals in the cryptocurrency market, could indicate renewed bullish momentum. The correlation between traditional financial markets and Bitcoin has become increasingly apparent, with positive developments in equities often translating to positive sentiment in the crypto space.
Adding another layer to the narrative is the potential softening of the stance on reciprocal tariffs by Donald Trump. Some analysts see this development as a potential catalyst for a Bitcoin bottom. Any relaxation of trade tensions could boost investor confidence and create a more favorable environment for risk assets, including cryptocurrencies.
Finally, the concept of tokenized US gold reserves, as proposed by NYDIG, presents an intriguing long-term prospect for Bitcoin. While gold and Bitcoin are fundamentally different assets, the tokenization of gold on a blockchain could enhance the overall legitimacy and infrastructure of digital assets. This increased institutional acceptance could indirectly benefit Bitcoin by further integrating blockchain technology into mainstream finance.
In conclusion, Bitcoin's current market landscape is characterized by a blend of institutional recognition, intense trading activity, and speculative predictions. The IMF's tracking of Bitcoin in cross-border finance underscores its growing relevance, while the liquidation frenzy and CME gap highlight the inherent volatility of the cryptocurrency market. The interplay of macroeconomic factors, technical indicators, and speculative sentiment will continue to shape Bitcoin's trajectory, making it a fascinating asset to watch in the coming months.

BTCHello friends
You can see that after the price fell in the specified support area, the price was supported by buyers and caused the resistance to break, and now, when the price returns to the specified ranges, you can buy in steps and move with it to the specified targets, of course, with capital and risk management...
*Trade safely with us*

Bitcoin Price Analysis – Bullish Setup with Caution AheadThe short-term trend is bullish, as we observe:
- Price movement is above the short- and medium-term moving averages.
- The price is forming higher highs and higher lows.
- Support levels are steadily rising along the moving averages.
However, there is a noticeable loss of momentum in recent hours, which could signal a potential short-term correction or profit-taking phase.
Bullish Indicators
Moving Averages:
- The 10 EMA, 20 EMA, and 30 EMA are all indicating a Buy signal.
- The 200 EMA also reflects a Buy signal.
- This indicates that the price is trading above key averages, supporting the continuation of the bullish trend.
ADX = 29.49 (Buy): The strength of the current trend is still significant (above 25), which reinforces the continuation of the bullish movement.
MACD (Buy): The MACD has shown a positive crossover, which supports the bullish signal and continued upward momentum.
Bearish Indicators
Momentum = Sell (Value: 4,249.13): There is a noticeable slowdown in momentum, which may indicate the early stages of a correction or temporary weakness.
Some Long-Term Averages = Sell: The 50, 100, and 200 Simple Moving Averages are showing sell signals, suggesting the longer-term trend has not yet fully transitioned into a bullish phase. These may also act as resistance if the price continues to rise.
Stochastic RSI Fast = 90.56 (Overbought): This indicator is in the overbought zone, pointing to a potential near-term pullback.
RSI = 53.34 (Neutral to Overbought): Not yet in the overbought territory, but gradually approaching it, which should be watched closely.
2025 Performance Lagging: The latest chart shows that 2025 performance is currently at -6.46%, compared to a strong +111% in 2024. This discrepancy suggests a phase of ongoing profit-taking or broader consolidation.
Outlook
Short-Term (Hours to Days): There is a potential for further upside with key resistance levels at 88,500, 89,000, and 90,000.
The nearest support levels are at 87,500 and 86,800.
However, caution is advised due to signs of short-term exhaustion in indicators like Stochastic RSI and Momentum.
Medium-Term (Weeks): As long as the price holds above the 86,000–86,500 range, the uptrend is likely to continue. A breakout above 90,000 would be a strong bullish signal that could drive the market to new highs.
Recommendation
- For Short-Term Traders: Take advantage of the current move but remain cautious of sudden corrections.
Watch for potential buy zones near 87,000 and 86,500. Use a tight stop-loss strategy if these support levels are broken.
- For Medium/Long-Term Investors: Indicators show that the uptrend is starting to stabilize.
Consider partial entry now while closely monitoring the 90,000 level.
Avoid going all-in at current levels and keep capital aside to buy dips if the market corrects.

the price of BTC has gone upIn the recent analysis of the cryptocurrency market, I have continuously been optimistic about the price trend of BTC. Since the last analysis, the price of BTC has steadily climbed from around 84,000 to the current 85000, further verifying the previous upward expectations.
🎁 Buy@83500 - 84000
🎁 TP 86000 - 87000
The market has been extremely volatile lately. If you can't figure out the market's direction, you'll only be a cash dispenser for others. If you also want to succeed,Follow the link below to get my daily strategy updates

BTC encountered strong resistance 89000I made an analysis this morning. I said that if the price of Bitcoin breaks through the resistance level of 87,000, it's very likely to rise all the way to 88,000 in one go, and then it will encounter the resistance level at 89,000. Look, my analysis has been verified now. It has been proven that the resistance level at 89,000 is indeed effective.
At present, it's not advisable to engage in short - selling. Instead, one can consider taking long positions again at the support level.
💎💎💎 BTC 💎💎💎
🎁 Buy@85000 - 86000
🎁 TP 88000 - 89000
The market has been extremely volatile lately. If you can't figure out the market's direction, you'll only be a cash dispenser for others. If you also want to succeed,Follow the link below to get my daily strategy updates

BTC Today's analysisDuring the recent continuous and close tracking of the cryptocurrency market dynamics, I have always maintained an optimistic view on the price trend of BTC.
As it turns out, this prediction has been strongly validated by the market. Since the last market analysis, the price of BTC has shown a strong upward momentum, steadily climbing from an initial price of around 84,000 to the current remarkable 85,200.
💎💎💎 BTC 💎💎💎
🎁 Buy@83500 - 84000
🎁 TP 86000 - 87000
The market has been extremely volatile lately. If you can't figure out the market's direction, you'll only be a cash dispenser for others. If you also want to succeed,Follow the link below to get my daily strategy updates

Bitcoin at a Critical Juncture – Breakout or Breakdown? 📉 BTC is at a key decision point! After pulling back from recent highs, it's now consolidating within a range, sitting right in the middle of the previous price swing. I'm keeping a close eye on this zone—if price breaks out, a high-probability trade opportunity could emerge.
🎯 In this video, we dive deep into price action and market structure, breaking down a potential trade setup—if the market aligns with our strategy.
🚨 Trade smart, manage risk—this isn’t financial advice! 🚀🔥

BTC You'll regret it if you don'tBTC has been floating at 84000 today, yesterday it touched resistance at 87000, today's resistance is still valid, with the Fed's information, gold's rally has been full down, and more people will pay attention to BTC next
💎💎💎 BTC 💎💎💎
🎁 Buy@83500 - 84000
🎁 TP 86000 - 87000
The market has been extremely volatile lately. If you can't figure out the market's direction, you'll only be a cash dispenser for others. If you also want to succeed,Follow the link below to get my daily strategy updates

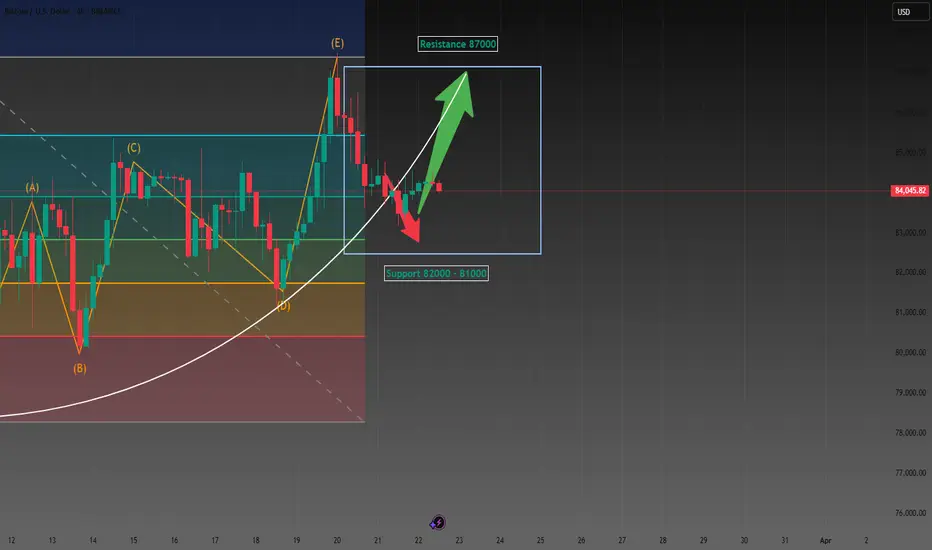
Bitcoin Market Analysis: Bullish OutlookCurrently, BTC price hovers around 84,000, showing a clear consolidation. In recent trading, bulls and bears are in a tight tussle at this price range.
Support Level Analysis
I peg the support at 81,000 - 82,000. Technically, this range is significant. Historical data indicates that as the price approaches this area, strong buying momentum emerges. During previous market corrections, this price band effectively halted sharp downward trends. Moreover, the concentrated distribution of holdings within this range implies that numerous investors have cost - bases here. Their unwillingness to see the price drop below their investment costs acts as a buffer, propping up the support.
Resistance Level Analysis
The resistance stays at 87,000. K - line trends reveal intense selling pressure when price approaches this mark. Multiple prior break - through attempts failed, with price retreating each time. This implies a large number of trapped or profit - taking positions at 87,000. As price nears, investors rush to sell, creating a strong resistance that curbs upward movement.
Bullish Reasons
Despite the current consolidation, I'm bullish. Economically, the global recovery boosts investors' risk appetite, drawing more to BTC as an innovative asset. Growing institutional interest, with BTC being added to portfolios, provides a solid price - rising base. Market sentiment is positive on Bitcoin's long - term prospects, buoyed by blockchain tech growth and wider applications. Technically, long - term indicators like the upward - diverging moving average show the long - term uptrend intact. Even with reduced trading volume during consolidation, market activity remains. New positive factors could easily break the current range and push price towards the resistance.
💎💎💎 BTC 💎💎💎
🎁 Buy@83500 - 84000
🎁 TP 86000 - 87000
The market has been extremely volatile lately. If you can't figure out the market's direction, you'll only be a cash dispenser for others. If you also want to succeed,Follow the link below to get my daily strategy updates

XAUUSD- short term downtrend H3 continue, sidewayGold Short-Term Downtrend (H3):
Gold is showing bearish momentum on the 3-hour chart, forming lower highs and lower lows. Sellers remain in control unless key resistance levels are broken. Watch for potential support around recent swing lows.

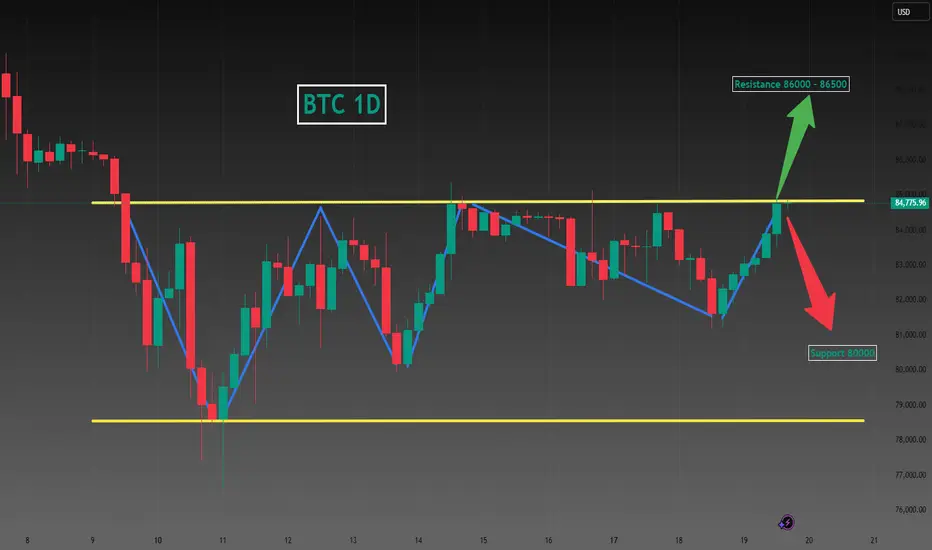
Let's always put our trust in BTC, mate.Bitcoin Market Analysis
BTC price hovers around 84,000 in consolidation. Bulls and bears battle at this price.
Support Level
Support is in 81,000 - 82,000. Strong buying emerges there. It stopped drops in past corrections. Dense holdings mean many cost - bases are in this range, propping up support.
Resistance Level
Resistance at 87,000. K - lines show heavy selling near it. Past break - throughs failed. Trapped or profit - taking positions sell as price nears, creating resistance.
Bullish Outlook
I'm bullish. Global recovery raises risk appetite for BTC. More institutions hold BTC, boosting price. Positive sentiment on long - term prospects, due to blockchain growth, helps. Upward - diverging moving averages show uptrend. Lower volume in consolidation, but activity stays. New positives may push price to resistance.
💎💎💎 BTC 💎💎💎
🎁 Buy@83500 - 84000
🎁 TP 86000 - 87000
The market has been extremely volatile lately. If you can't figure out the market's direction, you'll only be a cash dispenser for others. If you also want to succeed,Follow the link below to get my daily strategy updates
Global Tensions, Market Manipulation, and BTC Uncertainty The cryptocurrency market, a realm notorious for its volatility, is currently grappling with a confluence of factors that are forcing investors to reassess their strategies. Global trade tensions, macroeconomic uncertainties, and the intricate dance of market manipulation are all contributing to a complex and unpredictable landscape. Specifically, Bitcoin, the flagship cryptocurrency, is experiencing a period of intense scrutiny, with analysts offering a range of perspectives on its potential future.
A recurring theme in recent analyses is the notion of "whale manipulation." Reports suggest that large holders, or "whales," are engaging in strategic trades on exchanges like Binance to influence Bitcoin's price. This "liquidity massaging" is seen as a deliberate attempt to create artificial price ceilings, with some analysts predicting that Bitcoin's upward momentum could be capped below $90,000, and more conservatively, $87.5K. Such manipulations introduce uncertainty, making it difficult to discern genuine market sentiment from artificially inflated or deflated prices.
Adding to the complexity is the debate surrounding retail investor participation. Contrary to the prevailing narrative of retail investors being absent, some crypto executives argue that they are already actively involved. This perspective challenges the notion that a surge in retail interest is needed to propel Bitcoin to new heights. If retail participation is already significant, the anticipated catalyst for a bull run may have already materialized, leaving investors to wonder what new catalyst is needed for further price appreciation.
Data from Bitcoin's Realized Cap and UTXO (Unspent Transaction Output) analysis is also signaling a "major shift." These metrics, which offer insights into the actual value stored within the Bitcoin network and the movement of coins, are crucial for understanding the underlying health of the market. Changes in these indicators can foreshadow significant price movements and shifts in investor behavior. Traders are closely monitoring these metrics for clues about Bitcoin's future direction.
However, despite recent attempts to pare losses, Bitcoin is struggling to maintain a consistent uptrend. This instability has led some traders to adopt a bearish stance, with predictions of a potential drop to as low as $65,000. These bearish sentiments are fueled by the inability of Bitcoin to decisively break through resistance levels and the persistent volatility that characterizes the current market.
Conversely, some analysts are finding bullish signals by examining indicators that also correlate with the Nasdaq. The correlation between traditional financial markets and the cryptocurrency space has become increasingly evident, and analyzing these relationships can provide valuable insights. If the Nasdaq shows signs of strength, it could potentially buoy Bitcoin's price. However, this correlation is not always consistent, and the inherent volatility of both markets can lead to unpredictable outcomes.
The performance of U.S. spot Bitcoin ETFs is another critical factor influencing market dynamics. The collapse of the "cash-and-carry" trade, a popular arbitrage strategy, has had significant implications for investors. The stagnation of inflows into these ETFs, compared to the initial surge earlier in 2024, has raised concerns about the sustainability of institutional interest. While there have been recent reports of net inflows returning, questions remain if this is a temporary blip, or a sustained uptrend. This fluctuation in ETF inflow signals a wavering confidence from institutional players.
The combination of these factors creates a challenging environment for investors. Global trade tensions, which can disrupt economic stability and investor sentiment, add another layer of uncertainty. Fluctuations in traditional markets, geopolitical events, and regulatory developments can all have a ripple effect on the cryptocurrency market.
In this tumultuous landscape, investors are advised to exercise caution and adopt a diversified approach. Relying solely on technical analysis or market sentiment can be risky. Instead, a comprehensive strategy that incorporates fundamental analysis, risk management, and a deep understanding of market dynamics is essential.
The current situation highlights the inherent volatility and complexity of the cryptocurrency market. While Bitcoin remains a dominant force, its future trajectory is far from certain. The interplay of whale manipulation, retail participation, technical indicators, and macroeconomic factors creates a dynamic and unpredictable environment. Investors must remain vigilant, adapt to changing conditions, and prioritize risk management to navigate this challenging terrain successfully.

BTC Breaks Structure - Key Levels to Watch PLUS Trade Idea!Bitcoin has broken structure to the upside on the daily timeframe, confirming a bullish trend 📈. I’m considering a buy opportunity, but only if the key conditions discussed in the video align.
Right now, BTC is in a strong uptrend, with a well-defined higher highs and higher lows structure on the 4-hour timeframe 🔍. In this video, we break down the trend, price action, market structure, and other essential aspects of technical analysis to navigate this setup effectively.
⚠️ Not financial advice.

Bitcoin BTC price analysis, FOMC 19/03 - FED rateOur previous idea for OKX:BTCUSDT worked out 10 out of 10
Well, let's try to hit it again !)
Yesterday, CRYPTOCAP:BTC price showed growth despite the fact that the Fed left the rate unchanged yesterday #FOMC
In short, Powell said that he was "hesitant" to cut the rate now because it is not known how the economy will be affected by the new "economic tariffs and economic wars" that come into effect in early April. In the US, one "grandfather" does not know what to expect from the other "grandfather" ))
Nevertheless, #BTCUSD price has every chance of reaching $94k in the coming days.
And then, I would like to see a decline in BTC.D and USDT.D, which in turn will allow altcoins to "stop collapsing", and some low-liquid ones, which are easier to pump, will show good growth, such as X Empire.
👀 In general, the last 2 months have been: "not about making money, but about surviving and keeping the deposit, even with a drawdown", but the next 3 months may be very much about making money.
_____________________
Did you like our analysis? Leave a comment, like, and follow to get more

BTC Current situationCurrently BTC has not reached the resistance point of 85000, we can directly choose to go short。
BTC
🎁 Sell@84900 - 85000
🎁 SL 86000
🎁 TP 83900 - 83500
Traders, if you liked this idea or if you have your own opinion about it, write in the comments. I will be glad
If you also aspire to achieve financial freedom,Follow the link below to get my daily strategy updates
$9.4M Bitcoin Short Squeeze and its Market ImplicationsThe volatile nature of the cryptocurrency market is a well-established fact, but the sheer scale of some trades can still send ripples across the entire ecosystem. Recently, a Bitcoin whale executed a masterful maneuver, closing a $516 million short position with a staggering 40x leverage, pocketing a cool $9.4 million profit in just eight days. This event, occurring shortly after a lower-than-expected Consumer Price Index (CPI) reading, highlights the intricate interplay between macroeconomic indicators, market sentiment, and the strategic actions of large players.
The whale's decision to close the short position immediately following the CPI release is particularly noteworthy. The lower-than-expected inflation figure signaled a potential easing of monetary inflation concerns, a development that is generally viewed favorably by Bitcoin investors. This optimistic signal likely triggered a shift in market sentiment, prompting the whale to capitalize on the impending price surge.
The use of 40x leverage amplified both the potential gains and the risks associated with the trade. While it allowed the whale to generate a substantial profit in a short period, it also exposed them to significant losses if the market had moved against their position. This high-risk, high-reward strategy is characteristic of whale activity, where large players leverage their capital and market insights to execute impactful trades.
The timing of the trade also underscores the importance of macroeconomic indicators in shaping Bitcoin's price trajectory. The CPI reading, a key measure of inflation, directly influences monetary policy decisions by central banks. Lower inflation can lead to a more dovish stance, potentially resulting in lower interest rates and increased liquidity, both of which are conducive to asset price appreciation, including Bitcoin.
Interestingly, Tuesday has emerged as Bitcoin's most volatile day in 2025.2 This heightened volatility can be attributed to the release of key economic data, including the CPI, as well as the influence of global economic trends. Market participants anticipate increased activity on Tuesdays, making it a crucial day for traders and investors to monitor market developments.
Despite the recent correction, Bitcoin's long-term outlook remains a subject of intense debate. While some analysts believe the bull run is over, citing on-chain metrics and expecting up to 12 months of bearish or sideways price action, others maintain a more optimistic perspective, predicting a potential rally to over $200,000.
The recent whale trade, coupled with the resumption of Bitcoin accumulation after three months of distribution, suggests that underlying demand for Bitcoin remains strong.3 This accumulation, particularly by long-term holders, can act as a stabilizing force, mitigating the impact of short-term price fluctuations.4
The "Bitcoin Price Prediction 2025: BTC Eyes Breakout, But Sellers Still In Control" sentiment accurately reflects the current market dynamics. While the potential for a breakout remains, the presence of significant selling pressure cannot be ignored. The interplay between bullish and bearish forces will continue to shape Bitcoin's price trajectory in the coming months.
The notion that the "Bitcoin bull cycle is over" is supported by some on-chain data, which can reveal information about investor behavior and market trends. However, interpreting on-chain metrics requires a nuanced understanding of the underlying data and its limitations. While these metrics can provide valuable insights, they should not be the sole basis for investment decisions.
Bitcoin's resilience in the face of market corrections is a testament to its growing adoption and acceptance as a mainstream asset. Despite the current correction, the cryptocurrency's ability to outperform global assets post-Trump election further reinforces its potential as a long-term investment.
The whale's $9.4 million profit is a reminder of the potential for substantial gains in the cryptocurrency market. However, it also highlights the inherent risks associated with high-leverage trading. Investors should exercise caution and conduct thorough research before engaging in such strategies.
In conclusion, the Bitcoin whale's strategic short squeeze and the subsequent market reactions underscore the complex interplay of factors influencing Bitcoin's price.
Macroeconomic indicators, market sentiment, and the actions of large players all contribute to the cryptocurrency's volatile nature.5 While the long-term outlook remains uncertain, the resumption of Bitcoin accumulation and the potential for a breakout suggest that the market is far from stagnant. Investors should remain vigilant, closely monitoring market developments and adapting their strategies accordingly. The story of the whale's successful trade is a potent reminder of the fortunes that can be made, and lost, in the dynamic world of cryptocurrency.

The current BTC chart, incorporating my 'flash-crash' thesisThis chart illustrates the current Bitcoin pattern, with my 'April flash crash thesis.'
I believe we will see another thrust lower into the green box ranges before a spring into the fifth wave. However, the fifth wave will be a "false breakout," as a flash crash in mid to late April is likely to occur, intentionally designed to sweep liquidity by liquidating overleveraged positions and triggering stop losses—driving price past the previous low set in the green box, only for the market to recover shortly thereafter and continue its breakout to the upside. This breakout will likely push beyond the pattern, taking out the all-time high, and setting a new high somewhere in the 20K to 25K range.
There could be some opportunities in the next 4 to 6 weeks, but with opportunity comes risk. Always use a proper risk management strategy suited to your skill level and wallet size.
Good luck, and always use a stop loss!

BTC Today's analysis
BTC has been fluctuating at 84000 to 84500 yesterday, very stable, like a crocodile waiting for food to come, so we should always be vigilant
BTC 🎁 Buy@83000 - 83200
🎁 SL 83500
🎁 TP 84500 - 84800
If you're struggling to find direction or generate profits in finance,
I'm here to help. As a seasoned financial analyst,
I'm great at decoding market signals for profit - making chances.
I'll customize a plan for you. Contact me now to start seeing financial gains!
