BTC Bull & Bear historical Periods 3 Bull & Bear Markets
Bull markets took around 152 weeks...
then
V
v
v
v
v
Bear Markets took around 52-59 weeks..
then
v
v
v
v
v
v
v
Bull Market gain...
----------------------------------------------------------------------------------------------------------
After 2021 ATH
BTC recorded his current bottom after 52 weeks ( 15500 $).
BTC pumped after 59 weeks .
then what ?
Will the history will repeat itself again ??
if we will be alive inshallah ,we will see the next 152 weeks to ( October - November 2025 ) if this will be the New ATH of the next bull market or not :D
It is not a financial advice , PLZ DYOR
Btcusdforecast

NEW BTC HIGHS?BTC just broke a previous resistance zone. Previous data indicates a more upward push.
This may even lead to new highs.
Bitcoin Walks Into a Robust Resistance AreaFenzoFx—Bitcoin remains bullish above the 50-period simple moving average at around $93,950. A doji candlestick on the daily chart signals potential consolidation or a bearish move.
Resistance spans from $94,990 to $99,420, suggesting a possible reversal. We recommend waiting for Bitcoin’s reaction before planning a strategy.

Bitcoin Tests Critical Resistance Level: What's Next?FenzoFx—Bitcoin is testing the $88,650 resistance, a level it has rejected more than three times. The Stochastic and RSI 14 indicators remain in overbought territory, indicating short-term overvaluation. Entering the market at this price is not recommended.
If BTC/USD stays below $88,650, a consolidation phase may follow, with potential dips to $88,140 and $82,810.
Bullish Scenario
The bearish outlook is invalidated if BTC closes above $88,650, potentially resuming the uptrend toward $90,000.

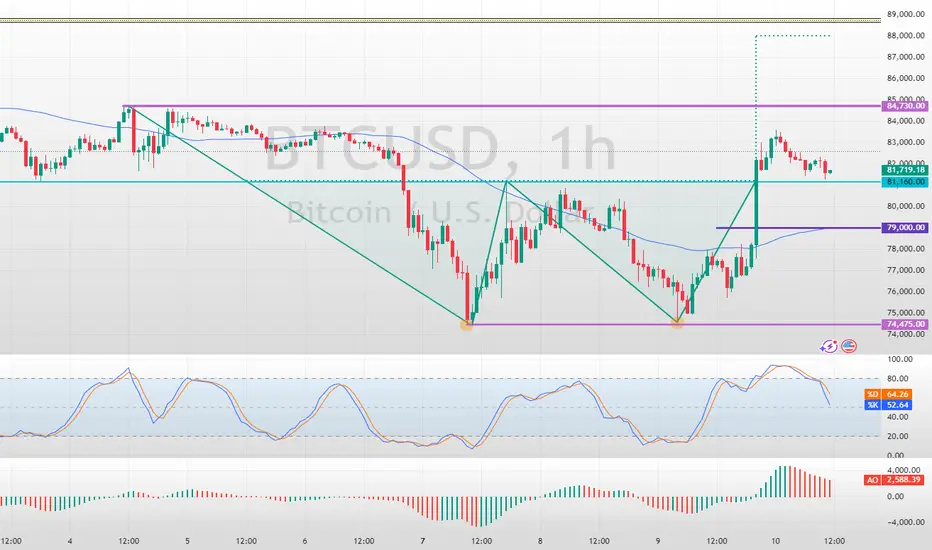
Bitcoin Double Bottom Pattern Came into PlayFenzoFx—Bitcoin jumped upward from $74,475 support as expected due to the formation of a double bottom pattern on the 1-hour chart, which is a bullish signal.
As of this writing, the price is stabilizing and testing the $81,160 mark as support. However, the 50-SMA on the 1-hour chart serves as the pivot point between the bull and bear market.
The next bullish target could be $84,730, followed by $88,000 if BTC holds above the discussed moving average.
Trade BTC/USD Swap Free at FenzoFx Decentralized Broker
BTCUSD hourly trend analysis for April 09, 2025BTCUSD made a double bottom formation. Any upward move will test the resistance at 80,047 and there is a strong support at 73,481. The Timing indicator is bullish from April 10th onwards. Trade with stop loss.

BTCUSD LONG Rebound BTCUSD Rebound until 78.60 Fibbonacci level and after that sell until 1h orderblock downside.

BTCUSDT, We were moved like ...Hello everyone
According to the chart that you can see the price movement was exactly moved to our route but at this time we expect because of the reason in world and US Reciprocal Tariffs at this time Gold movement is important after the Gold start the corretion wave the smart money comes to the cryptocurrency market and we expect the excitement movement.be patient until ...
Be Lucky
AA
BTCUSD hourly trend analysis for April 04, 2025It is in a bearish trend. Sell signal has confirmed the Stop Loss at 83382. This pair has a strong support at 82074 and 80900.

BTC, ALL Goes down!!The pattern says till 82,111 it can come! the pattern says, happened in 2022 may 5th or 6th, enjoy!


BITCOIN Trending Higher - Can Bulls Maintain Momentum?COINBASE:BTCUSD is trading within a well-defined ascending channel, with price action consistently respecting both the upper and lower boundaries. The recent bullish momentum indicates that buyers are in control, suggesting a potential continuation toward higher levels.
The price has broken above a key resistance zone and successfully retested it as support, confirming the bullish structure. This retest strengthens the case for further upside, with the next target aligning with the upper boundary of the channel near $91,000.
As long as the price remains above this newly established support, the bullish outlook stays intact. However, if the price fails to hold above this zone, a deeper pullback toward the midline or the lower boundary of the channel could come into play.
Remember, always confirm your setups and trade with solid risk management.
Best of luck!


BTC Buy SETUP for todayThis is a BTCUSD buy setup with ENTRY< STOP LOSS TAKE PROFITS LEVES for today 23 of March 2025

Btcusd trade idea e read caption This chart represents a technical analysis of Bitcoin (BTC/USD) on the 1-hour timeframe from Coinbase. Here are the key elements of the analysis:
1. Order Block (Green Zone):
The green zone represents a significant order block, indicating an area where institutional buying or selling activity previously took place. The price has reacted strongly to this zone, confirming its importance.
2. Entry Point (White Line & Label):
The price has broken above the order block, suggesting a bullish entry. This level is marked as an optimal entry zone for a long position.
3. Price Movement & Target Levels (Yellow Arrows):
Two yellow arrows suggest that the price is expected to move upwards towards key resistance or profit target zones.
4. Target Levels (Dashed Lines & Blue Labels):
$88,000.17 and $90,681.03 are identified as potential profit targets, indicating resistance levels where the price may face selling pressure.
5. Current Price & Trend:
Bitcoin is currently trading at $85,511.26, with a 3.40% increase. The strong breakout suggests bullish momentum.
6. Market Volume (Right-Side Volume Profile):
The volume profile on the right shows high trading activity around the $84,000 level, which could act as support in case of a pullback.
Summary:
A breakout above a key order block suggests bullish continuation.
Entry is positioned above the breakout.
Target levels are set at $88,000 and $90,681.
High probability of upward movement based on volume and trend analysis.
This analysis suggests a bullish setup with potential gains if the price sustains above the order block and moves toward the target zones.

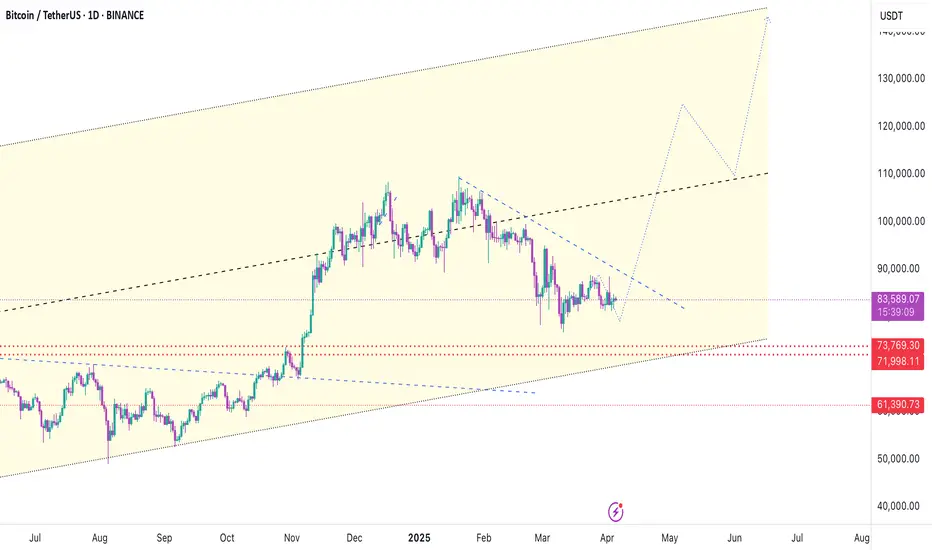
BTC , road map
"Hello traders, when considering BTC, the decision-making process should align with your strategy as either a holder or trader. In high time frames, based on the (FVG) concept, BTC's price could potentially reach $180,000. However, for short-term traders, the price might dip to the $70,000 zone initially. I anticipate a pullback to $92,000, after which I will evaluate candle formations to determine a selling position.
Please note that this analysis is subject to updates over time."
If you have any specific questions or need further assistance with your message, feel free to let me know!

BTCUSDT, Bearish Scenarios for upcoming days ...Hello Traders, Hope you're great.
for Upcoming days, I anticipate 2 Bearish scenarios :
In First Scenario, I expect price does an upward correction to the nearest broken support level that became to an important supply zone around 91-93K and after that starts to drop.
in Second scenario, I expect price does a further upward correction and goes to the supply zone around 95-97K and after that start a major downward movement.
Targets are 85K, 82K and my final target is 77K.
Don't forget to use proper risk management.
And finally tell me what do you think about BTCUSDT, UP or DOWN ? comment your opinion below this post.

BTC Bitcoin - Upside Likely THIS WEEK (Thanks Retail Liquidity)Here's a challenge for you:
How many places of built-up liquidity can you spot on this chart that indicated where price is heading to...?
Post your chart below.
Admittedly this isn't the easiest environment to trade in, but still the clues are there.
Plus: DXY Dollar is weak for now, so XXXUSD seem more likely to be Bullish.
Now we stalk it and wait to see the flip to the Upside (if it happens). The invalidation point is the clear last Wick low.
There could be more opportunities later to scale in.
------------------
Are you seeing price action here the same as I am?
If not, comment below and tell me if I'm missing something...

BTCUSD- hi friends, I use different strategies to make my analysis. So , this is my short term trade for BTCUSD. Thank you so much and have a safe trading ahead. please be careful with your trade and trade according to your account balance after checking all the safety parameters, i.e. Risk management, etc
thank you and have a good time aheaa

BTC's next market trendHello traders
The price is consolidating between 100096 and 96700, indicating a potential upward move toward 100096. If the price breaks above this level with strong momentum and volume, it is likely to continue rising toward 102360, where it may enter the bullish zone. Further bullish movement could push the price toward 106961, where it might face stronger resistance. The ascending trendline and recent bullish attempts suggest that buyers are trying to gain control, supporting the bullish outlook.
If the price fails to break 100096 and reverses, it may retest the lower support at 96700. A confirmed bearish trend will start if the price drops below 96700 and exits the ascending channel, leading to further downside movement. In that case, possible support levels to watch are 93723 and 91579, where buyers might attempt to regain control.
Traders, if you find this analysis helpful or have your own insights, drop a comment below! I’d love to hear your thoughts.


Public trade #11 - #BTC price analysis ( Bitcoin )At the moment, the CRYPTOCAP:BTC price is making an A-B-C correction within the channel quite harmoniously.
The idea is as follows:
🔽now the market is correcting for a few days and the lower the better.
🔼And then on January 20, Trump will be inaugurated and, as the “messiah,” he will “make life easier” for crypto investors by some decree and the market will break out in growth.
1️⃣ So the first stop of the OKX:BTCUSDT correction should be around $93-94k, and from there, growth can break up to $110k.
2️⃣ The second option is a correction of the #Bitcoin price around $86-87k.
❗️ It's also worth remembering that 29.01.25 is the announcement of the “fresh” Fed Funds rate. And given the fact that inflation has increased this month, the Fed's rate cut is in jeopardy, at best it will be left unchanged.
P.S:
Please excuse the fact that there are so many levels on the chart, but they work well and can be used in trading!)
_____________________
Did you like our analysis? Leave a comment, like, and follow to get more

btc chart in this weekHi guys
There is some area could be seen in this week ,
I don't suggest to trade with my area but I think they are valuable to take some risk, although there is always a danger ( use stoploss ) .
Comment and like if you want to know more.
Thanks
