BTCUSD top-down analysisHello traders, this is the full breakdown of this pair. We will take this trade if all the conditions are satisfied as discussed in the analysis. Smash the like button if you find value in this analysis and drop a comment if you have any questions or let me know which pair to cover in my next analysis.
Btcusdforecast

BTCUSD another drop ahead?BTCUSD(Daily) is in long term drown trend except for last month some expected retracement to the upside. As the price currently testing the previous support as resistance, it is a high probability that the price continues to drop as the bears are very stronger than the bulls.
If you enjoy this idea, do not hesitate to press the like button :)

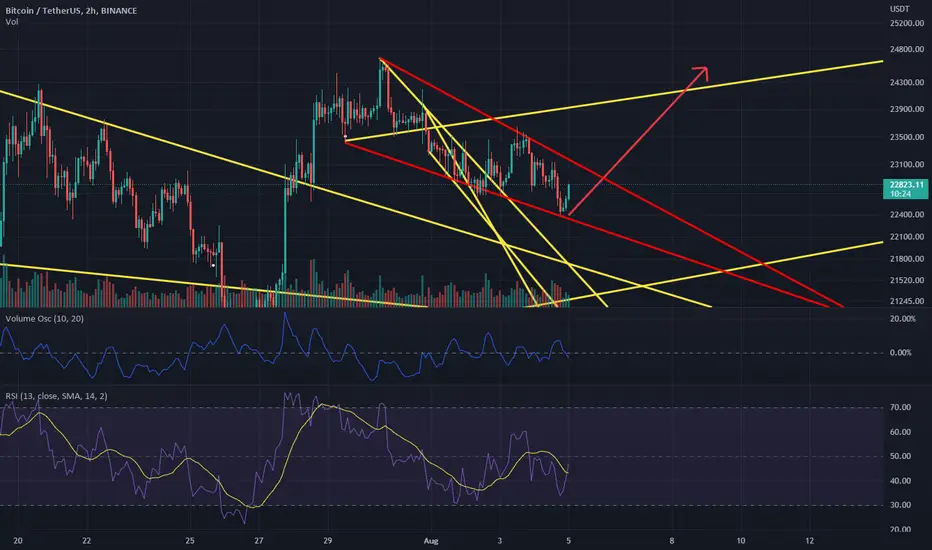
Time to Re-Long! In my previous analysis I expected bitcoin to rise from the 22.8k$ area, but it seems like btc decided to fall down a bit lower.
Bitcoin is still very bullish to me, and I am still expecting the same uptrend I did in the previous analysis!
Keep your stop loss at around $22,000-$22,250! Do not put Stop loss above that just in case of a shakeout !
BTC / USDT - BIG MOVE INCOMING!BTC / USDT - BIG MOVE INCOMING!
Something big is brewing.
I believe the bottom is in UP ONLY FROM HERE!

BTC 21300$...................................................................................................................................................................................

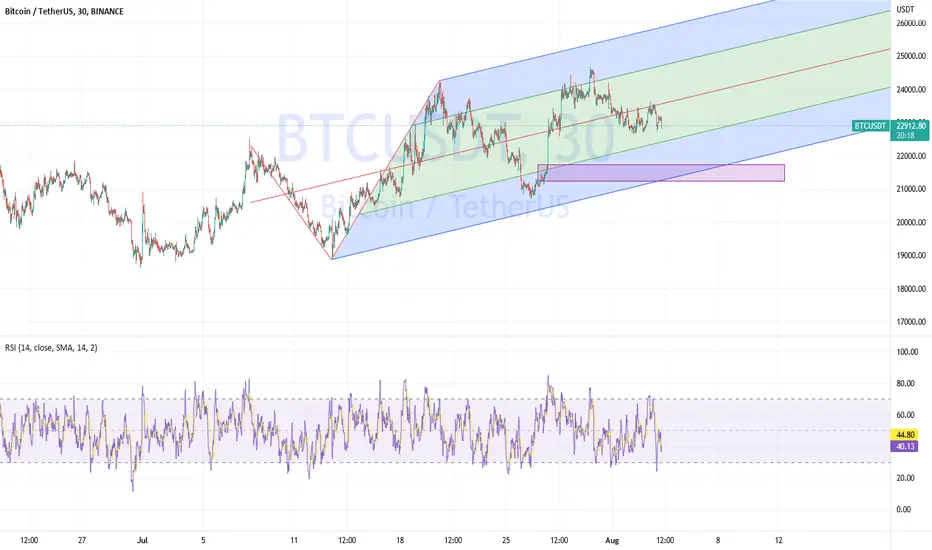
btc long o 23800BTC breaks the downtrend in 30 minutes chart. so I expect it to reach 23800 which hits the daily trendline.

BTCUSDT 6h Long medium-term BTC trade to $28974Today we bring to your attention Medium-term trade for the BTCUSDT trading pair within the framework of our previous idea.
Everything happened as we imagined, expected and wrote in previous Bitcoin idea.
There was another upward impulse BTCUSD price to $24700 and from there a downward correction began, which continues 5 days.
Now signals have begun to appear for the emergence of a new growth impulse, so we offer to your attention a medium-term BTC trade on the following terms:
Entrance $23011
Stop $20994
Take profit $28974
Profit/loss ratio is 3/1
_______________________________
Since 2016 , we have been analyzing and trading the cryptocurrency market.
We transform our knowledge, trading moods and experience into ideas. Each "like under the idea" boosts the level of our happiness by 0.05%. If we help you to be calmer and richer — help us to be happier :)

BTC / USDT - 0 HOPEBitcoin is going to **** and there is nothing you can do about it sorry LMAOROFLOLOLOHAHAHAHIHIHIHI

#Bitcoin Potential Rally to $32k by November 7th!!BTC Exclusive chart: This is an amazing development in Bitcoin's price action.
If you are reading this congratulations, you made it this far, you are gonna make it all the way to the next BULL RUN too!
The one with patience will be awarded eventually.
WHEN RICHES COME, IT COMES IN SUCH ABUNDANCE THAT ONE THINKS ABOUT WHERE THEY HAVE BEEN HIDING DURING THOSE LEAN YEARS!! Believe me, it’s true! You'll feel this when the right time comes.
Many people lost. A lot of their lifetime savings, it;’s time you prepare NOT TO repeat the same mistakes in the coming years.
This is why rather than just gambling on futures, look at the long picture, and zoom out a bit. Good things take time.
So the message is not to make mistakes and choose the right step to ensure your sustainability till BTC covers the next bull run.
Now let's get back to Bitcoin.
Apart from all of the previous FUDs, Bitcoin managed to close above the most important area $20k.
Multiple indicators are showing signs of reversal.
For example,
1. RSI: The RSI has been this low only during the covid crash in March 2020 and capitulation in Dec 2018.
Apart from that, no one thought about $17k tbh, even I didn’t expect a low below $20k and a break below 200 Weekly
SMA. most people didn't, exactly the reason why it happened.
2. MACD:- is due for a bullish crossover.
3. NVT (Network Value to Transaction):- One of the best Bottom indicators which work in Higher time frames like weekly and monthly is also pointing towards the same.
(Please observe the chart)
All these indications and fractals (observe the chart)are reaching a point where we can expect BTC to hit at least $28k to $32k by the end of the first week of November to hit the 50 Weekly Moving Average.
WARNING (FINAL SHAKEOUT):- See, logically everyone will turn bullish in a week or two and that is when you’ll see a double-digit negative rally in BTC all the way down to the $20.6k level.
This will be the final shakeout before we shoot all the way to $28k.
If this event occurs, since it’s all speculation based on charts, Price Action, and Logic, I believe that will be the best opportunity to buy BTC around the $20k level.
CONFIRMATION:- We had 6 consecutive weekly closes below the 200 WMA, so for this breakout to be legit we need a couple of candles holding the same level. If the current weekly candle which closes in 5 Days and 14 hours, holds the level, The uptrend will be confirmed.
All of the above points have been observed from the charts added with my personal opinion. This is not financial advice and will never be. Please do your own research before you take any trade.
Let me know what you think!
Your views are very important and I learn from them.
I appreciate everyone reading this work, Please HIT the like button it helps!
Thank you and God bless you
#PEACE

Btcusdt roadmapBtcusdt wyckoff redistributation pattern
Thats my analyse
I think we still in bear market

Again More Short on BTC!!- Price did not go as we expected... it reached to the previous origin as shown in the image...
- Now think we can see a reaction to the origin FVG...

BTC Technical,Some possible scenario's. What do you guys think? Some possible scenario's.
If support (white line) break, i think btc will test previous lows again. 19-20k
For now we are stuck in this rising channel. Rising channel is bearish but i do think we will first get a rally to 28-30K before we test previous lows (20-22k)

BTC: Sell Rallies!Bitcoin
Intraday - We look to Sell at 24098 (stop at 24611)
Trading within a Corrective Channel formation. A Doji style candle has been posted from the high. Bearish divergence is expected to cap gains. We look for a temporary move higher. Trend line support is located at 21300. A lower correction is expected.
Our profit targets will be 22802 and 22202
Resistance: 23500 / 24000 / 24600
Support: 23000 / 22000 / 21500
Please be advised that the information presented on TradingView is provided to Vantage (‘Vantage Global Limited’, ‘we’) by a third-party provider (‘Signal Centre’) . Please be reminded that you are solely responsible for the trading decisions on your account. There is a very high degree of risk involved in trading. Any information and/or content is intended entirely for research, educational and informational purposes only and does not constitute investment or consultation advice or investment strategy. The information is not tailored to the investment needs of any specific person and therefore does not involve a consideration of any of the investment objectives, financial situation or needs of any viewer that may receive it. Kindly also note that past performance is not a reliable indicator of future results. Actual results may differ materially from those anticipated in forward-looking or past performance statements. We assume no liability as to the accuracy or completeness of any of the information and/or content provided herein and the Company cannot be held responsible for any omission, mistake nor for any loss or damage including without limitation to any loss of profit which may arise from reliance on any information supplied by Signal Centre.

BTCUSD Aug 2022 W.1: Medium-term trend!Hi friends, I hope y'all had a fantastic weekend ;)
Today, we're looking at a possible bullish trend that's derived from the monthly time frame. On that time frame, the price closed with a bullish reversal candle pattern in the double tops accumulation phase after previously bearish breaking and not retesting the patterns neckline together with the ascending trend line, 50 m.a and bearish crossed short-term m.a's. Usually, when the price has broke and not retested key levels and closes with a reversal candle pattern that faces the targets, it counter-trends to them before it continues the overall trend. With that said, let us take a look at how the bulls and bears might behave in triggering our trades and entirely dis-confirming them.
Bulls: -If the price bearish bounced off the Mini Daily Half a Bat Neckline, 50 m.a and bullish crossed short-term m.a's with a bullish reversal candle pattern close (1st trade signal) that guides the price to bullish break and retest the 1st Daily Key Lvl (2nd trade signal), that will confirm our trades and the price will be rallying for the huge triple bottoms 3-level trend that will probably end on the last take profit point. I call these trades a "Triple Bottom A-E.3 signal".
Bears: -If the price forms a bearish reversal pattern that leads it to bearish break and retest the Mini Weekly Neckline together with the 50 and bearish crossed short-term m.a's, that will dis-confirm our trades, so we'll sit back and wait for another trade signal.
That's it for today. I hope you found value in this trade idea. If you have a different concept in mind, feel free to share it in the comments section or in private, I'd love to know your thoughts!
Stay Blessed,
Doji.2k1.

BITCOIN BEARS TAKE OVER so I really think bitcoin has topped out and I got a good RR for swingers, after finishing of wave 5 at 24700 (a pity it didn't hit 25k )
seems the ABC correction is in effect.

BITCOIN PULL BACK good RR here on BTC. after hitting resistance on main ascending wedge trendline as well as horinzatal resistance.
Expecting a dump back down to 21800 support as it coincides with 0.5 fib as well.

Fractal BTC recovery - AMZN 2009 recoveryIn 2008/2009 AMZN stock saw one of its biggest crashes. It wiped out 64% of value in about 10 months. BTC saw a similar crash in 2022/2023 wiping out about 75% of its value.
Let's speculate that BTC would see a similar recovery as AMZN. This would mean BTC recovers 276% to about 65k per Bitcoin.
Because AMZN did it after 2008 it's certainly a possibility. Cryptocurrencies are also traded 24/7 so in a year it would have been available to trade much longer as AMZN stock.
Just a speculative idea on what is possible.

BTC🚀🚩 $35-38k then back down to 12.6-10.8k next up?In this video update I explain my current BTC view and what I am expecting in coming weeks..
Talking about the levels I will be watching and how I will be using these levels to trade the PA..

BTCUSD top-down analysisHello traders, this is the full breakdown of this pair. We will take this trade if all the conditions are satisfied as discussed in the analysis. Smash the like button if you find value in this analysis and drop a comment if you have any questions or let me know which pair to cover in my next analysis.

BTC is in clear downtrendExpecting the high in range of 25800 to 28500
Looking for a low in 14-15k zone, if we stretch down to 10k that would be a gift imo

BTCUSD (HIGH PROBABILITY SELL SETUP SOON)Hello traders, hope you all are having a good weekend,
Here's a quick brief news update regarding Bitcoin, cryptocurrencies undisputed KING. Bitcoin tumbles to new 18-month low as crypto sell-off accelerates. The world's largest cryptocurrency fell as much as 7.8% to $20.289, its lowest since December 2020. It has lost around 28% since Friday & more than half of its value this year. Since its record high of $69,000 in November, it has slumped about 70%.
Here we can see the clear Divergence on the RSI Indicator from the actual price action on the chart, baring in mind we're using H1 time frame for a clearer view of our analysis, hence we can't predict the duration of the market moves,
Keep a close eye on BITCOIN world's no1 cryptocurrency,
Happy PIP hunting traders.

BTCUSDTBe careful, Today I updated the chart and saw the chart on multi time-frame and I realized that the chart will not return from the price area of 18,000 and will fall to the price of 13K-14K.
