BTCUSD: Elliott Waves Intraday TradingAnd yet, the price touched the critical level of cancellation of bullish expectations, and I did not open a long position due to the absence of a breakdown of key resistance levels.
At the moment, I have made adjustments based on the continuation of the possible dynamics.
Intuition suggests that sharp fluctuations towards the $23,000 level and a test of an important Fibonacci level are still possible (this scenario reflects the structure of wave 4, within is likely to forms a WXYXZ model).
In addition, I do not rule out a continuation of the decline within the impulse of wave 5, the structure of which I will refine as the decline(I plan to open a short position on the expected waves 4 with the goal of at $16,500).
Best Regards,
CEO Tornado Capital
Btcusdforecast

BTCUSDT: Weekend Prediction ⬇️I would like to see selling pressure this weekend back into the key round psychological number of 20K
Before we see any sells, we will most likely lure buyers in at the breakout of this trendline and stop out existing sellers using the minor trendline for sells.
When we see a breakout, then we can consider selling using the supply marked.


BTCUSD Idea H1Here is my view for BTCUSD on H1. The price could go down, you can put a pending order on the Order block or find an entry on LTF within OB Zone. Trade Safe!

BTCUSDT 12h That in common in Bitcoin, Altcoins, Dominance USDTToday, let's consider the behavior of BTCUSDT price for 12 hours of timeframe, as the BTC price is working on the fractal we presented last week.
According to the fractal, by the end of this week, a smooth Bitcoin price growth is possible to $21500. In general, this is a minimum and conservative target for growth.
And further, it can start again - 2-3 weekly price corrections.
But in this situation, in our opinion, it is more interesting different.
While the BTCUSDT price will be growing smoothly, altcoins can start to grow actively
This assumption partially confirms the Dominance USDT chart - USDT.D
A possible fall in the Dominance USDT.D, according to the fractal, will mean that the capital from the Tether will be flowing into BTC and altcoins, accordingly, their prices will grow.
But the next trading week can be an interesting fracture:
- If the USDT.D starts to grow, and the price of BTCUSDT fall, it is clear that the capital will start flowing again from the BTC into the Tether
- But it can be more interesting with altcoins. If from next week, they will be poorly adjusted or the price is relatively standing in place, it will mean that from Alts capital does not flow to Tether. Accordingly, while the BTCUSDT price will be in a smooth correction, Altcoins can start a good up movement.
But about this is already next week. But not to miss the updates of our thoughts: put a like under the idea, write a comment and sign up for us.
_______________________________
Since 2016 , we have been analyzing and trading the cryptocurrency market.
We transform our knowledge, trading moods and experience into ideas. Each "like under the idea" boosts the level of our happiness by 0.05%. If we help you to be calmer and richer — help us to be happier :)

BTCUSD 4h Bitcoin price movement route for the next trading weekA few days ago we published an idea for the BTCUSDT trading pair, with a fractal, which is working quite well today.
However, today we were noticed that the buyers started to slow down the BTC price, a struggle between sellers and buyers on increased trading volumes begins. So we decided to make an update.
The current trading zone is now $20500-21500.
If the BTCUSD price fixes above $21500 in the next few days, the upward movement will continue to $23100 and possibly to $24300.
If the Bitcoin price keeps falling down, and it consolidates below $20500 , the fractal will continue to work out. A smooth correction BTCUSDT over the next 2 weeks, all the way to the maximum critical zone of $18250.
_______________________________
Since 2016 , we have been analyzing and trading the cryptocurrency market.
We transform our knowledge, trading moods and experience into ideas. Each "like under the idea" boosts the level of our happiness by 0.05%. If we help you to be calmer and richer — help us to be happier :)

BTCUSD: Elliott Waves Intraday TradingThe price of bitcoin continues to be in the expected correction of the upward movement.
It is likely that a WXY wave pattern could have formed, after which a fast growth can be within the wave 5 of wave C, or within the wave 1 of wave 5 (also, an ascending wedge has already formed on the M5 timeframe, on the breakdown of the maximum of which I will enter the long).
Or I will buy at the limit level of $21,000 with a stop loss of $20,700 (if the correction continues), and I will consider short sales in case the end of the local 5th wave above $22,500.
Best Regards,
CEO Tornado Capital

BTCUSD: Elliott Waves Intraday TradingHello everyone, friends!
At the moment, I continue to monitor the dynamics of the behavior of the price of bitcoin.
It is worth noting that the price is in no hurry to decline, and it is for this reason that I returned the scenario with continued strong growth to the main plan.
On the chart, I marked the key level of $20,650, the achievement of which can activate an avalanche of sales.
In general, today I will follow the price reaction at the local Fibonacci support levels for the considered wave levels.
I will buy in order to take profit at $22,800 (if the decline does not pick up speed, and the growth dynamics continues to form upward impulses).
The short sales I will be considered on the breakdown of the lows of the initial descent impulses and increase the short volume of the position in case of understandable upside corrective formations.
Best Regards, CEO Tornado Capital


BTCUSD: Elliott Waves Intraday TradingAnd yet, the price rose within the framework of past assumptions (), regarding reaching the level of $21,890.
I did not open a short position, because there was a significantly higher upside risk under yet another trading plan.
For now, I'm waiting for the situation to clear up and I'm in the mood to sell; however, I do not exclude that the price dynamics may make adjustments and the growth will continue within the framework of another model (I do not publish it yet, but I track it).
In general, I constantly have at least 2-3 trading plans that have different characteristics and entry levels. This allows you to be flexible in any conditions.
Now, I'll be waiting for the familiar patterns for the decline. In addition, I will closely monitor the formation of bullish patterns and, if they appear, I will move within the framework of bullish scenarios.
Best Regards,
CEO Tornado Capital

BTCUSD: Elliott Waves Intraday TradingThe price rose within my bullish expectations.
I closed the long position completely within yesterday's trading plan in profit.
Now I will wait for the situation to clear up and receive signals to open a short position within the expected decline.
In general, the bullish pattern in the form of an ascending zigzag can already be considered implemented.
Naturally, without confirmation of the beginning of the decline, it is too risky to open short positions.
I will be waiting for a breakout of the uptrend line boundary and will continue to subset the waves internally to be able to neatly enter a position in wave 2 or B.
Best Regards,
CEO Tornado Capital

BTC retrace to 22.800BTC looks like there is a retrace that can reach the price of 22,800 if you look at the existing pattern.
On the D1 chart the candle forms a bullish momentum, but all the ichimoku parameters still indicate that the selling pressure is still strong. This retrace is not the start of a bullish trend in my opinion, this is only a retrace with a simple a-b-c pattern, most likely.
The kumo cloud still indicates selling pressure, with quite thick volume. Don't be fooled into making a purchase. Well you wait. I'm more focused on determining when it's time for me to enter to short

BTCUSD: Elliott Waves Intraday TradingBTC price growth dynamic forced me to close sales in a small profit.
As usual, with the development of the situation, I continue to refine my trading plans.
I had to return the ABC model from the past markups.
At the moment, the correction can take absolutely any form, and judging by how the price breaks through the resistance levels sharply, I take into account even the most unimaginable plan with a breakdown of the level of $21,890.
Trading in such conditions is difficult, but possible if you wait for familiar patterns and models; that's what I'm going to do, as always...
Locally, you can consider buying on m15 chart with a short stop loss. I will consider buying a bitcoin on the breakdown of key resistance level (now is $20,300), and on limit level - of about $20,000.
Best Regards,
CEO Tornado Capital

Hidden Bearish Divergence at 4hr TF.Longs are trapped, time to hammer it down. As you can see hidden convergence aka hidden bearish divergence in the chart. Don't fall for this trap.

BTC (Bulls Vs Bears)BTC / USDT
Since mid June price is just moving in slow and boring sideway and forming a contracted triangle pattern
Which is a result from bulls and bears fight
But soon we will see big move :
A Breakout to upside:
Might pump the price toward 22k - 24k
A breakdown from the pattern :
Will dump the price towards 18k - 16k
4H chart :
Which side will win this fight ? Bears or bulls
Comment below and don’t forget to like for more analysis

BTCUSDPossible long on btcusd after bos and waiting for ob retest n go long. Theres also a strong Daily support around area. Sl below ob and target 45m ob

BTCUSD: Elliott Waves Intraday TradingHi everyone!
The price got to the downtrend line where I placed short sales.
Now I continue to consider several scenarios for the development of the situation, which tell me to continue to hold a short sale and look for additional points to increase of the position volume.
According to the basic scenario (chart on the left), I consider an increase in short sale volume both on the breakdown of the triangle's border, and in the wave B of wave D & wave E (if the pattern is formed).
According to the alternative scenario (chart on the right), I consider an increase in short sale volume on the correction in wave 2, as well as on the break of the low of wave 1.
The stop loss level for short sales is located at the level of 20450 by Bitstamp quotes.
Good luck in trading, friends!
Best Regards,
CEO Tornado Capital

BTC - Where we are right nowUsing Fib circles for each bear run
This shows the beginning of each new bull run in green circle
Right now we are just at the beginning of a new bull cycle (new green circle)
Vertical lines show the time periods between bull markets
Horizontal lines show the beginning price for each bull run

BTC - Further DiggingIt can be seen on this chart that the horizontal lines of support align with previous secondary bull market tops (in red)
The hammer situation are comparable points
What is really interesting though is that the Gaussian Channel structure on this 3D chart is very very similar to that of the pre 2016 bear market
This may result in a low for BTC at around 13 - 14K
This could be considered an addition to my previous post for BTC

BTCUSD: Elliott Waves Intraday TradingHello friends.
The price of bitcoin continues to move within my trading expectations.
I continue to dynamically edit the markup of wave levels, which allows me to plan key levels for making trades.
At the moment, the price of bitcoin is growing as part of local corrective scenarios.
I plan to open short sales as part of the next round of price reduction.
You should pay attention both to the sell limit levels for the scenario with the formation of a bullish wedge, as well as to the probable formation of a more complex local correction in the form of a triangle.
Both cases allow you to plan trades with good entry points for short sales.
Plan, take risks moderately and earn confidently.
Good luck!
Best Regards,
CEO Tornado Capital

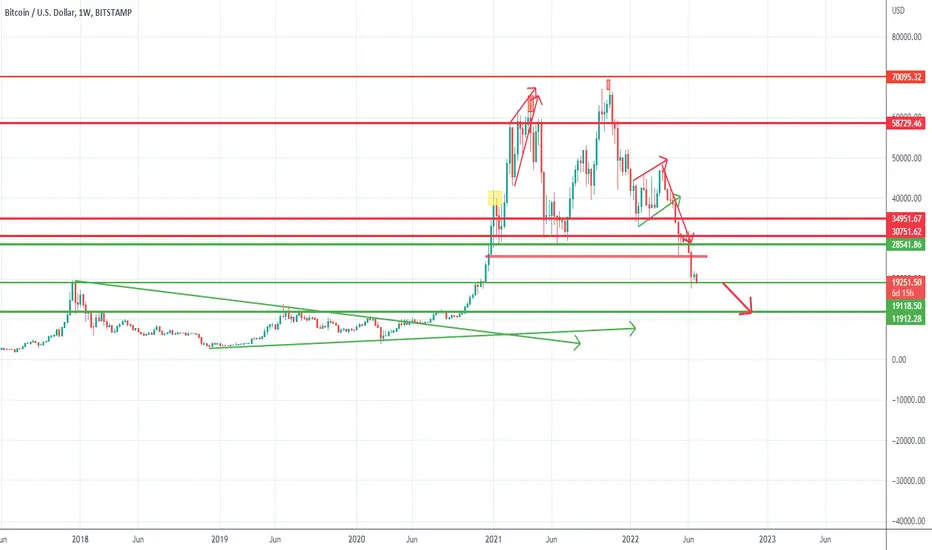
Bitcoin to continue its way down. Where can it drop?Since the initial drop from ATH in late November 2021 to the 42k zone, bulls always searched for support and a reversal for a new ATH, and always Btc has dropped even more.
At this moment, again, we have the same pattern, but even though there is a possibility of reversal, at least technically, this is very unlikely.
Looking at the past 2 trading weeks we can see that bulls don't have any power and there is no buying interest and the bounce from 2017 ATH was just a technical one and it didn't even have the power to touch the last 25k support, now resistance.
The overall structure is strongly bearish and, in my opinion, instead of trying to buy a low, is safer to sell rallies.
That being said, this is my strategy for BtcUsd and I will remain bearish as long as the price is under 25k.
As for the target, although it will not happen in the next few days, 12500 is a reasonable target
BTC moment of truthWhen you are fearful, zoom out...secular channel intact. Short-term bear channel, bounce overdue. This is the longest data trail on BTC you can find on chart platforms. Many says the 200 WMA has never been violated, wrong...2015 it was trading below for couple of weeks. Nevertheless stop looking for fractal and base your analysis on the present and technicals.
- Channel still intact
- RSI at the bottom
- Stoch RSI oversold
- Trend is slowing down
Now we wait for the signal. High volatility is normal at the bottom as people is still panicking, but only few are left to panic.
Another flash dip to 17k wouldn't surprise me, just stick to support, resistance, channel and trendlines and you will do well and stop trying to predict the market. (probabilities, always)
FOLLOW ME, SHARE, LIKE AND COMMENT

BTCUSD: Elliott Waves Intraday TradingThe price continues to change the structure and wave levels.
After a burst of volatility, the price has moved into a range and is under moderate pressure from sellers.
Yesterday we managed to open long positions at the end of the WXYXZ pattern, but we had to close the position very quickly with a small profit, because the growth dynamics was not confirmed.
At the moment, I have made adjustments to my trading plans, according to the current price dynamics.
In the basic scenario, I consider the formation of a complex correction in the form of a plane. Such formations should be traded very carefully, because any price levels (which serve as levels for placing stop orders) are very easily tested by punctures for strength.
Alternatively, I expect the downward movement to take the form of a bullish wedge, which could be the starting model for a medium-term trend reversal.
Best regards,
SEO Tornado Capital
