Btcusdt Sometimes I difficult to analyze the btc
But am sure that we are not clear no one knows the future
We can only gamble with 1hr time frame knowing that there's danger in weekly time frame this market is very scary 😨
Best thing is to wait no one knows the bottom if u buy dip it dip more
#Bitcoin’s price sits at the lower bound of its production cost for the first time since the March 2020 #liquidity crisis as well.
Moreover, We can see that whenever price hits the lower bound or upper bound of the #Bitcoin Production Cost Ribbon, we see a mid-term reveral in the market. Simply, this inidcates a relief rally coming soon ✌️🏻.
Btcusdforecast

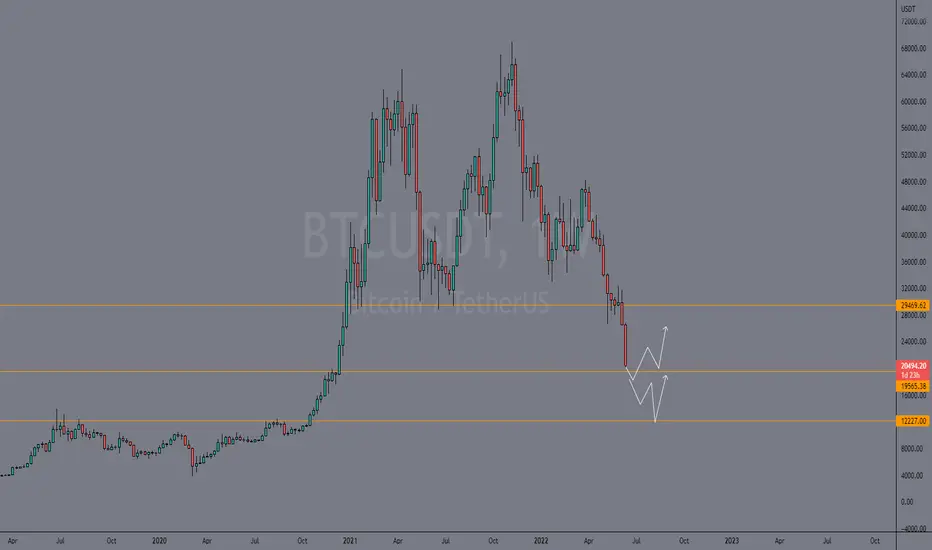
BtcusdtBtc hit 18712 from my long and If you are in that trade I expect you to take profit @18700 because generally BTC is bear or bull I can't say but here is what I know
$20,000 is broken 😞
Stay away from market for a while. If u are newbie
A descending triangle on the hourly chart broke in a downward direction. The target of this triangle breakdown is the $16,700-$17,000 area. There is no strength in the market yet and big liquidations are going on. BTC needs to go above $20,000 to bring some positive momentum. Wait for Monday for the global market opening.

Start of Accumulation Phase We can see some kind of Accumulation in this area......
DYOR
NOT A FINANCIAL ADVISE

Monitoring for possible $BTC reversalMonitoring for possible $BTC reversal out of weekly oversold conditions at a major support level and trendline...Monitoring 4h/1D for positive divergence.

Bitcoin (BTCUSD) is ready to touch 12000Since the first quarter of this year 2022, BTCUSD is in downtrend and the price of BTC is reduced by 2/3 already.
The Strongest support near the current price is 20000 and 15000 and the strongest resistance is 28000. as per the daily timeframe, it is making a bearish trend and if it continues, soon we will see 15000 and 12000.
The best thing to do is to wait. right now its in Black Level zone which means you can not buy and you can not sell it till we get confirmation of trade. We need to trade when it comes in our zone and ready to drop or fly. bellow 22800, the price of BTC is bearish.
we can make a sell of BTC from 22000-22800. or we can buy it from 12000-13000

BTC 4ema bearish crossover target $20KWe have discovered something which suggest that $20K seems inevitable. This chart is based on 4EMA's on weekly.
First time bearish cross over happened was 3rd Sept 2018 and price dumped to over 56%
Second time this occurred in March 2020 (Covid Crash) and price dumped up to 55%
This is the 3rd time we are seeing this bearish cross over on weekly and lets say if we dump 50% from here then we are looking at sub $20k levels.
We also see the price breaking down from ascending channel which is another bad sign and to top it off we are close to a death cross on 3D chart so all of these confluences align with depressing bearish trend which can last up to 3 to 6 months or maybe a year but not more than this.
Kindly share, like and comment on our analysis.

Bitcoin Sell Off Realistic Price Deep DiveFinancial markets plummeting and macroeconomics hit with a torrent of shocking news what does this mean for Bitcoin and cryptocurrencies?
Before jumping into Bitcoins (BTC) price analysis it is important to understand the top reasons why markets are falling at an accelerated rate.
Inflation throughout the world is at record highs with inflation in United States of America at its highest in 40 years 8.6%
Interest rates are rising sharply with Fed increasing interest rates by 75 basis points this week the largest since 1994.
Dollar strength index DXY is steadily increasing indicating investors are moving money out of risk assets to less risky ones e.g. bonds & cash
Specifically, to cryptocurrency markets the crash of Terra’s $LUNA and $UST combined $50 billion spooked investors and raised concerns.
Rumours of Celsius and Three Arrows Capital insolvency due to large exposure with Terra assets which leads questions to which other cryptos will fall in the domino effect creating further sell off panic.
Many countries announcing and investigating new cryptocurrency regulations and laws. (Subscribe here to be notified of articles on latest regulations)
Fear and greed index is at all time-lows of 7 this week and below extreme fear levels for the last month.
Cryptocurrency total market capitalization has dropped from all time high of $3 trillion to below $1 trillion a $2 trillion decline in a few months.
Specifically, Bitcoin has experienced 9 weeks of price decline the first time in history and continues with effectively 11 weeks of price decline.
Bitcoin price has retraced below its previous all-time high for the first time.
With the global financial market scene set above we can expect the following BTC price action in the near future. Looking at the area in box number one on my technical analysis chart above.
Bitcoin weekly candle close broke 0.382 Fibonacci support level $28500 to the downside.
200 Day weekly moving average a significant indicator (green line) which has proven to be historical support for previous bear markets and signalling bottoms has breached $22000 level this week for the first time.
In confluence price has fallen out of current trending channel illustrated as two yellow upward parallel lines.
What does this mean for Bitcoins price and key levels?
Next level of support which needs to hold is 0.236 Fibonacci around $19000 to prevent further downside.
Sell off at $19000 level will take Bitcoin to the next significant level of interest by investors the $10000 red line in box number two.
Failing the above levels of support $3000 is a very real possibility as final bottom since we have seen most significant key levels decimated over the past few weeks due to macroeconomic conditions.
Let me know your thoughts in the comments below and if you would like to know what this means for altcoins in your portfolio. Till then stay safe and always remember to apply appropriate risk management to your investments.
Legendary Investment Trader, Cryptocurrency & Web3 Master
Boundless Lord

Bitcoin Sell Off Continues Over the WeekendNext level of support which needs to hold is 0.236 Fibonacci around $19000 to prevent further downside.
Read idea linked at bottom for in-depth price review.
Legendary Investment Trader, Cryptocurrency & Web3 Master
Boundless Lord

bitcoin channel break out im currently waiting for bitcoin to break out this channel i believe tho we mite get a little rally to the upside to grab liquidity to head lower. that's if we don't just bleed to the downside check my last post to see the next key level.

BTCUSDT Bounce or crash ??im bearish still on bitcoin but i think we can have a dead cat bounce before heading lower to the next demand level one it brakes 19k


Bitcoin ChannelI drew a channel including bitcoin price history starting from 2013 till today.
The upper boundary is touching 2013 and 2017 market tops, meanwhile the lower boundary clearly defines the uptrend bitcoin is maintaining since then.
Nothing new.
What I added is the orange mid-line , which is not at the EQ level, just a bit higher. Its position is arbitrary and it's been placed there because it represents an important level for bitcoin.
Historically, once bitcoin crosses that level it starts accelerating and subsequently reaches a top or it confirms the bearish trend the price action has entered in.
Each time the mid-line has been crossed upwardly it resulted in approximately a +310% move for bitcoin in the following weeks.
Bitcoin finds itself at that crossroad right now, and I think this is one more reason why it's finding so much resistance at the $60k tag. Once taken with conviction I think we'll see fireworks.
A +310% from here, given the channel slope, gives us a bitcoin price of ~$220k by June 2021.

BTC Relief RallyBTC is making a lower low on daily so we have a chance of a relief rally by making a lower high so based on that we have 2 scenarios. We are halfway to the bear market and second half is on the line.
Scenario 1
BTC will range between $20300 to $23000 for sometime and then break out towards $25k to $28k possibly making a bear flag and goes down towards $19k-$15k.
Scenario 2
BTC will simply break down from here towards $15k-$19k and we will bounce back up for a relief rally towards $30k levels or higher and then we go down again.

Btcusd bearish view following trendlineHi everyone in the TradingView community. I am Rana Sarmad I like to share and talk about trading strategies. If you are a member of my subscribers list and like my ideas, please don't hesitate to let me know by hitting that Like button and growing my notification count!
We are going to discuss about BITSTAMP:BTCUSD
We can see a clear breakout through its previous support and currently standing near is 2017 record high. Its a strong support in D1.
And FED hike the rate by 75 bps.
So we are expecting more fall near 17000, than 12000 and than last target could be 3800$.
This is my opinion, I really hope this will be useful for you.
This is not a financial advice. Always take trade at your own risk,
Be ready and take care your money. Have a great profit !
Risk Warning:
Trading Forex and Leveraged Financial Instruments involves significant risk and can result in the loss of your invested capital. You should not invest more than you can afford to lose and should ensure that you fully understand the risks involved. Trading leveraged products may not be suitable for all investors. Trading non-leveraged products such as stocks also involves risk as the value of a stock can fall as well as rise, which could mean getting back less than you originally put in. Past performance is no guarantee of future results. Before trading, please take into consideration your level of experience, investment objectives and seek independent financial advice if necessary. It is the responsibility of the Client to ascertain whether he/she is permitted to use the services of the EMOTT brand based on the legal requirements in his/her country of residence........

BTC is this the end???Evening everyone!
Hope everyone is holding up well amoungst what has been going on the charts.
Let's get straight into it!
Let us know your thoughts below!

$BTC now what?It just missed our start of the box but no worries. i am a bear and i think it's the perfect time for a bear market rally provided spx holds it levels. Although before rallying i first would like to see btc hold 20k when spx take out the lows of 2021. the first target for rally would be 28k then 33k if that holds we can talk about 35k and 40k. This would be a perfect bear market rally as people will think the bulls are back but in real this will be crushing so many retailers. I think after hitting these there's a possibility of going down bad depending on the economical situation. my targets would be 15k-11k-9k. a big accumulation for 3-6 months is what i want to see to start a new cycle.
FED's rate hike will play a major role taking the liquidity out of the market making sure people believe everything is dead.

#BTC / $BTC WeeklyBitcoin on Weekly Chart has never closed RSI below 30
Expecting a bounce in the coming weeks on the Support Zone

#BTC / $BTC #BTC Quick Update
Bitcoin in 1H TF is forming a Falling Wedge with Hidden RSI Divergence
Expecting a bounce after retesting lower than $20,000

shitpost but not really, QOTD for bitcoin#1 :Dhi yes and does bear and bull exist or we have been lied all this time?
maybe yall are just dumb xdddddddddddddddddddddddddddd

BTC at the target zone, possible extension to 19700BTC is in a buy zone, together with the SPX, NDX etc
Looking for a trip back to 30-32k at min by sometime in Jul/Aug top

Bitcoin- Approaching 2017 ATH. Rebound is probableIn my previous BtcUsd analysis I said that, after the false up break from the consolidation, I expect a drop to the 25k zone. And indeed, the main cryptocurrency has dropped, going even further than my expectations.
Looking at the weekly posted chart, we can see that the trend is extremely bearish and, if you are not a " to the moon" dreamer, you can't expect a V shape reversal from this trend.
However, at this moment, BTC is approaching 2017 ATH, and I expect this level to provide support and a relief rally is probable from this point on.
I will look for a short-term speculative buy around 20k with a target around 25k, now resistance.

Bitcoin Panic is in the Air...The Mayer Multiple has helped to mark points of extreme panic in the Bitcoin market for quite sometime now. Whenever it has gotten into a range of 0.50 to 0.60, it has proven to be a good time to establish long term positions. If someone has been waiting patiently to enter or add to their Bitcoin position, right around this zone could be a good entry level. Now, one thing to point out is that Bitcoin has never seen a major dislocating event in the markets vis a' vis a 2008 style collapse in asset values. So it is conceivable that prices could certainly go much lower then anyone has ever dreamed. With that being said, again sitting in cash long term may prove to be folly so if even a small portion is deployed into Bitcoin during periods of extreme panic and bearish despair as we are see today, it could prove to be a worthwhile investment longer term.
