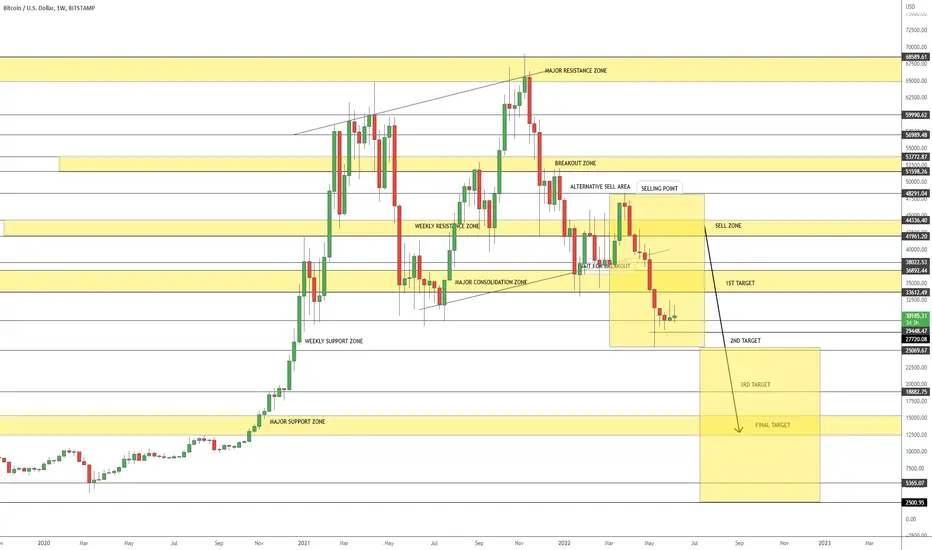
BITCOIN HEADING FOR $2,500I do not have much to say, i let my work speak for me, so i will be dropping this here for the future and whats to come.. trade safe and bag substantially. We are the next Millionaires.
Btcusdforecast
BTCUSD LONG ACCUMULATION ALMOST DONEWe should be testing 200D MA in the coming days. Typical short term rise in Bear Market.

BTCUSDT - Long Term Prediction Based on Daily Chart (Log Chart)Hey guys,
I have looked at the daily chart considering a longer term prediction.
That cheat sheet is designed by Richard Wyckoff, I guess a trader would know who he is.
So the way I see it, the daily chart fits his predictive cheat sheet. Weekly or even monthly fits better.
What I believe is that we're gonna see some more drops with BTC before the next mark up phase begins.
And that would be the area of 16K-20K in my opinion. This would also close the gaps on CME that BTC left behind during mark up phase.
Always DYOR! This is not a financial advise!
Cheers.

BTCUSDT Long-term trade for summer 2022Today, we bring to your attention our vision of a long-term trade on the pair BTCUSDT
Now the price of BTC is in a very critical zone.
On the one hand, some market participants may argue that the price of BTCUSD has broken down the black support line and is fixed under it, and accordingly, the continuation of the decline is inevitable.
On the other hand, it seems to us that the fall in early May completed the ABC correction and is now consolidating before moving up, perhaps even within and with the goals of white parabolic growth.
Also, the Crypto Fear & Greed Index is now in the same consolidation at the absolute bottom as in December 2018 and March 2020.
For ourselves, we consider acceptable and balanced long-term trade with the following parameters:
Entrance to the position in the area of $29300
Take profit $52200
Stop under $25700
Profit/loss ratio 6/1
The next update of this idea will be:
- if the Bitcoin price will fix above $35500-36000. If this condition is met, you can take more long position, or re-enter long with less risk.
- if the stop order on this trade works, it means that the downtrend will most likely continue, and we will have to look for points to enter the shorts after the rebound.
_______________________________
Since 2016, we have been analyzing and trading the cryptocurrency market.
We transform our knowledge, trading moods and experience into ideas. Each "like under the idea" boosts the level of our happiness by 0.05%. If we help you to be calmer and richer — help us to be happier :)

#BTCUSDT Short term update.Welcome to this quick update, everyone.
Although BTC is holding the $29k level quite strongly it needs to get above the trading range to rally towards upper targets, $32k, and $35k. (I know you know this already!)
Lower support is around $28k and resistance is around $30.8k.
We have already seen a fakeout (the red circles)!
I've shown the expected move in the chart, let's see how it goes.
For scalpers:- The long level is around $29,280 with SL below $28670 with a target of $32k.
*Not financial advice.
DYOR.
Do hit the like button if you like it and share your views in the comment section.
Thank you
#PEACE

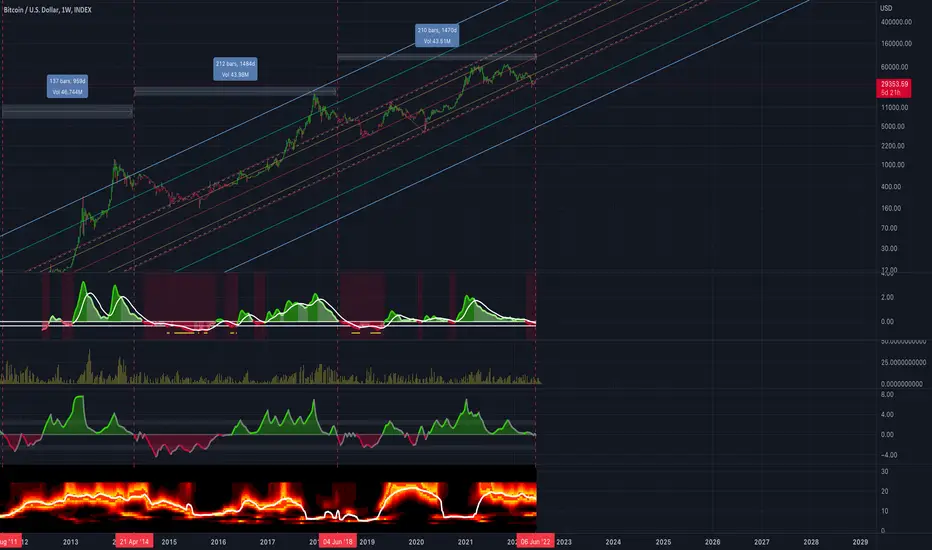
Big Picture BTC: Cycles, Volatility, SD, and Mean ReversionOn chart:
Cycle Adaptive Volatility Meter: Autocorrelation Dominant Cycle Adaptive Volatility by TRD (True Range Double) to correct for volatility skew
GARCH: Projected Standard deviation %, 6 week forward projection
Fisher Cycle Adaptive, Fisher Transform: Mean Reversion
Autocorrelation Periodogram: Measure of cycle dominance with price-to-cycle fitness, current cycle length = 16 weeks
Volatility is dumping, mean of price already 2 weeks inside danger zone, last week was small relief, standard deviation % forward projection pointed downward
Conclusion: Perilous times ahead, only positive here is that price is sitting on bottom of Pitch Fork in Log at 99.7% stop which could mean we whipsaw back to the mean; however, lots of confluence pointing to further down from here--matching past full bear-to-bull. Bear-to-bull cycles used to attempt to capture when BTC bottom is in to ride next cycle bottom to next cycle top. Assuming our GARCH projection holds, and we continue downward, we might get some action here with a standard deviation squeeze
Still heading for sub 20k??? BTCBear market rally has started imo. Potentially hitting back to 35k - even 37k, but overall trend/sentiment is still bearish for sub 20k range towards Nov. Crypto is slightly lagging behind to SPX but will balance soon or later with the upcoming ripples of QT.

BTCUSD Long OutlookHello there all,
Here's the BTCUSD forecast.
Please do let me know if you are seeing what I'm seeing or have a different perspective on it, I would love to see your analysis.
Please do drop the chart link below on comment section, I would love to see it
This is not financial advice. 🙂
Thanks all
GGWP

BTC cooking one more legEW analysis. Targets either 0.382 or 0.618. Action signal only on the breakout. Half mast formation usually run 60% of pole distance which is in line with the 0.618 target. Nevertheless once again, the breakout will rule the direction. SL below point 4, the entry on the breakout or pull back after the breakout. Trailing stops will follow the trend.
NEVER ACT WITHOUT A SIGNAL (BREAKOUT). The signal should also follow filter breakout based on ATR or STD to account for volatility (advanced concept).
P.S inverse chart

My Btc Strategy / BtcUsdt AnalysisThe graphic is clear , you just have to see it . I do not give investment advice to anyone. This is my strategy.
.
.
.
.
.
Investment information, comments and recommendations contained herein are not within the scope of investment consultancy. Investment consultancy service is offered individually, taking into account the risk and return preferences of individuals. The content, comments and recommendations contained herein are in no way guiding, but are of a general nature. These recommendations may not be suitable for your financial situation and risk and return preferences. Therefore, making an investment decision based solely on the information contained herein may not yield results that meet your expectations.
.
.
.
You can support me by liking the analysis.

BITCOIN: MY PLANHere is my plan for this pair.
my opinion DXY will create short correction and bullish for bitcoin.
when correction done and bitcoin fall.
If you agree with this idea, leave comment and thumbs up.
Thank you

Bitcoin Stage Analysis 2020 Bull MarketStan Weinstien Stage Analysis on BTC 2020 Bull Run
If you don't know just Google his stage Analysis
Price following the exact same path
If it follows correctly, market should make a bottom around 20k
Moving Average starts to decline

$BTC / #BTC Daily Update Price get support on FIB 0.618
Expecting another Move UP
Send it to $33600 🧨

BTC Support/ Resistance corridorThe big corridor of Support (29,5000) / resistance (35,000) update!
The current small multiyear resistance line in 32,000 holds some strength. However, all indicators show that the support was strong and a new attempt will follow soon.
Expecting another bounce to 32,000 resistance followed a slight tick down. After that once momentum has gathered we should see the break of 32,000 and BTC price towards 35,000 multiyear resistance.
35,000 is extremely strong resistance and high volatility is expected.
Positive outlook: When macro indicators like DXY, Stocks, and FED allow some strength for markets, we can expect a 35,000 break and towards the major downtrend line. There should not be any talk of trend reverse as this needs to be validated by bounces that follow.
Negative outlook: 35,000 and break can be a form of exit liquidity creation for institutions. All eyes are on institutional holdings, money in-out flow, and futures. If exit liquidity is the game then this will be a dead cat bounce that leads towards deeper lows.

Long on BTC/USDTWith the volatility that we have seen for the past few weeks, it is time to take advantage of a possible upsurge in the BTC. We are going to apply leverage to this trade to get the most of the possible uptick in the Bitcoin`s price. The set up that we have prepared for all of you is:
Long BTC/USDT x10
Entry: 29965
Targets: 30444(50%) - 31211(25%) - 32169(25%)
Stop Loss: 29284
After each target, move the stop to the previous one. After the first target, stop at the entry point.

#BTC/USDT $38k on board. JUNE ROADMAP!! Explained.BTC followed our last update and held the $28.5k level which also happens to be the .618 fib extension considering the covid low and recent ATH.
Broke above the $30.8k level too!
Volume profile matches with all those pumps that happened in early 2021 and July 2021.
However, there are a few points BTC needs to fulfill like BTC needs to break above the $32k level.
Here's what I expect:-
With several choppy ups and downs in BTC, it's highly likely that it will hit the $41k level.
Breaking above the Blue channel with lower low and lower highs.
We need a new higher low that could happen If BTC breaks above the blue channel.
Secondly, BTC needs to hold the golden ratio level which is $38.5k
The chart is quite clear here, there's a high probability of this scenario playing out in the next couple of weeks.
What's important is HOW BTC reacts to the $38k to $42k level I am quite confident BTC will hit that level.
Follow me if you don't yet, I will be updating this chart when needed.
Do hit the like button if you like my updates and share your views in the comments section.
Thank you
#PEACE

BTC Trend Reversal Coming Or Not? BTC vs USDT.D
USDT.D Bullish = BTC Bearish / USDT.D Bearish = BTC Bullish
I don't think I have to explain much, All eyes on USDT.D Weekly close looking for Bearish Engulfing

BTC bearish butterfly 1H target $30,824BTC is in process of developing a bearish 🦋 harmonic, It will complete at $30,824. Invalidation of this will be if price goes below $28K level. We have strong resistance levels at $30,500 and $31,500 so chances of this harmonic playing out upon completion are very high.

Which way the BTCUSDT price will choose to move in 2022 ?Today to your attention is the analysis and interpretation of what we are drawing and seeing on the BTCUSDT chart on the month time frame.
At the top of the chart are two parabolic arcs: a white arc and a black arc, because the amplitude of the price growth at %% each year is fading.
At the bottom is the white trend line, to which the price has fallen only three times at strong falls of cryptos: November 2011, March 2020 and May 2022.
Today 31.05.2022 the monthly candlestick of BTCUSD price closes and at what price it will close, we can guess what the mood of the market players is and where the price may move next.
So, the two scenarios:
1) Positive - ideally, the closure of the current month candle and the opening of a new one above $34500 . In this case the chart will show 6 false-breaks of the Fibo level $34500 during the last year (May 2021-May 2022) with a buy-up. This could be interpreted to mean that: the "big players" in crypto are happy to buy BTC at any price below $34,500 and have been buying and gaining a long position at that price for over a year because they believe in strong Bitcoin price growth in the future.
Another point is the Fear and Greed Index. It has been stamping the bottom around the value of 10-12 for 2 weeks. There was a similar pattern in late 2018 into early 2019, only for 3 weeks and then a 300+% rise in the BTCUSDT price.
If we guess such growth for the next 6-7 months, the BTCUSDT price could be close to the $100k mark by the end of 2022. At the same mark there will be an intersection, of the Fibo level and the black parabolic arc. Only the section at the level of $191 thousand is higher, which is hardly believable now.
2) Negative is if during the next trading month the price of the BTCUSDT fails to consolidate above $34500, but just retests that level. In that case, the price could break through the white trendline downward in the future and gradually, by the end of 2022, fall into the liquid zone of $12-14k. What will happen to the alts in that case - it's scary to imagine.
Well, put like under the idea, write your comments, what we can expect in the future in your opinion.
And we, in turn, will from time to time update our opinions about the pair BTCUSD on smaller timeframes, based on this global idea.
_______________________________
Since 2016 , we have been analyzing and trading the cryptocurrency market.
We transform our knowledge, trading moods and experience into ideas. Each "like under the idea " boosts the level of our happiness by 0.05%. If we help you to be calmer and richer — help us to be happier :)

Make just two deals a year.You don't need to look at quotes every day.
You don't need to worry.
You don't have to look for reasons.
You only need to make two trades a year.

BTC weekly update: which pathway ?BTC / USDT
On weekly view BTC is bouncing from 200W EMA and currently is retesting the previous strong S/R
This area mainly for watching
Scenario 1: Breakout
Make strong breakout and close weekly above 36k then we can see new bullish move again
Scenario 2 : bearish retest
If we see strong rejection here with loss of 28k again this time i think we will head much lower levels
Based on reaction here we will know the next move
What do you think the most possible scenario ? Share with us in comment section below

BTC TO 10000 - 11000 INCOMINGHi there,
If we analyse the peaks and retracement in the past, we see that everytime BTC spikes it eventually retrace 100% back down.
First major spike in 2017, then in 2018 it went back to its previous value
Second spike in 2019, then in 2020 it went back to its previous value. 100% ish retracement
Then in Oct 2020, it got very bullish then went all the way to 60000 of course it retraced 50% - 60% before going to 60000. So now it is bearish, we should expect it to go back to 100% retracement i.e. price before Oct 2020.
BTC down to 11000 $$$

♦️#BTC weekly close ♦️#BTC weekly close in just an matter of an hour here.
Close above $30000US will be bulllish in the immediate short term for next coming days volatility to the upside chasing resistances at ranges 34_37k dollars US.
13 hours ago
BTC on the other hand playing below the significant support level 30k regaining the support and flipping it can change the game here on the short term. As there is bullish divergence on RSI and MACD also BTC getting above 20MA will be a bullish signal targeting the 34-37k ranges which are resistance above. Do keep in mind we are still in a bear market and these bullish divergences can be negated if Bitcoin breaks further down.
