#BTC/USDT DAILY UPDATE !!!Hello, members and welcome to this BTC /USDT quick chart analysis.
As I mentioned in my previous chart nothing much to watch on this daily time frame, BTC is still trading near the support label which is $28.7k. and fib Retracement Zone $28.7k and Resistance Label $35k.$40.8k.$47.3k.
This is not a piece of financial advice.
Then, hit the like button and share your chart in the comment section if you like it.
thank you.
Btcusdforecast

BTC forecast - update Market is giving mix signal currently at a very good support zone above 125ma
if it falls we can see a draw down till ~22500 around 200W ma, but anything below 125 ma is massive buy opportunity.
I hope it should hold my 0.236 curve and close above 25500 and expecting to see a move above from June 6th. where first target will be 34500, t2-40000, t3- 45800, if it can hold above 48k for 1 week open-close both, I hope to see a new top by17 oct (& date of reversal).
PS - its just TA, do your own research before investing.

A Comprehensive Guide to Elliott Wave Degrees (Timeframes)Hello Traders. In this supplemental post to my Elliott Wave guide, I will help you understand wave degrees, and what the numbers actually mean when you are labeling each wave.
Identifying the wave level (degree) that you are trading is going to be identified at any given time and will be based on what's known as a "degree".
One of the biggest problems that new Elliott Wave traders have is grasping the structure or "nesting" of the wave patterns (check the diagram within the chart above).
The patterns identified by Elliott himself, occurs across multiple time frames. This means that a completed "five wave" wave structure on a smaller time frame, for example, the 15 minute chart, may represent just the first wave of a larger wave structure unfolding on a 60-minute chart, and so forth. In a micro-macro sense, each of the unfolding wave patterns is just part of a bigger wave pattern unfolding in the higher timeframes. The sequence from wave 1 through 5 completes one wave of a higher degree (again, refer to the diagram above), that is, a wave belonging to the next higher tier of wave sequences. The movements from wave 1 through 5 completes either a wave 1, 3 or 5 of the higher degree, while the a-b-c sequence completes either a wave 2 or 4 of the higher degree.
When you are getting into lower degrees, each wave of the sequence can be broken down into smaller waves accordingly to the same dynamic (this is not so important as many claim to be). The most commonly used degrees are the Primary, Intermediate, and Minor degrees when labeling your micro-macro wave counts. In the diagram above you can see how Wave 1 of the high degree is made up of a smaller 5-wave impulse waves and Wave 2 is made up of smaller three wave corrective waves. And each of these waves is, in turn, always comprised of smaller wave patterns, and so forth.

BTC Market CyclesBTC has been going according to plan as per the usual market cycles revolving around BTC halvenings.
If you notice the BTC market cycle bottoms are locked in 65 weeks before the next BTC halvening which we are heading towards at the moment.
Market Cycles peaks occur within 75 weeks AFTER the BTC halvening.
I am expecting that BTC has put in the bottom AND starting the grind up and into the next bull cycle by October, 2022 (10/22).
We are currently in an accumulation phase which typically occurs in the first few big dips AFTER market cycle peaks. I expect that most accumulation will happen between now and October at which point some early levels of FOMO will start to show as price starts to move up and not come back down as we start nearing the next BTC halvenings at which point REAL FOMO should begin.
Obviously this is not financial advice but purely educational so that you can familiarize yourself with BTC halvenings cycles and the effects it has on price.

BTC ... More to come???Good evening all!
We're here talking about BTC again, since we spoke last, there has been a lot happening!
Let us know your thoughts down below!

A Comprehensive Guide to Elliott Wave Rules & GuidelinesHello Traders. In this post I will be discussing every single Elliott Wave rule and guideline according to the Elliott Wave Theory. There are many confusions upon traders when applying Elliott Wave rules, as there are also guidelines to be considered when trading.
***RULES AND GUIDELINES ARE TWO DIFFERENT SET OF TOOLS!***
Elliott Wave Theory "Rules" MUST be obeyed, I repeat, they MUST be obeyed, and obeyed precisely for an Elliott Wave pattern to qualify as an Elliott "Wave" - However, the "Guidelines" do not have to be obeyed. The more Guidelines obeyed by an Elliott pattern, the higher its "rating" or "probability" of being correct. This guide is purely a supplement guide and a quick reference for ANYONE who is trying to remember the rules and guidelines. I hope this guide helps you to further advance into the Elliott Wave Theory. Please write in the comment section below if I have missed anything, I will be glad to add them in the update section.
------------------------------------------------------------------------------
We can categorize the Rules and Guidelines into TWO distinctive pattern groups:
1. Impulsive Wave Patterns (5 wave moves), and,
2. Corrective Patterns (3 wave moves)
-------
**IMPULSIVE WAVES**
Impulsive Wave Rules:
•Wave 2 may NEVER move beyond the origin of wave 1 (it cannot retrace more than 100% of wave 1).
•Wave 4 may NEVER enter the price territory of wave 1.
•Wave 3 may NEVER be the shortest wave.
•Impulse waves ALWAYS subdivide into 5 waves.
•Waves 1, 3, and 5 are ALWAYS 5 waves.
Impulsive Wave Guidelines:
•Wave 3 most often exceeds the pivot of wave 1
•On rare occasion, wave 5 will not move beyond the pivot of wave 3. This is known as TRUNCATION (refer to my EW guide).
•Usually, wave 3 will extend and have 5 waves within the third wave. Occasionally, two waves will extend (3rd and 5th waves). Never will all three extend.
•When wave 3 extends, wave 5 tends to EQUAL in length with wave 1.
•When wave 5 extends, it frequently reaches to the length of waves 1 plus 3.
•Wave 1 is the least likely to extend, but can be valid.
•Sometimes, the extended wave corresponds with the current parent wave. (for example, In a higher degree wave 5, it is common for the lower degree wave 5 to extend as well)
•Sometimes, the extended wave will match the number of the current parent wave
•The center of Wave 3, normally has the steepest slope of the entire 5 wave structure.
•Wave 2 will develop into a ZIGZAG correction, FLAT, or a COMBINATION wave (WXY, WXYXZ). Wave 2 cannot be a triangle in its entirety.
•Wave 4 will develop into a ZIGZAG, FLAT, COMBINATION (WXY, WXYXZ), or TRIANGLE.
Diagonal Rules:
a. Leading Diagonal
b. Ending Diagonal
A Diagonal is a common 5 Wave Impulsive pattern labeled as a 1-2-3-4-5 that moves with the larger trend (up or down). Diagonals move within two channel lines drawn from Waves 1 to 3, and from Waves 2 to 4. A Diagonal MUST be contracting. There exist two types of Diagonals; Leading and Ending. They have a different internal structure and are seen in different positions within the larger degree pattern. Ending Diagonals are usually more common than Leading Diagonals in terms of probabilities.
•Wave 1 of a Leading Diagonal must be an Impulse or a Leading Diagonal.
•Wave 1 of an Ending Diagonal must be a Zigzag family pattern.
•Wave 2 may be any corrective pattern except a Triangle.
•Wave 2 must be less than Wave 1 by price.
•Wave 3 of a Leading Diagonal must be an Impulse.
•Wave 3 of an Ending Diagonal must be a Zigzag family pattern.
•Wave 3 must be greater than Wave 2 by price.
•Wave 4 may be any corrective pattern.
•Waves 2 and 4 must either overlap or be within 10% of length Wave 3 of doing so. All internal data points are considered.
•The time taken by Wave 4 must be between 10% and 10 times the time taken by Wave 2.
•Wave 5 of an Ending Diagonal must be a Zigzag family pattern.
•Wave 5 of a Leading Diagonal must be an Impulse or Ending Diagonal.
•If Wave 1 is a Leading Diagonal then Wave 5 cannot be an Ending Diagonal.
•Wave 3 must not be shorter than both Waves 1 and 5.
•Wave 5 must be at least 80% of Wave 4 by price.
•Wave 5 is never the longest when compared with Wave 1 and Wave 3.
•Wave 5 is always less than Wave 3 by price.
•The intersection of the channel lines must be beyond the end of the pattern.
•Diagonals must move within the two channel lines or be within 10% of gross movement.
•Channel lines must converge, slope in the same direction and neither be horizontal.
•The maximum number of pattern lengths into the future that the channel lines intersect is 4.
•The minimum time for Wave 5 is 10% of Wave 4. The maximum time for Wave 5 is 5 times Wave 3.
Diagonal Guidelines:
•Wave 1 of a Leading Diagonal is usually an Impulse, but in rare cases may be a Leading Diagonal.
•Wave 2 is usually ZigZag family pattern.
•Generally Wave 2 is greater than 35% of Wave 1's total price movement.
•Wave 4 is commonly a Zigzag.
•It is rare that at least either Waves 2 or 4 of an Ending Diagonal is not a Zigzag family pattern.
•Generally Wave 4 is greater than 35% of Wave 3's gross price movement.
•The end points of Waves 1 and 4 generally overlap.
•Expect the time taken by Wave 4 to be between 20% and 5 times Wave 2.
•Wave 5 is usually greater than Wave 4 by price.
•It is typical for Wave 5 of a Leading Diagonal to end before reaching the channel line.
•It is typical for Wave 5 of an Ending Diagonal to exceed the channel line.
----------
**CORRECTIVE WAVES**
ZigZag Rules:
A ZigZag is a three wave structure labeled A-B-C, generally moving counter to the larger trend. It is the most common three wave Elliott pattern. Zigzags are corrective in nature.
•Wave A must be an Impulse or a Leading Diagonal.
•Wave B can only be a corrective pattern.
•Wave B must be shorter than Wave A by price. All internal points are considered.
•Wave B must be at least 20% of A by price.
•Although there is no minimum time constraint for Wave B, it must not exceed 10 times the time taken by Wave A.
Wave C must be an Impulse or an Ending Diagonal.
•If Wave A is a Leading Diagonal, then Wave C must not be an Ending Diagonal.
•Wave C must be longer than 90% of Wave B by price.
•Wave C must be less than 5 times Wave B by price.
•It is not allowable to have both Wave 5 of A a failure (Wave 5 is shorter then Wave 4) and Wave 5 of C a failure.
•Wave C must be no more than 10 times either Wave A or B in price or time.
ZigZag Guidelines:
•It is unusual for a Wave within Wave A to have a greater gross price movement than Wave A.
•Wave B should end nowhere near beginning of Wave A
•Wave B should retrace at least 30% of Wave A.
•Wave B is most likely to retrace Wave A by about 38.2%.
•Wave B is next most likely to retrace Wave A by about 50%.
•Wave B is next most likely to retrace Wave A by about 61.8%.
•The largest Wave in B is usually less than the gross price movement of Wave A.
•The time taken by Wave B is usually between 61.8% and 161.8% of the time taken by Wave A.
•Wave C is most likely to have a similar price length to Wave A.
•The next most likely price lengths for Wave C are 61.8% and 161% of Wave A
•The next most likely price length for Wave C is 61.8% of Wave A beyond the end of Wave A.
•If Wave C is much longer than 161.8% of A, then the pattern is more probably the beginning of an Impulse than a Zigzag.
•If Wave C is complete, and has a greater slope than Wave A, expect the Zigzag to extend to an Impulse.
•Although Wave C should always be greater in price to Wave B, in rare cases Wave C can be up to 10% shorter than Wave B.
•The largest Wave within C by price is usually less than the gross price movement of Wave A.
•The time taken by Wave C is usually between 61.8% of Wave A and 161.8% of the shortest Wave of A and B.
Flat Rules:
A Flat is a three wave pattern labeled A-B-C that moves generally sideways. It is corrective and counter-trend and is a very common Elliott pattern.
•Wave A can be any corrective pattern except a Triangle.
•Wave B can be any corrective pattern except a Triangle.
•Wave B must retrace more than 70% of Wave A.
•Wave B is less than twice the price movement of Wave A, including internal points of Wave B.
•Although there is no minimum time constraint for Wave B, it must be less than 10 times Wave A.
•Wave C must be an Impulse or Ending Diagonal.
•Wave C must share some common price territory with Wave A.
•Wave C must be less than twice the longest of Waves A and B, including internal points of Wave C.
•Wave C must be less the three times the price distance of Wave A.
•Disallow back to back failures.
•Wave C must be no more than 10 times either Waves A or B in price and time.
•There is no minimum time constrains for Wave A.
Flat Guidelines:
•Wave A is usually a Zigzag family pattern.
•Wave A is rarely an Expanding Triangle.
•The largest Wave within Wave A is usually less than Wave A by price.
•Wave B is usually a Zigzag family pattern.
•Wave B is rarely a Flat.
•Wave B is usually greater than 95% of Wave A by price.
•Wave B is usually less than 140% of Wave A by price.
•The largest Wave within B is usually less than Wave A by price.
•The time taken by Wave B is generally between 61.8% and 161.8% of Wave A.
•Wave C is rarely an Ending Diagonal.
•Wave C is often about the same length as both Wave A and B.
•Wave C often ends at point which is a percent of Wave A beyond end of Wave A equal to the same percentage away from the start of Wave A.
•Wave C usually retraces a minimum of 100% of Wave B.
•Wave C normally reaches to the end of Wave A
•Wave C is not often more than 140% of the longer of Wave A or B.
•If Wave C is longer than Wave B, then Wave C is often about 61.8% of A beyond end of A.
•If Wave C is longer than Wave B, then Wave C is often about 161.8% of Wave A from end of Wave B by price.
•The time taken by Wave C is generally between 61.8% of Wave 1 to 161.8% of the shortest of Waves A and B.
Triangle Rules:
CT = Contracting Triangle, ET = Expanding Triangle
A Triangle is a common 5 Wave pattern labeled A-B-C-D-E that moves counter-trend and is corrective in nature. Triangles move within two channel lines drawn from Waves A to C, and from Waves B to D. A Triangle is either Contracting or Expanding depending on whether the channel lines are converging or expanding. Expanding Triangles are rare.
•Wave A of a CT is always either a Zigzag based pattern or a Flat. Wave A of an ET can only be a Zigzag based pattern.
•Within Wave A of a CT, Wave B must be less than 105% of Wave A's price length. The same rule applies for Waves C and D of the CT.
•Wave B must be a Zigzag based pattern.
•Wave C of a CT can be any corrective pattern except a Triangle. Wave C of an ET must be a Zigzag based pattern.
•Wave B of a CT must retrace Wave A by 50%.
•For a CT, Wave C must be less than Wave B by price and Wave C must be greater than or equal to 50% of Wave B by price.
•For an ET, Wave B must be less than Wave C by price and Wave B must be greater or equal to 50% of Wave C by price.
•Wave D of a CT can be any corrective pattern except a Triangle. Wave D of an ET must be a Zigzag based pattern.
•Wave B, C and D must not move more than 10% beyond the A-C & B-D channel lines (based on the length of Wave C).
•In an ET, Wave C must be less than Wave D by price and Wave C must be more than 50% of Wave D by price.
•In an ET, Wave A must move within the A-C channel or pass through it by no more than 10% of the length of Wave B by price.
•In an CT, Wave D must be less than Wave C by price and Wave D must be greater than or equal to 50% of Wave C by price.
•The intersection of the channel lines must occur beyond the end of a CT, and before the beginning of an ET.
•The channel lines must either converge or diverge. They cannot be parallel.
•Wave D of a CT must not end such that when retraced 25% by E, E will not reach the price territory of A.
•Only one channel line in a CT may be horizontal. Neither channel line of an ET can be horizontal.
•The maximum time for Wave D is 4 times Wave C.
•Wave E of a CT can either be a CT or a Zigzag family pattern. For an ET, Wave E must be a Zigzag based pattern.
•In an ET, Wave E must be greater than Wave D by price and Wave D must be greater or equal to 50% of Wave E by price.
•In an ET, either Wave A or B will be the shortest Wave in the pattern.
•In a CT, Wave E will be less than Wave D by price and Wave E will be greater than or equal to 25% of Wave D by price.
•In a CT, either Wave A or B will be the longest Wave in the pattern.
•In a CT, the maximum time for Wave E is 4 times Wave C.
•Wave E must end in the price territory of A.
•Wave E must not pass through the B-D line, or if it does, by no more than 10% of the length of Wave D.
•The maximum number of pattern lengths into the future that the channel lines intersect is 6.
Triangle Guidelines:
•Wave A is usually a zigzag family pattern.
•Wave B is usually a zigzag family pattern.
•Wave C is often a zigzag family pattern.
•Wave C usually takes more time than any other Wave in the pattern.
•Wave D is usually a zigzag family pattern.
•Waves B, C and D rarely move outside the B-D line.
•Waves A, B, C and E rarely move outside the A-C line.
•Wave E is usually a zigzag family pattern or the same type of Triangle as the larger pattern.
•Usually at least two Waves travelling in the same direction will relate by about 61.8%.
•It is common for two or more adjacent Waves will be related by 61.8%.
•In a CT, Wave E normally retraces Wave D by about 70%.
•Double and Triple ZigZag Rules:
•Double (DZ) and Triple (TZ) Zigzags are similar to Zigzags, and are typically two or three Zigzag patterns strung together with a joining Wave called an x Wave, and are corrective in nature. Doubles are not common, and Triples are rare. Zigzags, Double Zigzags and Triple Zigzags are also known as Zigzag family patterns, or 'Sharp' patterns. Double Zigzags are labeled w-x-y, while Triple Zigzags are labeled w-x-y-xx-z. Both these patterns are included in the list of rules and guidelines below. Only a Double Zigzag is illustrated below.
Double and Triple ZigZag Rules:
•Wave W must be a Zigzag.
•Wave C of W cannot be a failure.
•Wave X can be any corrective pattern except an ET.
•Wave X must be smaller than Wave W by price.
•Wave X must retrace at least 20% of W by price.
•The gross price movement of Wave X must be less then 3 times the price movement of Wave W.
•Wave X must be no more than 5 times Wave W by time.
•Wave Y must be a Zigzag
•Wave Y must be greater than or equal to Wave X by price.
•Back to back and double failures are not allowed.
•Wave Y must be greater than 90% of Wave W by price, and Wave Y must be less than 5 times Wave W by price.
•Wave Y must be no more than a factor of 5 times either Wave X or W in price or time.
•Wave C of Y cannot be a failure.
•Wave XX can be any corrective pattern except an ET.
•Wave XX must be smaller than Wave Y by price.
•Wave XX must retrace at least 20% of Y.
•The gross price movement of Wave XX must be less than 3 times the gross movement of Wave W.
•Wave Z must be a Zigzag
•Wave Z must be greater than or equal to Wave XX by price.
•Wave Z must be less than 5 times Wave Y by price, and must also be less than 5 times Wave W by price.
•Wave Z must be no more than a 5 times either Waves XX, Y, X or W in both price and time.
•Double and Triple ZigZag Guidelines:
•The largest Wave in Wave W is usually less than Wave W by price.
•Wave X is usually a Zigzag family pattern.
•Wave X is usually less than 70% of Wave W by price.
•Wave X will usually retrace at least 30% of Wave W.
•Wave X is most likely to be a 38.2% retracement of Wave W.
•Wave X is next most likely to be a 50% retracement of Wave W.
•Wave X is next most likely to be a 61.8% retracement of Wave W.
•The largest Wave in Wave X is usually less than 140% of Wave W by price.
•The time taken by Wave X is usually between 61.8% and 161.8% of Wave 1.
•Wave Y is next most likely to be equal to 61.8% or 161.8% of W by price.
•Expect the time taken by Wave Y to be between 61.8% of Wave W and 161.8% of shortest of Wave W and X.
•Wave XX is usually a Zigzag family pattern.
•Wave XX is usually less than 70% of Wave Y by price.
•Wave XX will usually retrace at least 30% of Wave Y.
•Wave XX is most likely to be a 38.2% retracement of Wave Y.
•Wave XX is next most likely to be a 50% retracement of Wave Y.
•Wave XX is next most likely to be a 61.8% retracement of Wave Y.
•The largest Wave within Wave XX is usually less than 140% of Wave Y by price.
•Wave Z is most likely to be about equal to Wave Y by price.
•Wave Z is next most likely to be about equal to 61.8% or 161.8% of Wave Y.
•The largest Wave in Wave Z is usually less than Wave Y by price.
Double and Triple Sideways Rules:
Double (D3) and Triple (T3) Sideways patterns are similar to Flats, and are typically two or three corrective patterns strung together with a joining Wave, called an x Wave, and are all corrective in nature. Doubles are not common, and Triples are rare. Doubles are labeled w-x-y, while Triples are labeled w-x-y-xx-z. Both these patterns are included in the list of rules and guidelines below. Only a Double 3 is illustrated below.
•Wave W may be any corrective pattern except a Triangle, double or triple.
•Wave C of W cannot be a failure.
•Wave X may be any corrective pattern except a Triangle, double or triple.
•The minimum X Wave retracement is 70% of Wave W.
•The maximum price distance of Wave X is 150% of both the previous Wave and ensuing Wave. All internal data points are considered.
•Although there is no minimum time for Wave X, the maximum time is 10 times the time taken by Wave W.
•Wave Y may be any corrective pattern except double, triple or a Triangle in a Triple Zigzag. However, Wave Y cannot be a Zigzag if Wave W is a Zigzag.
•Wave Y must be greater than or equal to Wave X by price, except if Wave Y is a Triangle.
•Wave C of Y cannot be a failure.
•Wave Y must be no more than 5 times either Wave X or W in price and time.
•Wave Y has no minimum time constraint.
•Wave XX may be any corrective pattern except a Triangle, double or triple.
•The minimum Wave XX retracement is 70% of Wave Y.
•The maximum Wave XX retracement is 150% of previous Wave and ensuing Wave. All internal data points are considered.
•Wave Z may be any corrective pattern except double or triple. However Wave Z cannot be a Zigzag if Y is a Zigzag.
•Wave Z is greater than or equal to XX by price.
•Wave Z must be no more than 5 times either Waves XX, Y, X or W in price and time.
•Back to back and double failures are not allowed.
•If Wave Y is greater than Wave W by price, then the maximum Wave Z price movement is twice the price movement of Wave W.
Double and Triple Sideways Guidelines:
•The largest Wave in Wave W is usually less than 140% of Wave W by price.
•Wave X is usually a Zigzag family pattern.
•The largest Wave in Wave X is usually less than Wave W by price.
•Wave X is usually less than 140% of W by price.
•Wave X is usually greater than 95% of Wave W by price.
•The most likely retracement for Wave X is 110% of Wave W.
•Time for X is generally between 62% of W1 and 1.618 of the time of W1.
•If Wave Y is a Triangle, the most likely length of Wave Y is about 61.8% of Wave W. If Wave Y is not a Triangle, the most likely lengths for Wave Y are 100% of Wave W, 161.8% of Wave W and 10% of the length of Wave W beyond the end of Wave W.
•The largest Wave in Wave Y is usually less than 140% of Wave W by price.
•Wave Y is usually less than twice the longest of Wave W and Wave X in price.
•Wave Y is generally between 61.8% of Wave W and 161.8% of Wave W in time.
•Wave XX is usually a Zigzag family pattern.
•The largest Wave in Wave XX is usually less than Wave Y in price.
•Wave XX is usually less than 140% of Wave Y by price.
•Wave XX is usually greater than 95% of Y by price.
•The most likely retracement for Wave XX is 110% of Wave Y.
•If Wave Y is a Triangle, most likely length by price is 61.8% of Wave W. If Wave Y is not a Triangle, then the most likely lengths are 100% of Wave W, 161.8% of Wave W and 10% of length of Wave W beyond the end of Wave W, all by price.
•The largest wave in Wave Z is usually less than 140% of Wave Y by price.
•Wave Z is usually less than twice the longest of Wave Y and Wave XX.

Bitcoin (BTC)🧵 Trading Session // Bitcoin
Master Trading Plan: Most traders who fail do not have a clear plan.
Bitcoin looks like expanded flat correction to me. Also a bounce during a downtrend from 24000 mc gap to 32000. Overall I'm still targeting
lower price 19000 - 24000 I guess.
Fibonacci Relationship:
• Wave B = 123.6% of wave A
• Wave C = 123.6% – 161.8% of wave AB

BTCUSD Local Short!!BTCUSD broke the key horizontal level
Which is now a resistance
After retesting the broken level at 33900.0
And I think that it will fall further down
Onto the target level below

BTC - 15 May 2022 - PUMP is expected before the LAST leg downBitcoin seems to be in an expanding flat which has started in early 2021.
The 3rd wave seems to be concluded and we will be expecting the 4th leg up.
The 4th leg should enter 1st wave's areas which is at least 35k USD levels.

BTCUSD in BUY ZONE !!Hi fellow traders, BTCUSD has finally reached the blue box area and is completing the bigger expanding flat pattern. From this point we are waiting for one more push down as dollar is still showing some strength. If we break the red line the move up will be invalidated. Target will be previous top. Goodluck!

BITCOIN US DOLLARSThe Head and shoulders pattern has formed in the trend. It is a pretty good reason to open a position to LONG. I am expecting from price to reach around $36000 - $38000. From there Bearish trend will begin to $20000 - $18000.

Bitcoin Idea H1Here is my view for BTCUSD on H1. The price could go down, you can put a pending order on the Order block or find an entry on LTF within OB Zone. Trade Safe!

BTC monthly demand invalidated, liquidity pool drainedthe monthly demand zone is invalidated. liquidity pool drained of orders without pumping the price upwards. we're going down.

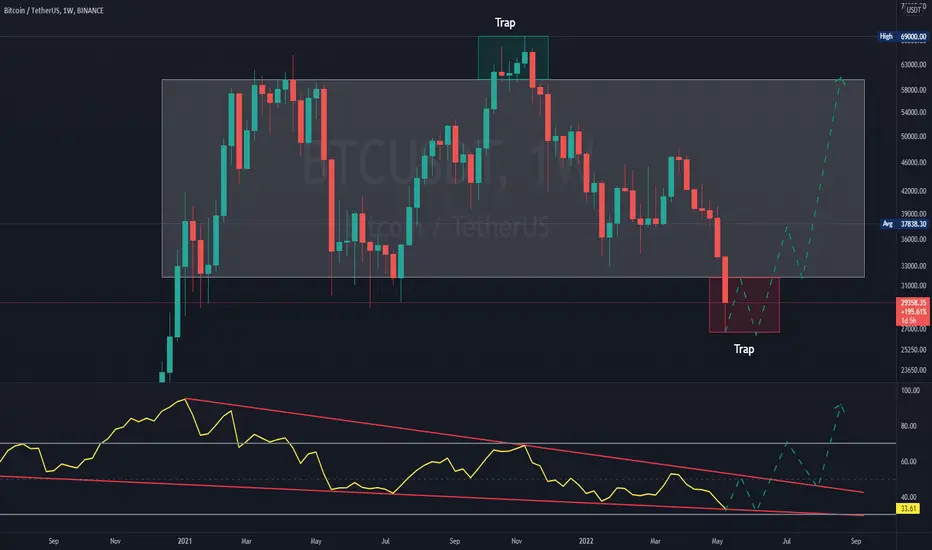
#BTC / $BTC Weekly UpdateIn Last years wee seen a Massive consolidation Between $30K to $65K
We see a Bear Trap (69K) and now we are on a Bear Trap (-$30K)
Expecting Price to retest another Bottom before reaching again the top and try to break for real this time above ($65K)
Also RSI in on Descending Triangle , expecting breakout and retest in the next Months.
Summer will be HOT again. 🧨
Patience is the Key 🏋🏻♀️
BTC Bitcoin Long Term target This is Monthly Log Chart from Bitstamp as it has data since 2011. More history and past data helps in analyzing the behavior and price structure.
Three Analysis on a monthly log chart on BTCUSD pair.
(1) Harmonic ABCD
Distance covered in AB Leg is same as Distance covered in CD leg (1:1 extension). C point as shown in the chart is retraced to 0.382 Fib of AB Leg and D point is at 2.618 Fib projection of BC Leg.
(2) Elliott Wave Analysis
You can see a Zigzag on a major degree. Zigzag is ABC where A leg is impulsive, B leg is corrective and C leg is impulsive. I have marked Substructure within zigzag clearly where in 12345 impulse is shown with blue colors and ABC correction is shown in red color. Note that this counts are based on monthly long term counts and usually in zigzag Wave A and Wave C are often at the same distance meaning distance covered in A leg is roughly same as distance covered in C leg. As we know EW Waves are fractal in nature I can go in major degree wave and count sub-waves and I will do that in some time in the lower time frame to count waves accurately with its FIB relation. But Usually this Zigzag and its impulse subwaves are preferred count. Alt count is not shown here.
(3) I have also shown Modified Shiff pitchfork and analyzed price against the pitchfork FIb levels. Pitchfork is very useful tool in analyzing the price and its long term trend. As you can see it took resistance around 1.618 FIB last time and retracement usually goes till median Line. With the same logic (and there is no reason to believe that it should not work this time) I am expecting roughly around 17K to 19K Price range where BTC should come.
Hope it helps.
Cheers
KB

Bitcoin at Monthly Support: Breaking or Bouncing
Bitcoins has arrives at Price Origin Point where it launched its uptrending move. It turns to be Monthly Support as well. Will price takes this low or bounce from here. Interesting to watch!!!

#BTC/USDT More pain? Or is it over? What happened in the last 1 week was unexpected and painful for many.
Now what's really important is whether BTC is already bottomed or not.
BTC made a low of $26,700 way lower than the previous support of $29k.
Now people are very panicked just like the covid time.
Also to notice, BTC is currently trading around the 0.618 Fib level extension which also happens to be the golden ratio.
The selling volume is high just like Covid, March 2020 and May 2021 which was followed by a V- shape Recovery.
So these are my thoughts:-
Breaking below $26.7k could take us all the way to $20k which is the previous support.
In case that happens, it will be rapid. There's no hard support between $20k and $28k.
With all the FUDs across the market, it's tough to make any concrete calls right now but one thing is for sure,
If you were looking to accumulate BTC, this could be the right time to start accumulating.
Am not sure about Altcoins since BTC Dominance is going up against better to be positioned in BTC and stables.
If BTC holds the green zone expect some good recovery in the next few days.
This is just my thoughts, not any advice.
You are responsible for your own trading and investing.
Let me know your thoughts
Thank you
#PEACE

BTC making bullish deep crab $30,800BTC is in process of developing bullish deep 🦀 harmonic on 12 hourly chart. It will complete at $30,800 level, Like always we use bullish harmonics to project future price action. It will take some days or weeks to complete this, Invalidation of this harmonic will be if BTC pumps to $47k level OR consolidation within the range for longer time.

BTCUSD - drastic Hello Traders,
From the market of Bitcoin 200 billions wipe out. People loose big money.
Why this happening? The answer is very simple. They do not pay attention to technical analysis.
If you know them, then is very simple how you control your portfolio in crypto.
You have many tools that provide indication of price change direction. Closed you position and case closed. You can open again when price change directions without loosing so much money.
This what I am showing you in my analysis, future change direction, trend line (which are incredible tools), channels and many more.
As a traders our task is to get as much as possible profit and with small losses.
There are the new candlestick formations that showing support and resistance.
Candlestick formation are very powerful indicators, but they have be confirm by support/resistance (SR) - true SR.
There is very high probability to predict hight of swings (waves). Look on USD Index, this will gives you idea that is going on with cripto.
I hope you not one of the traders that lost crypto.
Cheers,
Jim

Bitcoin - History Favors The 2 Week 100-SMAI'll keep it short, historically Bitcoin has ALWAYS respected the 2 week 100-SMA. Will it happen again?

BTCUSD short4h;
bearish trend line
bellow the emas
waiting for the break of the structure and s/r zone with a momentum candle
1h;
price action a bearish engulfing candle bellow the 14/5ema and below the 200
SL; above the ema's
tp; next s/r

BTCUSD Markets eye US CPI for further directionBTCUSD showed a relief rally after a massive sell-off.
Bull case-
Primary supply zone -$32500 (21-4H EMA).
Bear case-
Levels to watch- $28000 (Major demand zone).

Bitcoin- The pressure remains strongly to the down sideAfter reaching the 30k figure, as was normal, BtcUsd has had a rebound. However, this rebound was short-lived and the price is near 30k again at the time of writing.
Yesterday's candle has a long wick to the upside and it looks like today's candle will not be different. This can mean strong selling pressure and could lead to a break under 30k.
Supports come into place 2 from 2k, at 28 and 26 with important congestion support at 24k.
Short-term traders can target this 24k for their sell trades with negation above 33k.
