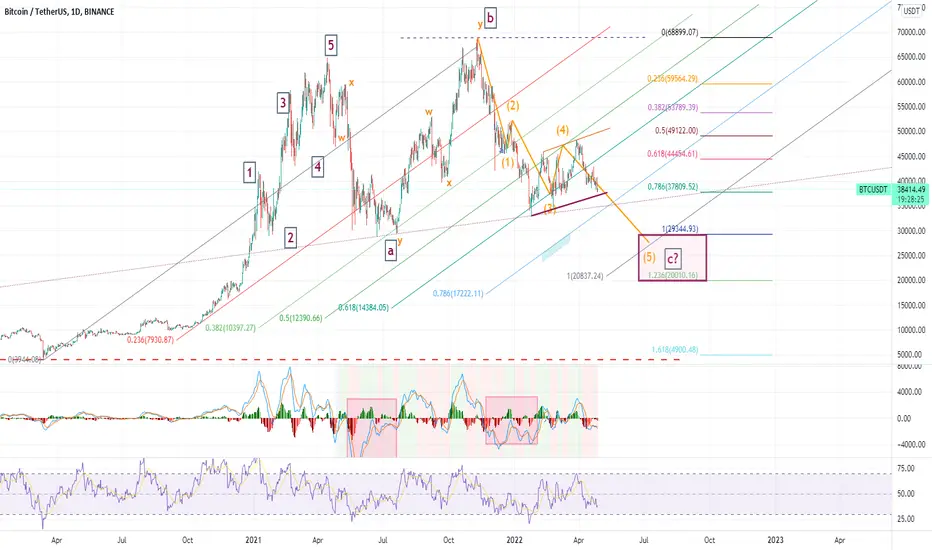
BTC, my view on BTCStill, thinking of expanding flat 3-3-5. already measure the C. and it approximately 123.6%(around 20k)
once it crosses thru the lower purple line that I drew, this prediction will become more realistic.
If its bounces up from the purple line, I think it's not gonna jump high(maximum 50k).
If it cannot hold, don't resist. let it fall and wait for the reversal.
feel free to comment below, let's exchange our views.
Btcusdforecast
Bitcoin- I still expect a big drop in priceLet's be honest, Bitcoin didn't do much this year and, excepting some spikes up or down, it moved in 10% range between 38k and 42.
However, looking at price development, is clear, at least for me, that bulls don't have any power and the pressure is on the downside
Yesterday, another spike up was fueled by FED, but also this is very short-lived.
My expectations remain the same, a drop in price to AT LEAST 30k, and we will see from there.
Any rally should be considered an opportunity for short in my opinion

BTCUSDT DAILY chart - Buy opportunityThe Bullish Engulf Candle is obvious. Take a look to buy at correction.

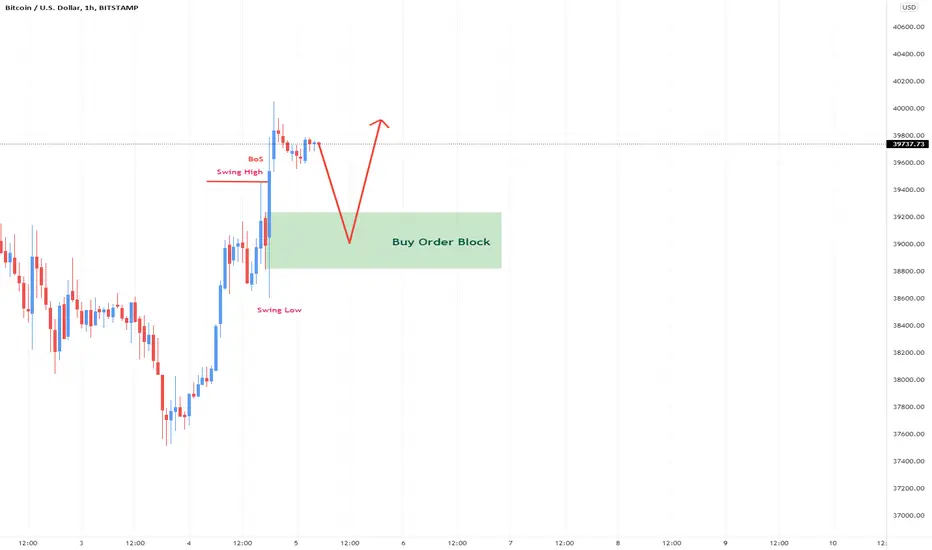
Bitcoin Prediction H1Here is my view for BTCUSD on H1. The price could go up, you can put a pending order on the Order block or find an entry on LTF within OB Zone. Trade Safe!
BTC CompraEl BTC ha roto una estructura bajista, el cual ha comenzado un nuevo ciclo alcista, yo en lo personal estoy dentro de la operacion desde hace 13 horas y estoy esperando un movimiento minimo de 800 pips.

BTCUSD Flash | What is happening?Price is currently sitting on both a bullish trendline and a strong demand zone that has held price "supported" since February 2022. Are we going to witness a breakdown or trend continuation in the next couple of days? What do you think?
Risk Disclaimer:
Margin trading in the foreign exchange market (including commodity trading, CFDs, stocks etc.) has a high risk and is not suitable for all investors. The content of this speculation (including all data) is organized and published by me for the sole purpose of education and assistance in making independent investment decisions. All information herein is for your reference only and I take no responsibility.
You are hereby advised to carefully consider your investment experience, financial situation, investment objective, risk tolerance level, and consult your independent financial adviser as to the suitability of your situation prior to making any investment.
I do not guarantee its accuracy and is not liable for any loss or damage which may result directly or indirectly from such content or the receipt of any instruction or notification therewith.
Past performance is not necessarily indicative of future results.

#BTC/USDT 1HOUR UPDATE BY CRYPTOSANDERS Hello, welcome to this BTC /USDT 1Hr chart update by CRYPTOSANDERS.
I have tried my best to bring the best possible outcome to this chart.
Show some support do hit the like button, follow and comment in the comment section. this motivates me to bring this kind of chart analysis on regular basis.
CHART ANALYSIS:-
On a 1hr chart nothing much changed, we can see BTC is still trading inside the triangle pattern and holding the lower mid trend line support very well.
In the current scenario, BTC is trading near the upper trend line resistance which BTC must need to brake this triangle pattern for a short-term bullish rally towards the $42k.
For now, we should wait for the confirmation to take any position in BTC OR ANY ALTCOINS.
If BTC breaks the lower mid trend line support then this chart will be invalidated.
This is not a piece of financial advice.
Sorry for my English it is not my native language.
Do hit the like button if you like it and share your charts in the comments section.
thank you.

Bitcoin 113 000 new ATHBINANCE:BTCUSDT
Here is continuation my previews idea (check bellow) about new ATH on Bitcoin price this year or beginning 2023 on regular chart
And LOG scale
What do you think?

Will The US Dollar Crash Bitcoin ????MartyBoots here. I have been trading for 16 years and I am here to share my ideas with you to help the Crypto space.
IF USD breaks out of this pattern it can put pressure on Bitcoin . So this is a very important pattern to watch
There is a bullish argument to this that I will need to make in another video
------------------------------------------------------------------------------------------------------------------------------------------------------------
If you want help trading Bitcoin or any other ALT coins hit me up , We will improve your trading . Have a look at the link below
------------------------------------------------------------------------------------------------------------------------------------------------------------

BTCUSD intraday trading & flying to the moon🚀 02 MAY 2022Bitcoin intraday trading alert
3 steps must fulfill before entry
1. 1st breakout done
2. Retracement done
3. 2nd breakout and see you in the sky🚀
Hope you like my Trading Alerts~
Cheers~

BTCUSD LONG - Buy Entry - D1 ChartBTCUSD LONG - Buy Entry - D1 Chart
Buy @ Market
Symbol: BTCUSD
Timeframe: D1
Type: BUY
Entry Price: Buy @ Market
Resistance @ 57759.8
Resistance @ 55421.3
Resistance @ 45071.2
Pivot Point Yearly @ 41736.7
Support @ 36886.5
Support @ 34504.7
✅ If you liked this analysis, please consider Following and giving it a Thumbs Up 👍
✅ If you have any feedback or questions, please leave a comment below as I answer each comment 💬
✅ Wishing you enjoyable successful trading 🙏

BTCUSD BEAR RALLY CONTINUES BITCOIN now trading below $38k as analyzed, who is still bagging.. another 1,000 pips bagged over the weekend, closed partial profits because price still looking extremely bearish..
Forever STUCKINPROFIT

What if bitcoin go below 30k?From my point of view, what if bitcoin price fall below 30k if it breaks the support trendline ( respecting the head and shoulders pattern)?
Although there is a chance of a possible come back above 44k if it did not break the support trendline.. but what if?
Any thoughts or a better idea?

Bitcoin Bearish H1Here is my view for BTCUSD on H1. The price could go down, you can put a pending order on the Order block or find an entry on LTF within OB Zone. Trade Safe!

BTCUSDBTC/USD may be about to open its May trading below the 40,000.00 mark. Even if a sudden spurt upwards develops it will have to be strong to create a positive short term outlook for Bitcoin. The biggest and most famous cryptocurrency among the heap still remains ‘champion’, but a return to its bearish trend has likely caused some speculative fatigue among BTC/USD traders.
BTC/USD has stumbled badly in April after beginning the month near a value of 47,400.00. The broad cryptocurrency market has also been overtaken by dark shadows again, and a correlation between the likes of Bitcoin and negative results in the NASDAQ 100 are being seriously discussed, even though they are not proven. Riskier trading assets have certainly seen less speculative buying the past month. The question is when a return of risk appetite, and perhaps even value seekers will start to create upwards momentum.
As of this writing BTC/USD is near the 39,500.00 level and has proven choppy the past few days. A low of nearly 37,660.00 was displayed on the 26th and 27th of April and the last time this value was exhibited was on the 13th of March, yes, essentially when Bitcoin began its two week upwards climb. The high price reached on the 28th of March which drove past the 48,000.00 barrier, led many backers of BTC/USD to potentially believe sunnier days were ahead and the long term bearish trend was dead. This however did not prove to be reality.
Although Bitcoin remains the key asset in the cryptocurrency market it remains under pressure. If the 38,000.00 mark were to prove vulnerable in the short term, this could set off additional fireworks which may ignite further nervous sentiment. The correlation to Bitcoin and the NASDAQ may appear farfetched to many, but a comparison of one year technical charts between BTC/USD and the NASDAQ 100 look eerily similar.
Bitcoin may not be believed as a cornerstone of the financial world by conservative financial institutions or investors, but its trading has mirrored nervousness in the global equity market. The next week of trading is sure to be rather tension packed as investors await the next U.S Federal Reserve interest rate pronouncements. Will BTC/USD be affected?
BTC/USD Outlook for May:
Speculative price range for BTC/USD is 32,100.00 to 50,900.00.
If a speculator wants to pursue more downside price action they should be fully aware that BTC/USD is near important support levels. However, if BTC/USD breaks below the 39,000.00 level and sustains price action below this juncture without technical signals that a reversal is about to occur, further downside could be tested. The 38,500.00 level could be viewed with dangerous suspicion.
BTC/USD has proven in the recent past to stage reversals upwards, when the 38,500.00 vicinity comes into view. Yet, if BTC/USD proves vulnerable and the 38,000.00 mark were to falter, this would certainly set off alarm bells among speculators who may believe lower price action is going to be seen short term. If March lows are broken and the 37,000.00 support level failed, a test of late February prices could be seen.
Speculators who believe BTC/USD will live up to its reputation and provide a strong reversal higher cannot be blamed. However day trading BTC/USD and holding onto Bitcoin as a long term investment are different. Day traders need to choose their leverage and targets carefully. BTC/USD could certainly start to launch upwards and if the 40,000.00 mark is penetrated higher and prices are sustained and a move towards 41,000.00 suddenly erupts, other buyers will be tempted to join the party. A move above the 43,500.00 juncture and a test of 44,000.00 could create additional optimism. BTC/USD can move fast and speculators who are willing to bet on upside may be proven correct, but being able to participate in a real upwards trade instead of merely predicting the move are two distinct beasts.

BTC TradingWe are now in the final part of bitcoin correction
In the final box, one of these three modes may be happen
I put their image as a link

BTC TradingAccording to my previous idea, One of the modes that may occur is not included in the previous idea, which is likely to be zigzag and a C long wave
and may be longer than A wave (161.8% of it).

BTCUSD Prediction H1Here is my view for BTCUSD on H1. The price could go down, you can put a pending order on the Order block or find an entry on LTF within OB Zone. Trade Safe!

bitcoin is moving on opposite side after breaking flag patternBTC is moving on opposite side after breaking flag pattern. We can see the unusual ups and downs from 4-5 days which are unexpected.
That's why it is confusing. So it's better to avoid from trading.. because BTC is not crossing resistance as well as support zone properly.
If you take any trade use low fund margin.
Best of luck to all🥰

BTCUSD intraday trading & back to the home ⬇︎ 28 APR 2022BTCUSD intraday trading alert
3 steps must fulfill before entry
1. 1st breakout done
2. Retracement done
3. 2nd breakout and see you in the home ⬇︎
More info in my profile..
Good luck traders..

BTCUSDT Bullish Short TermBTCUSDT has successfully bounced off the bottom Bollinger Band and after a short struggle, overcome the Point of Control on the Fixed Range Volume (indicator) which now acts as support along with the three uptrend lines. The uptrends with a smaller gradient are more secure and thus will be respected for longer whilst the high gradient ones will be respected for a shorter time period. Moving Average Convergence Divergence indicator (MACD) has also formed a golden cross and is now appearing bullish again. The Relative Strength Index (RSI) has been in an uptrend as well since 11th April 20:00 whilst price of BTC has been stagnant and even a little bearish therefore this conveys that although price is falling, market sentiment is risign and gaining strength. The RSI is forming a rising wedge pattern which will mostly likely break below thus illustrating the price to be underbought. The price will most likely correlate with the RSI and thus I have indicated the timeframes and the approximate price at which the price of BTC will fall (after having risen some) (blue box with text), or there can also be a divergence in the price of BTC and its RSI in which case this will be a RSI Divergence and depict a weakening in the momentum of the uptrend, however price will take some time to fall back down instead of falling rapdily like the former scenario.

Bitcoin- 30k is my target for nowOn Monday I said that "Bitcoin is drawing a nasty picture" and after a short-lived recovery above 40k figure, yesterday the price has dropped hard to the 38k zone, putting a bearish engulfing on our daily chart, which for me is a clear indication for downwards continuation.
At this moment the bearish flag that I've spoken above last week is broken to the downside and we can expect continuation.
My target for short trades is 30k and only BTCUSD back above 43k would change my perspective.

BTC READY FOR DUMPChart speaks for itself.
price break bullish trend line
and ichimoku cloud
No financial advice, do your own research
