Let's talk cryptoI overheard a conversation today which made question the types of investors we see in crypto and how ugly the market has become.
Let's get one thing straight, Bitcoin and many other alts have made serious gains in the past year and if you haven't made profits or taken them then you're a fool.
All you need to do is read twitter, go on instagram and even Tiktok now to see every person calling 100k, 500k where they hold about 0.0000042 BTC in their wallets. The majority of the people in the crypto space are brain washed into thinking that price can only ever go up. Go back to 2017 and you'll see everyone with the same mindset get humbled.
I am bullish on Bitcoin but only until $32200, if this level breaks we would create a new low on the charts and would look to really start a bear market (we are not calling a bear market yet but things are going in the right direction). From a different view Bitcoin looks to be making a new bullish low which could look to give us our next leg up. Regardless if we turn bull or bear I expect 57.5k to 59k to be met first.
I am an investor in crypto and I tend to stay silent on it because it's a very toxic space. For all I care Bitcoin can go up and my ROI increases or the markets dumps and I buy more. It really is simple and as long as you take profits then you really can't loose.
Should Bitcoin find a new lower high and break ATH we can expect 78k and then 84k as realistic targets.
Should Bitcoin break the support floor and make a new low we can expect the lows marked (24k, 17k and 7.5k)
Again I don't care which path it takes so don't get sensitive, you are observing a totally unbiased view on the pair.
Crypto and blockchain technology is wonderous and we are in very early stages of the capabilities. People are stating BTC is the new Gold, XRP is the next reserve currency and so on.
What we all need to come terms with is that Crypto is still in the early stages and you have seen no adoption into society, yes large cooperation's and governments are experimenting but this is not adoption. Adoption will take place once financial regulations and crypto on a whole can be controlled, you think companies are going to find stability in a crypto that can increase and decrease by 100s if not 1000s of dollars a day (NO CHANCE). Once crypto is adopted it will move like the FX markets where price is stable, coins found their worth and most importantly it can be regulated and controlled.
Here's an example of how UNREGULATED crypto is;
Tether the digital dollar, a great concept but behind the mask and hidden in plain sight there is very dark side. These whales, big wigs at tether owners and a select few individuals are printing and minting trillions worth of digital dollar and the great thing is for them it's unrealised, it has no affect on inflation and no effect on society. What's happening with all these trillions of Tether dollars which are printed and don't make it to public domain and seem to vanish?? They find it's way to a large purchase or Bitcoin, this bitcoin is then sold for real dollars. Get what's happening yet? fake currency is being used to buy real assets to then turn into real currency which can be used. It's such a simple idea that it's hard to believe it's happening. DYOR into this, when Tether prints there's always an increase in BTC orders. This has been ongoing for years and it's why the markets need regulation, adoption will take place once regulations are in place. It is then we will find the true value of our holdings. BTW once this story is uncovered through regulations (AND IT WILL) a huge market crash will come. Time is ticking.
Btcusdforecast

BTC the most possible scenarioBTC / USD
BTC price made another rejection today which increases the possibility for testing 37k channel support
– At channel support the market will decide either
1- do small pump followed by major dump to 32k-28k support
OR …
2-Do strong pump to 48k-50k
Keep in mind that since beginning of 2022
, BTC is still trading inside this channel ,so the breakout will happen soon !
what do you think the most possible scenario ?

BTCUSD For the BullsAs time ticks, price is written
Lazy authors are pretty prevalent, including those that write this price action (even if it is a bot)
Patterns reappear, structures can be compared, hope is rebuilt and destroyed
I believe we are in a prolonged bull market which lately has seen small downsides, patience pays in this market using the past as a reference (if i can)
Stay strong, Hodl strong

BTC/USDT - Potential 45% SetupHello Traders!
After going beyond the upper boundary of the $37800 - $45600 side range, the BTC price consolidated between $45600 - $47800 for more than a week. Then there was an appearance of voluminous sellers, as a result of which the price returned under the level of $45600 in the sideways range.
Bitcoin showed a clear correlation with the S&P500 broad market index, which started correcting after the Fed speech last week. The theme of the speech was the winding down of the quantitative easing program, as well as raising the base interest rate.
It should be noted that the market has already put the probability of such actions of FRS in the price several times. At the moment the sentiment on both markets is not in favor of growth, many participants since the end of 2021 went out of risky assets. On the other hand, the record indicators of inflation in the USA were announced this week, which amounted to 8.5%.
Taking into account the above mentioned it is possible to expect the irrational behavior of the market, which may result in the local growth.
It is possible to look for purchases near the current price values of $39400 - $41400.
Closing the deal using stop loss is worth in case of price leaving below the level of $35400
The profit-taking targets will be price levels of
$51500
$55200
$59600
Good luck and watch out for the market
P.S. This is an educational analysis that shall not be considered financial advice

Bitcoin WeeklyBitcoin ( 1W Timeframe)
Famillar right? A flat regular elliot pattern on weekly timeframe. Let's see if mag materialize

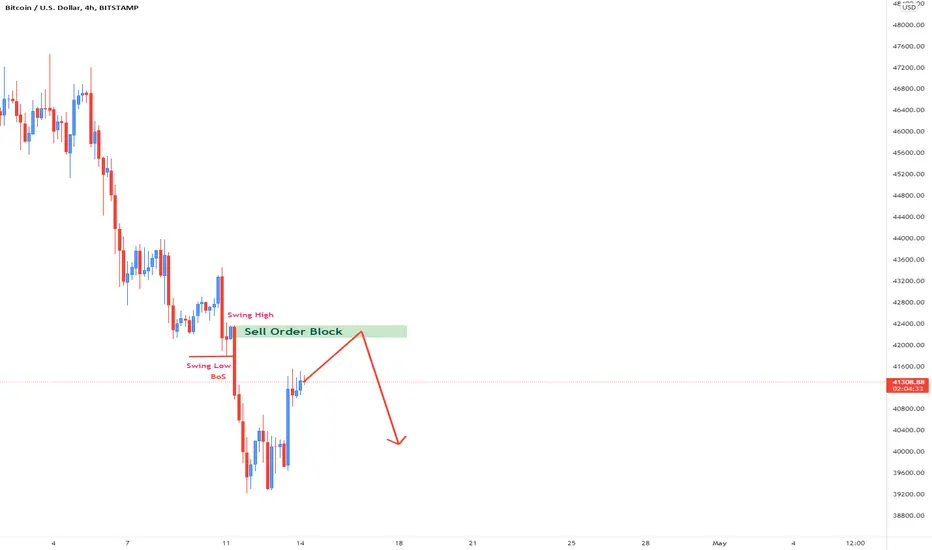
Bitcoin Prediction H4Here is my view for BTCUSD on H4. The price should go down, you can put a pending order on the Order block or find an entry on LTF within OB Zone. Trade Safe!

BTCUSD BEAR RALLY CONTINUES AS ANALYZEDIts been Three week when someone said i should go check the doctor that i am sick for selling BTC
Another said i should report myself to the police and stop posting..
well, i hope they have back up funds, because BTC has been dropping since then...
Who is bagging the bears with me?
leave a comment below if you are STUCKINPROFIT

BTC making alternate bat target $36,161BTC is in process of developing alternate bat harmonic. Since we are in bearish trend so we use bullish harmonics for downward price projection. This harmonic will complete at $36,161. This harmonic will most likely complete because if we look at 4H chart, We see a death cross happening in a day which will lead to more downside. Oscillators on 12H are way over-sold but that don't matter when market is entirely bearish. Maybe just MAYBE we will see a slight bounce to $40800 or even a fake out towards $42K and then it will be just downward momentum. Although upside seems highly unlikely but I am giving benefit of the doubt to over-sold oscillators.

BTC/USDT 6HOUR UPDATE BY CRYPTOSANDERSHello, members welcome to BTC/USDT 6hr chart analysis by CRYPTOSANDERS.
I have tried my best to bring the best possible outcome in this chart.
First, hit the like button follow me and comment in the comment section because this motivates me to bring this kind of chart analysis on regular basis.
CHART ANALYSIS:
As we can see in the above-mentioned chart that BTC bounced right from the lower trend line or the green support zone.
Here BTC can come down some more % to the lower trend line which is the strong support zone.
For more such latest updates follow our channel and comment below.
Thank you.
This is not a piece of financial advice.
Sorry for my English it is not my native language.
Do hit the like button if you like it and share your charts in the comments section.
thank you.

#BTCUSDT on Support but $39200 might not be the bottom!BTC managed to bounce from the $39200 low.
This 12 hour chart shows possibility of another 3 to 5% decline in BTC price to touch the lower bottom trendline support.
Although $38k is an important support for BTC BTC might wick down to $37200 only if it breaks the recent low of $39200.
So $37200 is $39200 is a good range to long on low leverage or buy on spot.
Losing this channel on the lower trendline will be a red flag for this rally.
Bears will take over in case BTC breaks this channel./
So right now it's important to be extra cautious to preserve your funds.
Conclusion:- As per TOTAL and TOATAL2 Chart Market should pump in the coming days keeping in mind a possibility of new low below $39200.
Invalidation:- Close below this channel.
Let me know your thoughts.
Do hit the like button if you like it.
Thank you
#PEACE

Wiill BTC go to 58 K or 35 K? Check this!Hey Peopls
As we can see, there is a bearish mood again. But is it really so? We need to monitor the following levels. If we get above the monthly opening, BTC will move very fast to 58 K.
I am showing you my plan. Its a bullish plan to get 56-58 K. The important is weekly and second important resistance is 44K-45,5K. If will break this region we will see 56-58K.:) if not 35 and lower is fakt.

RISK ON vs RISK OFF 📉📉as i use this confluence to enter trades.
🎯 Risk ON vs Risk OFF market sentiment reflects all the market activity, its not a market sentiment for crypto or forex or stock market its for all the financial markets, when i use this confluence i try to understand what are institutional/retail investors are doing are they buying risk on assets or they are buying risk on assets.
🎯 Usually investors buy risk on assets when they are looking for risk meaning they want higher yield on their investment they want to MULTIPLY money(key word) this is happening during times of financial prosperity, no wars, no lockdowns, no problems around the world everyone are doing great and making money
🎯 On other side RISK OFF is when investors tend to buy financil assets that PROTECT (key word) their capital they dont want a high yield they want just to save their money and protect during time of financial stress, wars, lockdowns when everything is not clear and safe.
✅ RISK ON Assets
Stock Market
Crypto
USOil
AUD
NZD
CAD
EUR
GBP
✅ RISK OFF Assets
Government Bonds
JPY
CHF
USD
GOLD
SILVER

BTCUSD don't BUY yet!Hi fellow traders, I've been posting many charts on BTCUSD lately because we are getting closer and closer to the point where we will see Bitcoin rise once again. It is important to look at the bigger picture now on the weekly. I believe this is a large corrective structure in the shape of an expanding flat pattern. Thus we will break de previous bottom at 28k and we should see a sharp rise from anywhere within the blue box. I will keep updating the BTCUSD chart on smaller TF's. For now, stay patient guys. Goodluck!

BITCOIN LONGS 📉📉📉📉 Expecting bullish price action on BITCOIN after price takes out sell side liquidity in form of asian lows that was made on 9 april, price closed bullish above 42.000$ institutional figure. The reason i am very bullish right now on BTC as i dont think we will see a move lower with some many bearish imbalances aka price inefficiencies left behind. I think price will rise to close them and THEN WE CAN go to the downside. STOCKS should go up imo at the start of the week and as we have positive correlation it should push BTC up as well.
FEAR/GREED Index says we are in a FEAR now meaning there is a good buying opportunity
What do you think ? Comment below..

#BTCUSDT at decisive point. Triple bottom in play?42k is a crucial level for BTC to hold.
Triple bottom formation in play.
Bullish divergence in RSI.
If the triple top in USDT Dominance works out.
We are likely to bounce from here.
But it's always better to stay extra careful when you are trading a market that never sleeps.
Close below $40.9k will tigger a rally towards 38k which has been plotted as scenario (LESS LIKLEY BUT POSSIBLE)
Let me know your thoughts.
Do hit the like button if you want me to post more of these short updates during unusual market behaviour.
Thank you
#PEACE

BTC giving long-term bearish signsI don't mean to scare away anyone with this analysis but I want to show you some crucial levels which need to HODL for further upside.
Let us start with 2D chart, MA50 is very important level here which if btc does not HODL then we are looking at minimum 20% dump in coming month but if this level HODLs and MA200 is reclaimed then welcome the bull market. MACD flipped bearish which I marked with a circle which means that we are going to stay in a downtrend for sometime. Bullish narrative will build ONLY if MA200 is fully reclaimed.
On weekly chart, I have market the circle on stochastic which is flipping to a sell signal. Now most importantly we need to look at EMA10, Everytime price broke down from EMA10, It dumped over 39% so we can see that the price seems to be closing below it, If next week candle close below $40K then we are possibly looking at longer period of downtrend.

#BTCUSDHere Is BTC Idea BTC Is Strongly Bullish Now But Market Come Down To Take Sell-Side Liquidity and Fill The Imbalance Then Imidiatlt Go Up and Clear Buy-Side Liquaty

A massive #Bitcoin bounce is incoming! After Creating This Higher High, Bitcoin Confirmed the Uptrend - Bitcoin Looking to Form a higher Low.
Reminder : #Bitcoin still trades in a weekly ( Daily ) Uptrend!
EXTREME BULLISH #BITCOIN WEEKLY RETEST! 🚀👇
#Bitcoin Bullish Divergence 4h 🔥
#BITCOIN WILL MOVE BIG WITHIN 24HRS!! 🚀👀
A bounce and break through this line is imminent with the current signals:
- 1 hour double bottom
- 4 hour falling wedge
- 4 hour bullish divergence
- Huge weekly support
Start with finding confluences with trading 😉

BTCUSD (Bitcoin) Bull and bear caseBTCUSD showed a sell-off after Fed meeting minutes.
Bear case-
Levels to watch- $42980 (55- day EMA). Any daily close below that level confirms intraday bearishness.
Bull case-
Primary supply zone -$44100. The breach above confirms minor trend continuation.
if move up after trendline testing It is good to buy on dips around $42000
SL $41700
TP of $52000.

BTCUSD BEAR RALLY CONTINUES AS ANALYZEDEarlier this week i got so many criticism about my bias on BTCUSD
I have not let the noise convince me, stayed in my selling positions and watching buyers lose 4,700 pips to the Moon in one week lol..
Can not stress with newbies anymore, if you are bagging from this Analysis, kindly comment and lets forever be STUCKINPROFIT

BTC/USD Hello Everyone
If You like my idea please dont forget to follow and hit like button for more updates about BTC and others alts
Actually Btc going to the next support lvl 41700 $ " demand zone " where we can rebounce if not we will see 35500$ again

BTCUSD BUY OPPORTUNITY WITH PRICE ACTIONThe currency is now trading at 43500$ and is trading within a downtrend channel at the time of writing this trade suggestion. The scenario for Bitcoin is ambiguous: on the one hand, a price above the psychological threshold of 40000$ recommends long, but on the other, the declining channel at present levels is beginning to signal sell.
However, a little upward advance to the upper boundary of the downtrend channel is anticipated at this time. You can take the level of 44452$ for a sure take profit. This level has a strong resistance region, and the area's trading is unlikely to allow buyers to continue higher in the short term.
