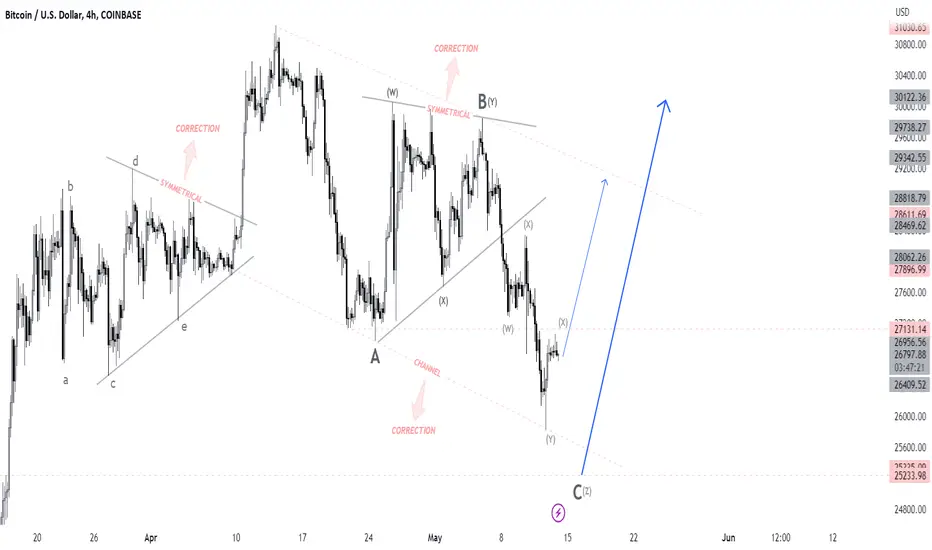
BTCUSD Trend AnalysisExpecting a fall of around 17% towards 22000 level as per the WXY correction after which a massive 120% rally will happen towards 49000 level.
This 17% fall will sweep the liquidity to fuel the upside move and is highly likely to happen.
This is in correlation to Crypto Total Market Cap which is linked below.
Good to look for investment opportunities during this fall instead of panicking.
This is not a buy or sell recommendation, do your own due diligence before taking any action.
Peace!!
Btcusdforecast

BTCUSD 13/10 MovePair : BTCUSD ( Bitcoin / U.S Dollar )
Description :
Bearish Channel in Long Time Frame and Rejection from the Lower Trend Line and making Consolidation Phase in Short Time Frame if it Breaks Upper Trend Line then it can Reach its Previous Support or Upper Trend Line of Channel
Entry Precautions :
Wait until it Breaks UTL or LTL

Bitcoin next few weeks or months idea Here i have shared a quick idea on #BTC which im expecting in next few weeks or months #NFA

BTCUSD 29/09 MovePair : BTCUSD ( Bitcoin / U.S Dollar )
Description :
Consolidation Phase in Long Time Frame as an Corrective Pattern. It has completed " AB " Corrective Wave in a Corrective Pattern " Bullish Channel " if it Breaks Previous Resistance or Upper Trend Line then it will Complete its Impulsive Move

Where to from here on BTCI did a series of similar posts on SPX predicting its paths, and they have played out beautifully.
Let's see what BTC is up to.
We must look at a lot of things when guessing the direction of any asset, like looking at DXY, yields and traditional markets, but in this post, I will ignore all that, look at BTC purely based on its market structure.
On larger timeframes we have not made any progress at all in 6 to 7 months on bitty. We have just been ranging, we ranged from 25 to 31K in Range 1, then again did the same thing in Range 2 and now it seems are about to repeat that again and maybe form range 3. I want to see either Range 4 or Range 5 present themselves for any new possibilities until then well we just keep ranging. Right now, I am looking at the yellow part that played out last time when we rotated from bottom to top in Range 1.
An additional thing to note is the time it took for full rotation in Range 1 was 94 days and we are on the 94th day today and in Range 2 where we are seeing comparable price action highlighted in yellow so the possibility of a full rotation back-up must not be ignored.
If we do, there are two long term play that appear, we either break out of this range and form a Range 4, above, or we are in a distribution here and will create a Weekly Head and shoulder by creating a lower high this time around 29500-30500 area.
Now to the question, why have we been ranging.
Because of the law of supply and demand. We have massive Supply right above where we btc has been hitting its head and bounce from weekly demand.
As you can see, we have almost depleted the supply, but demand is deep, and we have only scratched the surface of it. So, it's possible if we create a lower high this time around, we dig very deep into the demand which would be in confluence with the target of the Head and shoulders that will form with lower high.

BTCUSDTechnical analyses sometimes are very strict. BTC $25k is still in action ?!
Please do not pay attention to this post. (I just looking for a new support to add position) :)))

BTCUSD 04/09 MovePair : BTCUSD ( Bitcoin / U.S Dollar )
Description :
Bullish Channel in Long Time Frame with the Breakout of the Lower Trend Line and Completed the Retracement but Failed to Break the Previous Strong Support , If Reject then it will fall from Fibonacci Level - 61.80%

Btc 25/08 MovePair : BTCUSD ( Bitcoin / U.S Dollar )
Description :
Consolidation Phase
R Channel in Short Time Frame as an Correction
Fibonacci Level - 61.80%
Break of Structure
Strong Support Zone

BTCUSD 16-08 Next MovePair : BTCUSD ( Bitcoin / U.S Dollar )
Description :
Bullish Channel in STF as an Corrective Pattern
Support Level
Impulse Correction
Break of Structure
Consolidation Phase

BTCUSD 11-08 MovePair : BTCUSD ( Bitcoin / U.S Dollar )
Description :
Consolidation Phase
Completed Impulse and Corrective Wave " ab "
Divergence - RSI
Break of Structure
S / R Level

Bitcoin price analysis 3 AUG 2023Bitcoins' Price Trends: A Brief Analysis Hello there! 😊 Have you checked on your Bitcoin (BTC) lately? The latest price is now at $29,081.00. Sadly 😞, Bitcoin has experienced a slight slump in its price over the past week. Just in the last 24 hours, it faced a decrease of -1.61%, and a total of -1.32% drop during the past 7 days. Wondering about support and where to aim next? Let's keep the conversation going!

BTCUSD Analysis 2Aug2023Bitcoin ... I see for now the price is more likely to bearish. If you look at the market structure (if you have trouble seeing the market structure, I help with H-L-H-L notation) the possibility of continuing the bearish trend is still quite high. Although there is a possibility of limited bullish up to SND, but I am sure prices still tend to bearish in the next few weeks.

BTCUSD Bitcoin Next Possible MovePair : BTCUSD ( Bitcoin / U.S Dollar )
Description :
Consolidation Phase with the Breakout of LTL
Divergence
S / R Level
Symmetrical
Fibonacci level - 38.20%

BTCUSD Analysis 16July2023Currently it looks like the price is consolidating (sideways) if the price falls lower than the sideways area, there is a possibility that it will continue to fall until the SnD area. but if the price can survive and return to bullish then the goal is 34000.

BTCUSD Bitcoin Next Possible MovePair : BTCUSD ( Bitcoin / U.S Dollar )
Description :
Bullish Channel in Long Time Frame as an Corrective Pattern
Consolidation Phase
S / R Level
Break of Structure
Completed " 1234 " Impulsive Wave
RSI - Divergence

Bitcoin OutlockAs we know, Halving is approaching and approaching. Many people wonder happens before and after this. Well look at this chart. There might be some dump before it like 2020's, but also no dump like 2016's. Regardless, there is an up to 18 months rise afterwards until a new ATH.
How do you think the next halving which will occur on April 26, 2024 will play out?

BTC - A Tale of a Ten Year Old Support Trend LineLads please pay attention! This 10 year old support trendline turned into a resistance in November 2022. Approach with extreme care! But bare in mind that this is crypto and it could get blasted through with vengeance.


BTC Swing Long After 85% Bear MarketBTC Bear Markets typically will take us down -85% before the start of the next cycle. We aren't quite there yet, but we would be if we reached the macro GP pulled from the previous bear market low to our current ATH. It also coincides with the last down candle/order block that broke bearish structure and caused the last macro impulsive move/bull run. This idea has us dropping into the depths for a real capitulation, shaking out all of the weak hands and making everyone lose hope before finally putting in a bottom right before the BTC halving. We should see a real bottom in December of 2023 if this is the case.

Bitcoin Next Possible MovePair : BTCUSD ( Bitcoin / U.S Dollar )
Description :
Bearish Channel in STF as an Corrective Pattern
Divergence - RSI
Completed " ABC " Corrective Wave
Consolidation Phase
Break of Structure
Fibonacci Levels
S / R Level

BTCUSD 4June2023BTC medium term looks bullish. currently it could still be in the wave 2 period. although last week BTC managed to get out of the sideway area, but the range for prices to make corrections is still very wide.
looking at the fibo retracement area, there is a SnD area right at the 0.236 level (the price has dropped 76% from the last bullish swing) in my opinion this area is quite dominant, although in the medium term BTC looks bullish but it is likely that wave 2 is still not complete and it could be that the price is heading towards the SnD area.

Bitcoin Next Week Possible MovePair : BTCUSD ( Bitcoin / U.S Dollar )
Description :
Completed " ABC " Correction
Impulse Correction Impulse
Symmetrical Triangle
SMC - CHOCH
Break of Structure
Bearish Channel as an Corrective Pattern in Long Time Frame and Rejection from the Lower Trend Line
Impulsive " wxyx " Wave will Completed its " z " at Daily S / R Level