#BTC update The trend is in the middle as BTC 23500 is not brokBitcoin gives a fakeout above the resistance level to hunt stop loss and liquidate high leverage positions. BTC is now trading below the resistance level which is not a good sign. Today global markets opening will decide the next move for BTC. The support and resistance levels remain the same.
Btcusdidea

#BTC update The trend is in the middle as BTC 23500 is not brokBitcoin gives a fakeout above the resistance level to hunt stop loss and liquidate high leverage positions. BTC is now trading below the resistance level which is not a good sign. Today global markets opening will decide the next move for BTC. The support and resistance levels remain the same.

Bitcoin: Trade Update!This is at the midpoint of the 4H supply. 3 HHs into it, and I believe 3 is the charm. 15m Choch x2, so I feel good about the entry. There is LQ to sweep going into the 15m SZ, which is something I always look for.
The target is the sell side LQ ($)
Please refer to my previous video for the full analysis. Link below in Related Ideas.

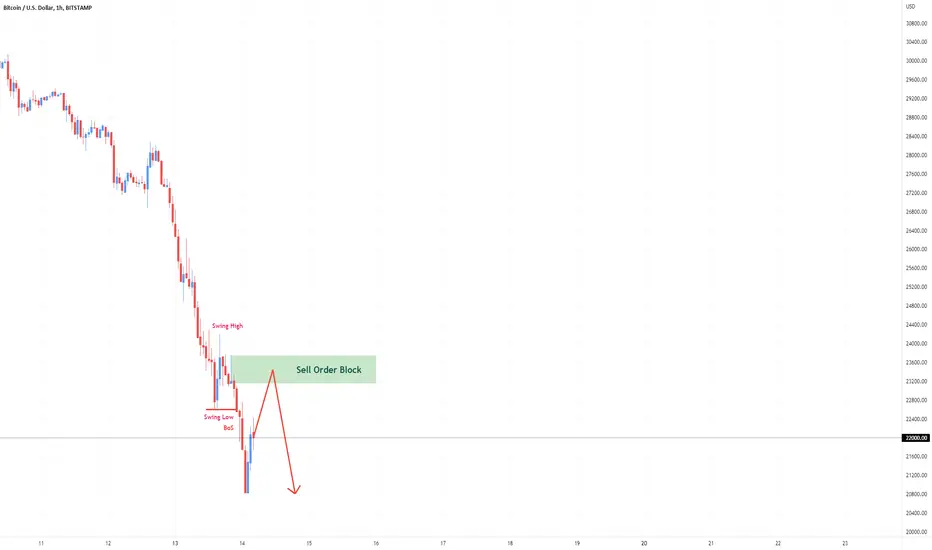
Bitcoin may be heading lower....BTCUSD has traded into supply, and rejecting.
May be heading lower for the weekend.

BTCUSD Long Positive Wave.Not gonna lie guys I am buying it till I hit 25000 target, I think it's incoming. But if it backfires then make sure u already set-up ur Stop loss.

BTCUSD TO 16200!!! (SELL OFF)Never buy the first bounce!!! the first basic principle of Crypto. Looking for a 4800 pips of Sell for BTCUSD, looking for a double top formation on this setup on a 2HTF.
RISK OFF!!!!
NB: Yellow Box; Supply Zone
After hitting my TP, I'm looking for the real bounce of price to 27,000.

BTC/USDT 1hr CHART UPDATE!!Hello, community members welcome to another BTC/USDT chart update.
If you find this update helpful, shoot the like button follow and share your views in the comment section.
As we can see at this above-mentioned charity BTC is currently on the way to printing an inverted head and shoulder pattern but the right shoulder is still incomplete.
Let’s see how BTC performs in upcoming hours and goes in which direction.
Formation of an inverse head and shoulder and break above will lead BTC towards the price level of $23k.
NOTE: This is not financial advice. This is for education purposes only. I am not responsible for the profits or losses you generate from your investments.
DO YOUR RESEARCH BEFORE MAKING ANY TRADES.
Thank you.

BTCUSD Capped Between 21-EMA and 55-EMABTCUSD regained above $20000 on short covering.
NASDAQ (positive correlation with BTC)- Mixed (neutral for BTC).
US bond yields (Bullish)- Negative for BTC
A jump to the next level of $23000/

Btcusdt btc may hit 24k this weekend Btcusdt is on sideway but it's possible to hit 24k this weekend according to what am seeing here 24k is possible this weekend have a nice trade

BTCUSDT EFFECTS ON ITS TREND PATTERNSBITCOIN | From july 19,2021 till date, btc has apparently formed three bearish pattern which has been identified on the chart. The head and shoulder pattern has completed its cycle but then btc still continues with bear sentiment due to the breakdown at the resistance level($43.03k) which is the weekly support and the continuous bearish patterns formation. The only save for btc is the third pattern which is the ascending triangle that could prone btc to retest the weekly resistance for the second time,in the event it breaks, a huge uptrend is likely but if gets rejected again, we'd definitely see a nosedive in the whole crypto mkt as btc will look forward to the area that needs to be retested before we see a trend reversal. The minor and key s/r levels have been highlighted on the chart, its advisable to keep tabs on the highlighted areas to be cognizant on the next move to avoid liquidation.
Your likes and comments would be much appreciated, you can follow up for more helpful contents and do follow my comment sections too for quick updates...

BtcusdtIs this the bottom? Please drop comments 🙏😪
This is weekly time frame
Let's see weekly candle close

BtcusdtBtc hit 18712 from my long and If you are in that trade I expect you to take profit @18700 because generally BTC is bear or bull I can't say but here is what I know
$20,000 is broken 😞
Stay away from market for a while. If u are newbie
A descending triangle on the hourly chart broke in a downward direction. The target of this triangle breakdown is the $16,700-$17,000 area. There is no strength in the market yet and big liquidations are going on. BTC needs to go above $20,000 to bring some positive momentum. Wait for Monday for the global market opening.

BTC analysisit's simple if the price could engulf the yellow line, the price will surely go to the bottom of the first level and if, unfortunately, the first level is engulfed by the price, the price can go even deeper to the second level

btc/usdt fainl move the end of more than 7 months of massive corrction
17700-15500 its the bottom of it

Btcusd bearish view following trendlineHi everyone in the TradingView community. I am Rana Sarmad I like to share and talk about trading strategies. If you are a member of my subscribers list and like my ideas, please don't hesitate to let me know by hitting that Like button and growing my notification count!
We are going to discuss about BITSTAMP:BTCUSD
We can see a clear breakout through its previous support and currently standing near is 2017 record high. Its a strong support in D1.
And FED hike the rate by 75 bps.
So we are expecting more fall near 17000, than 12000 and than last target could be 3800$.
This is my opinion, I really hope this will be useful for you.
This is not a financial advice. Always take trade at your own risk,
Be ready and take care your money. Have a great profit !
Risk Warning:
Trading Forex and Leveraged Financial Instruments involves significant risk and can result in the loss of your invested capital. You should not invest more than you can afford to lose and should ensure that you fully understand the risks involved. Trading leveraged products may not be suitable for all investors. Trading non-leveraged products such as stocks also involves risk as the value of a stock can fall as well as rise, which could mean getting back less than you originally put in. Past performance is no guarantee of future results. Before trading, please take into consideration your level of experience, investment objectives and seek independent financial advice if necessary. It is the responsibility of the Client to ascertain whether he/she is permitted to use the services of the EMOTT brand based on the legal requirements in his/her country of residence........

Long BTCGiven the existence of almost; 1600% increase There is always a 1600% increase from the floors in the weekly analysis for a long period of 1 to 2 years. Note that the price is $ 220,000! This analysis is long-term and weekly

Be ready for long BTC My swing indicator is accurate at high win rate 100% as of now I can tell you to be ready for long after the previous signal from 68k to short.

Bitcoin Panic is in the Air...The Mayer Multiple has helped to mark points of extreme panic in the Bitcoin market for quite sometime now. Whenever it has gotten into a range of 0.50 to 0.60, it has proven to be a good time to establish long term positions. If someone has been waiting patiently to enter or add to their Bitcoin position, right around this zone could be a good entry level. Now, one thing to point out is that Bitcoin has never seen a major dislocating event in the markets vis a' vis a 2008 style collapse in asset values. So it is conceivable that prices could certainly go much lower then anyone has ever dreamed. With that being said, again sitting in cash long term may prove to be folly so if even a small portion is deployed into Bitcoin during periods of extreme panic and bearish despair as we are see today, it could prove to be a worthwhile investment longer term.

Bitcoin Chart H1Here is my view for BTCUSD on H1. The price could go down, you can put a pending order on the Order block or find an entry on LTF within OB Zone. Trade Safe!
BTCUSD SELLHi fellow traders, we can still see one last wave lower on BTCUSD. Target the 25.5k area. After that we will wait for a huge long opportunity and avoid selling any further. Goodluck!

btcusdt shortAs you can see, it is a downward trend and you should still wear shorts in every pullback until it stabilizes above 28.

#BTC Current Update! Must Read if you are in LOSS!!BTC DAILY:- Still holding the necessary $28k support, the last hope for the bulls.
Break below that level and BTC could reach as low as $19.4k considering the current pattern as a Big bear Flag.
However, if BTC manages to break and close above the $28.8 k to $29.3k by the weekly closes we can expect some green weeks ahead. Firstly the $32k level needs to be taken by the bulls.
So is it bearish now? Of course, if you see the ltf charts, it's damn bearish. If you think with the logic here, this might be the last sweep before the last rally? Well, honestly IDK. Time will tell. BTC is long long overdue for a green weekly candle.
Our job is to wait for the confirmation and take trade decisions accordingly.
MY PLAN:-
Wait for the weekly close to take any trade decisions.
I am not taking any trades in the last 3 months—a few scalps when I see the opportunity.
Mostly hit SL. Sign of a bad market!
Unless BTC makes a move, it's a wait-and-watch game. BTC has been printing red weekly candles for the past
MY MESSAGE TO YOU ALL:-
BTC has been trading within this range for the last few months.
If you are still hanging there with all the pain you had in the last 6 months, I believe you can make it to the next rally too!
So stay strong, and avoid leverage/ futures trades when the market is uncertain.
Try to take a break from the screen and spend some time with your family and friends.
Your mental health is really very important to have a sustainable career in trading.
Focus on your own well-being and start learning new things like TA, FA on-chain, and anything you like, and the money will follow.
Making profits is our secondary goal, preserving funds is the priority here.
Let me know your thoughts in the comments section. HIt a like if you find this chart idea helpful.
This idea is just my view and not financial advice.
Thanks for reading.
Stay strong
#PEACE

BTCUSD expect to fall around $19,953Bitcoin and all other crypto currencies are falling hard and if we see on weekly chart expect BTC to fall around $19,953 by this week. Be very very careful as inflation is at the corner and its already proven that crypto is no more inflation proof and more heavy selling pressure will come in coming days and weeks.
