Btcusdidea

BTC Will Bring it Down!BTCUSD is making its way downtrend as it shows a sign of strength as it breaks the 30740 area of weekly support that has been respected multiple times. However, this bearish strength will want the sellers have the power to pull it more as it breaks the weekly support. A retracement along 23975 will be possible and will wait as it make a decision along that area of support. #tyor #dyor

BITCOIN NEXT MOVEBTC NEXT MOVE
The 30,000$ level has been cleared and we expect a reversal back to $43k zone to sell down below $9000. Then we move in for $500k phase.
Let's go.
What's your take? comment below.
#bitcoin
#btcusdt

Is this divergence relevant and BTC will pop?As we all have noticed, recently, BTC is strongly correlated with the stock market, and considering this correlation a true one, one may wonder if the recent divergence is of any relevance?
What I mean by this is that looking at the Nas100 chart above we can see that recently, although Nas has made a new low, this was not followed by BTC.
Considering that I expect the recent breakdown of support for Nas to be a false one and the index to correct higher could this translate into a pop in BTC's price?
More, looking strictly at BTC's chart we can see that after the 25k low, the price is consolidating and is trading in a range between 28500 and 31k
A correction in indices could lead to gains for BtcUsd and this can mean a break above 31k resistance.
In such a case, BTC can accelerate its gains towards 36-37k horizontal resistance.
That being said, I'm bullish BTCUSD at this moment and I will remain so as long as the range's support is intact

BTCUSD top-down analysis Hello traders, this is the full breakdown of this pair. We will take this trade if all the conditions are satisfied as discussed in the analysis. Smash the like button if you find value in this analysis and drop a comment if you have any questions or let me know which pair to cover in my next analysis.


Bitcoin bottoms upAs we all continue to look for a price bottom for #Bitcoin #BTC I have been looking at some alternative indicators
One which I found interesting is Ben Cowen's risk indicator which, if history is to go by, has done a pretty good job of indicating the bottom whenever the indicator has turned bright purple falling below 0.20
This has not happened yet which possibly suggest more downside before we see a 'bottom' and I will personally be waiting for this indication before buying
Something you will notice is the indicator does not remain below 0.20 or bright purple for long so this will be something that needs to be monitored closely
It has also done a good job of identifying the tops and good times to sell whenever the indicator turns yellow/red or goes above 0.80
As always leave a like and let me know what you think

Bitcoin- What I would like to see to open a trade (buy or sell)Yesterday I said that BTC doesn't show any power to the upside, but, even if I'm bearish overall, let's be honest, bears are also dead and lack conviction.
So, at this moment, I sit and wait with a clearlettingin my mind:
1. Bullish scenario:
What I would like to see for opening a buy trade is a false break under the range's support (28.500) and a strong reversal back inside the range and above 30k. That for me is an indication that bulls are not letting Bitcoin drop and this is accumulation.
2. For a sell trade:
Would be exactly the opposite, a false break above 31k resistance and a quick drop around support. That for me is a sign that this was distribution.
For the obvious reasons, I will not trade the break in Bitcoin's case at this moment

BTCUSD BTCUSD broke a structure to the downside, expecting a correction towards the supply zone that caused the entire short move

BTC: Still under pressure!Bitcoin
Intraday - We look to Sell at 30666 (stop at 31424)
Daily signals are bearish. 50 4hour EMA is at 30680. Intraday rallies continue to attract sellers and there is no clear indication that this sequence for trading is coming to an end. 30974 has been pivotal.
Our profit targets will be 28707 and 28207
Resistance: 30000 / 31000 / 31400
Support: 29000 / 28500 / 27800
Please be advised that the information presented on TradingView is provided to Vantage (‘Vantage Global Limited’, ‘we’) by a third-party provider (‘Signal Centre’) . Please be reminded that you are solely responsible for the trading decisions on your account. There is a very high degree of risk involved in trading. Any information and/or content is intended entirely for research, educational and informational purposes only and does not constitute investment or consultation advice or investment strategy. The information is not tailored to the investment needs of any specific person and therefore does not involve a consideration of any of the investment objectives, financial situation or needs of any viewer that may receive it. Kindly also note that past performance is not a reliable indicator of future results. Actual results may differ materially from those anticipated in forward-looking or past performance statements. We assume no liability as to the accuracy or completeness of any of the information and/or content provided herein and the Company cannot be held responsible for any omission, mistake nor for any loss or damage including without limitation to any loss of profit which may arise from reliance on any information supplied by Signal Centre.

Bitcoin Technical AnalysisCandlesticks are the fastest way to show the state of the market in my opinion. Currently, the weekly candle is a bearish candle with antennae appearing, reflecting buying force appearing but selling force still prevails as shown in the body of a very long bearish candle, so the downtrend prevails. It is possible to end this week with a doji before a bearish or bullish candle appears to confirm whether the market continues to decline or rise.
Currently BTC price is at 29,000 below the 32,000 support price line. If BTCUSDT price fails to break above $32,000, the bear market continues and BTCUSDT continues towards $19,000.
Therefore, we need a financial plan to buy BTC at the best price and a suitable strategy to increase assets.

BTC Head and shoulders 15 Mins.There is a Head and shoulders pattern in 15 min chart. It seem %4 up.

BTCUSD Shorting SetupYellow: Open Position
Red: Trailing Stop Loss
Green: Take Profit
Always use Trailing Stop Loss when you trade on my signals.
I am not responsible for your loss!
Thanks for visiting.
Happy Trading!

BTCUSD Bull and bear caseIt regained back above $30000 indicates that pair has formed temporary bottom around $25401.
Bull case-
Primary supply zone -$31400 (55-4 HEMA).
Bear case-
Levels to watch- $28000.
buy $30000
SL $28000
TP $40000.

BTCUSDT#BTC is well supported in the 30K area
The next resistance is 32k - 33k
If #Bitcoin broke out the resistance zone next targets can be 36K , 38K and 40K

BTCUSD Local Short!!BTCUSD broke the key horizontal level
Which is now a resistance
After retesting the broken level at 33900.0
And I think that it will fall further down
Onto the target level below

BTCUSD in BUY ZONE !!Hi fellow traders, BTCUSD has finally reached the blue box area and is completing the bigger expanding flat pattern. From this point we are waiting for one more push down as dollar is still showing some strength. If we break the red line the move up will be invalidated. Target will be previous top. Goodluck!

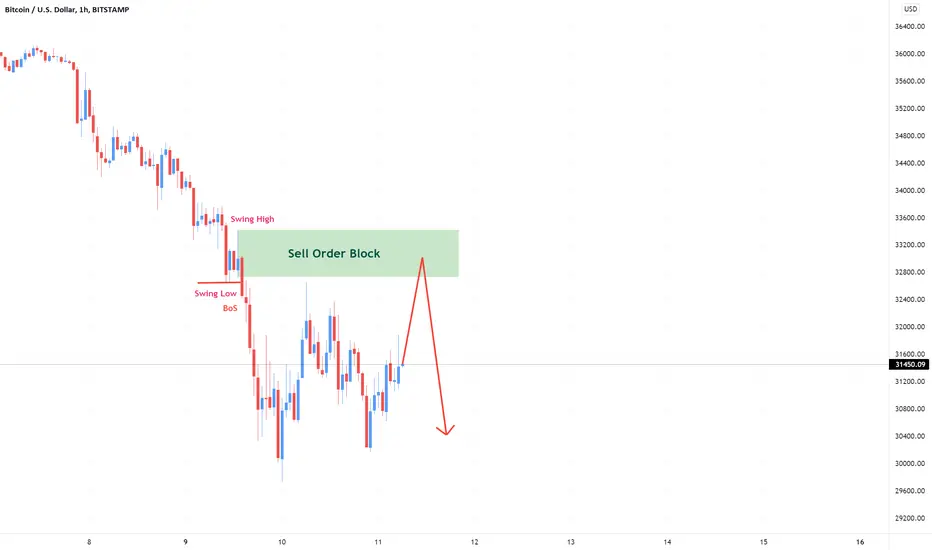
Bitcoin Idea H1Here is my view for BTCUSD on H1. The price could go down, you can put a pending order on the Order block or find an entry on LTF within OB Zone. Trade Safe!

BTCUSD intraday trading & flying to the moon🚀 13 MAY 2022Bitcoin intraday trading alert
3 steps must fulfill before entry
1. 1st breakout done
2. Retracement done
3. 2nd breakout and see you in the sky🚀
Hope you like my Trading Alerts~
Cheers~

BTCUSD - drastic Hello Traders,
From the market of Bitcoin 200 billions wipe out. People loose big money.
Why this happening? The answer is very simple. They do not pay attention to technical analysis.
If you know them, then is very simple how you control your portfolio in crypto.
You have many tools that provide indication of price change direction. Closed you position and case closed. You can open again when price change directions without loosing so much money.
This what I am showing you in my analysis, future change direction, trend line (which are incredible tools), channels and many more.
As a traders our task is to get as much as possible profit and with small losses.
There are the new candlestick formations that showing support and resistance.
Candlestick formation are very powerful indicators, but they have be confirm by support/resistance (SR) - true SR.
There is very high probability to predict hight of swings (waves). Look on USD Index, this will gives you idea that is going on with cripto.
I hope you not one of the traders that lost crypto.
Cheers,
Jim

BTCUSD short4h;
bearish trend line
bellow the emas
waiting for the break of the structure and s/r zone with a momentum candle
1h;
price action a bearish engulfing candle bellow the 14/5ema and below the 200
SL; above the ema's
tp; next s/r

Bitcoin Prediction H1Here is my view for BTCUSD on H1. The price could go down, you can put a pending order on the Order block or find an entry on LTF within OB Zone. Trade Safe!