Btc outlook medium term.. pump to 48.500 and then dump to 29.700Btc i think form a bearish flag in time frame 1 day
It will pump to 48.500
And then dump to 29.700
Btcusdidea

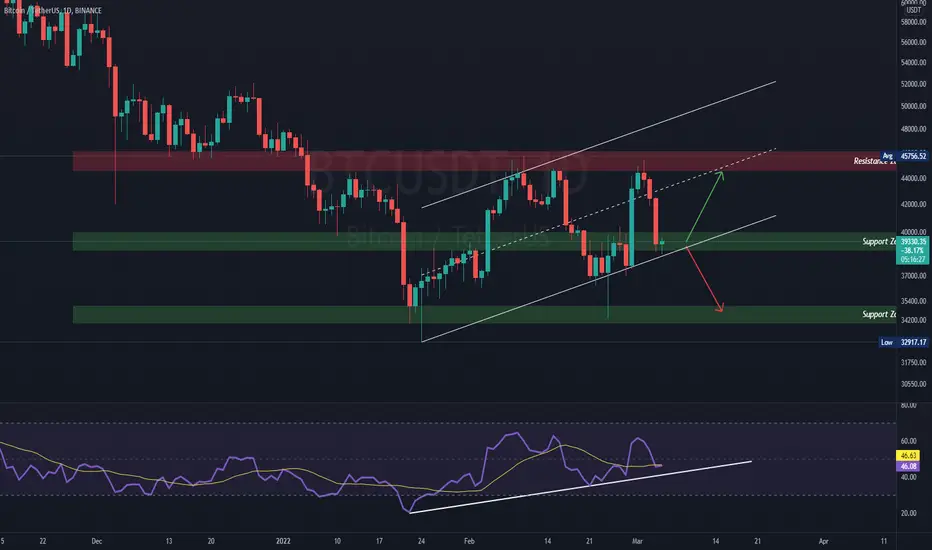
BTC can we breakout this time?BTC / USDT
Since the beginning of 2022 market was uncertain/chop with up and down movements
Also Bitcoin failed many times to break strong resistance around 45k-46k
=> Can we breakout this time ?
The bulls signs start to appear in market and in my chart possible scenarios :
1: the last fast correction before breakout
2: Direct breakout
=> Invalidation :
daily candle close below white trendline then this analysis will fail
=>Don’t forget to like this idea for more analysis
Always DYOR
Best of wishes

Bitcoin Prediction H4Here is my view for BTCUSD on H4. The price should go up, you can put a pending order on the Order block or find an entry on LTF within OB Zone. Trade Safe!

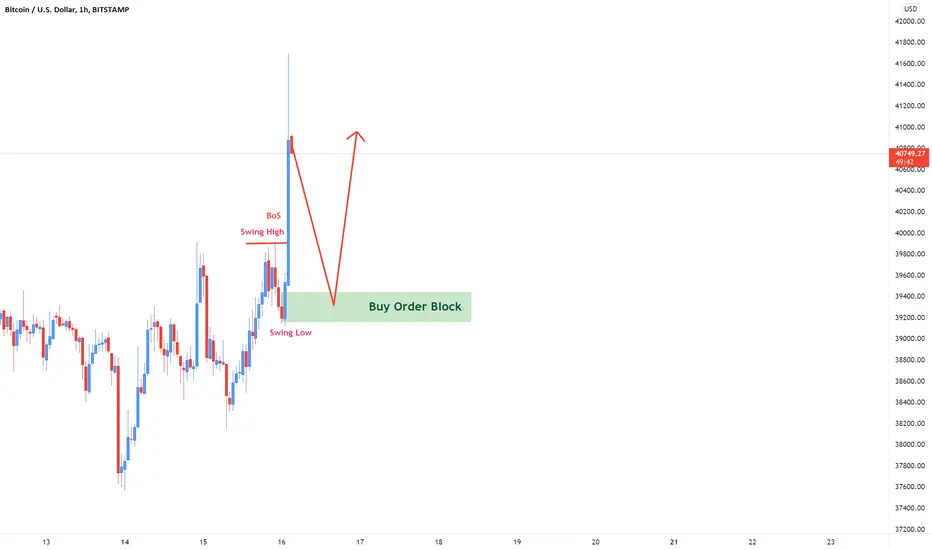
Bitcoin Prediction H1Here is my view for BTCUSD on H1. The price should go up, you can put a pending order on the Order block or find an entry on LTF within OB Zone. Trade Safe!

#BTCUSDT 4 Hour technical Analysis, Possibly a green week ahead?Welcome to this short update on Bitcoin.
Reasons to Follow me?
*9 Years in Trading!
*7 years in Crypto
*Certified Technical Analyst
*Record Holder of Most liked Bitcoin Chart on Tradingview.
*Consistent updates on Markets and Trade Setups
*No Bias
*All-time Top Author on various assets and index charts globally.
*Very Active Community during both bull and Bear Market
Let's get to the chart!
BTC broke below the triangle and pumped right back inside the channel.
See how crazy this PA is?
Anyways, $37k held.
Weekly closed at $37,770.
What's really important here is BTC is acting weirdly for the last few weeks. Every pump is being sold.
USDT Dominance shows bearish indications which give us a possibility of a green week starting from today.
BTC bounced and got back inside the channel points towards the same possibility.
Let's see how it goes. Flipping to the bullish side for altcoins in the short term could be a smart decision IMO.
I'll be opening some longs based on this logic, as said earlier, USDT.D is also pointing towards some bearish move which is good for the market.
What do you think?
Do let me know and hit the like button.
Thank you
#PEACE

Bitcoin Movement BTCUSD H1Here is my view for BTCUSD on H1. The price should go up, you can put a pending order on the Order block or find an entry on LTF within OB Zone. Trade Safe!

BTC is making bullish DEEP CRAB!!!BTC is in the process of developing bullish deep crab harmonic on hourly. This is somehow in confluence to bullish butterfly harmonic from yesterday which completes at $35,707. So we can possibly see some bearish price action before a leg up. We have weekly closure in 12hours from now so further development in price action will be shared upon closing of candle.

btcBitcoin is suffering inside the triangular pattern ... Do not buy or sell until it is clear which way this pattern will break.
👌🏾👌🏾Patience is profitable in trading

Are we being fooled? Perhaps I am onto something here.Possible Wyckoff reaccumulation zone, my timeframe could be off but the picture still stands. It's my first publish please give me your thoughts and feedback.


BTCUSD short term trading & back to the earth 📉 08 MAC 2022Bitcoin Short term trading alert
3 steps must fulfill before entry
1. 1st breakout done
2. Retracement done
3. 2nd breakout and see you at home 📉
Hope you like my Trading Alerts~
Cheers~

BTCUSD UP Trend.!#BTCUSD Looking for Buy trade setup as I mentioned in the Chart.!
Keep Supporting LIKE, COMMENT And FOLLOW.!
Thank You.!

BTCUSD short term trading & flying to the moon🚀 07 MAC 2022Bitcoin Short term trading alert
3 steps must fulfill before entry
1. 1st breakout done
2. Retracement done
3. 2nd breakout and see you in the sky🚀
Hope you like my Trading Alerts~
Cheers~

Bitcoin- Strongly bearish under 42kIn my previous analysis, I said that is imperative for bulls to keep 40k intact, this didn't happen...
At this moment BtcUsd is trading around 38.500 and things are pretty clear from my point of view, Bitcoin has resumed its down move.
My strategy is to sell rallies around 40k with a target at 30k zone support and only BtcUsd above 42k would make me change my bearish opinion

BTC(ANALYSIS MULTI TIME FRAME) W-D-4-1Hello dear trader this is my analysis for btc at multi time frame this analysis for long term but we can understand btc price action.
good luck................

btcusd expecting 12 are you ready ?btcusd expecting 12 are you ready ? we expect big bearish for retest monthly demand zone are you are ready then we enter long at 12 for 100k

#BTC Daily UpdateIn daily timeframe BTC its holding support, and rising channel
RSI is showing bullish trendline.
If Bulls take control we might see another retest on the Resistance Zone ($45,500 - $46.150)
In case bulls lose control we will retest another Support Zone ($35,000 - $34,000)
BTCUSD Prediction H1Here is my view for BTCUSD on H1. The price should go down, you can put a pending order on the Order block or find an entry on LTF within OB Zone. Trade Safe!

Bearish Bat on 4H chart of BTCWe have a bearish bat pattern and this is a worrying factor, Invalidation of this pattern will be $47,348. If you look at geopolitical issues, They seem to be escalating rather de-escalating so this can certainly effect the global financial markets. We do have news that in Russia people are buying BTC by paying premium of over $20k which is a bullish factor whereas recent remarks of FED chair Powell regarding crypto were not good plus he's inclined to impose 0.25% interest rate hike in March so these factors can have a negative impact on crypto. We are bullish on BTC at invalidation point of bat

BTC Bearish Shark on 2HBTC is in process of making a bearish pattern. Chart is pretty much self-explanatory. This is for informational purpose, If you want to take a trade then NFA DYOR!

BTCUSD will break out short!BTCUSD broke the ascending support line
Penetration confirmed
So I think so then we will see a move down towards support areas below 34100

BTC - LONG - BUYbuy buy buy buy buy buy buy buy buy buy buy buy buy buy buybuy buy buybuy buy buybuy buy buybuy buy buy buy buy buybuy buy buybuy buy buy
